AUDUSD Potential UpsidesHey Traders, in today's trading session we are monitoring AUDUSD for a buying opportunity around 0.64500 zone, AUDUSD is trading in an uptrend and currently is in a correction phase in which it is approaching the trend at 0.64500 support and resistance area.
Trade safe, Joe.
Trend Lines

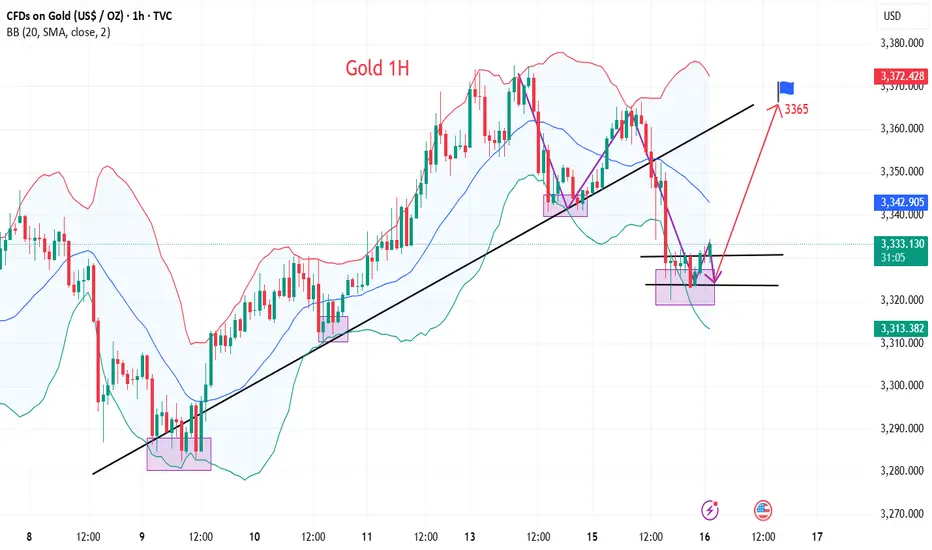
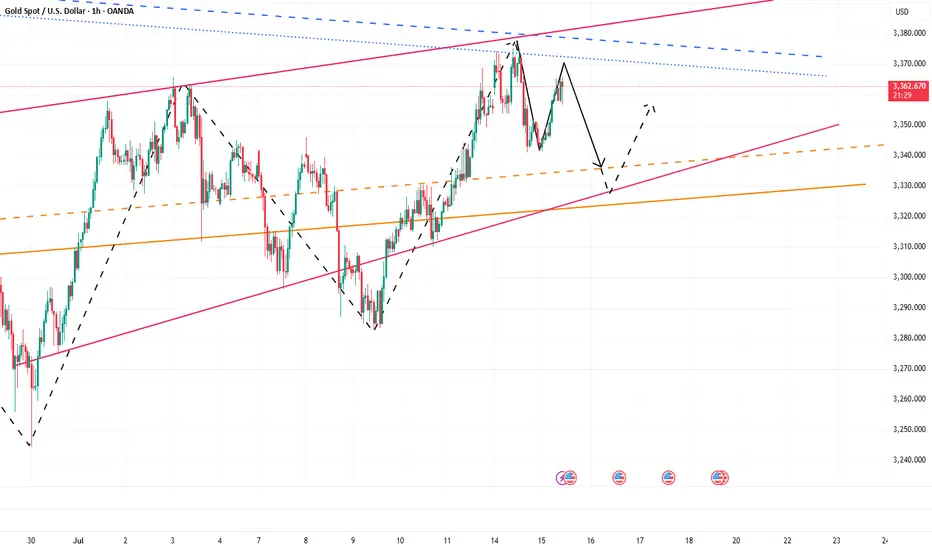
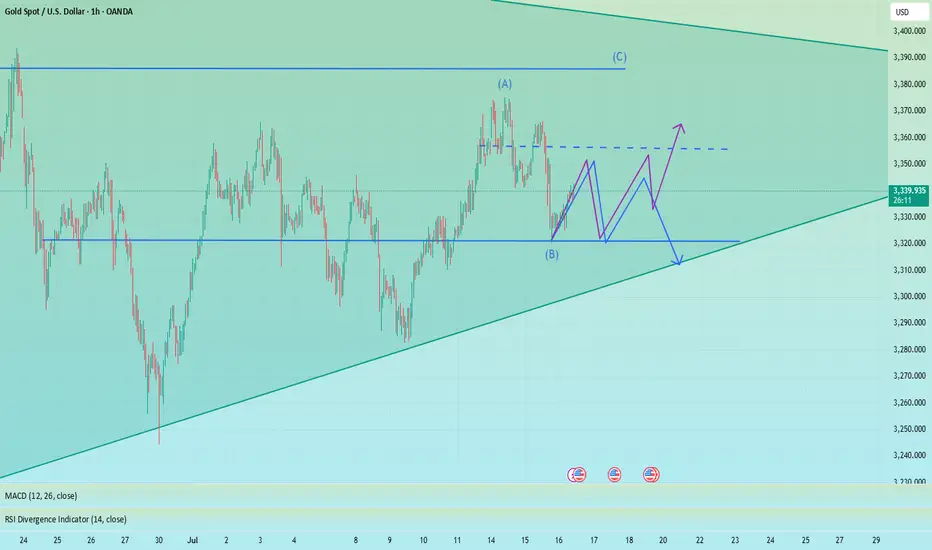
SWING TRADE OPPORTUNITY 〉LONGAs illustrated, I try to visualize what the next bullish impulse could look like if price holds 3300 as a key psychological and algorithmic price level.
Illustrated are the potential buy areas (a current one and an extended one in case a pullback occurs to manipulate lower levels in the next 24-48 hours).
This projection, if valid, could hold from now until next week, so it can be considered a swing trade to hold at least the next week and into the following one).
--
After this post, I will upload another analysis on the Daily timeframe projecting the longer term move, so make sure to go in my profile to check it out.
GOOD LUCK

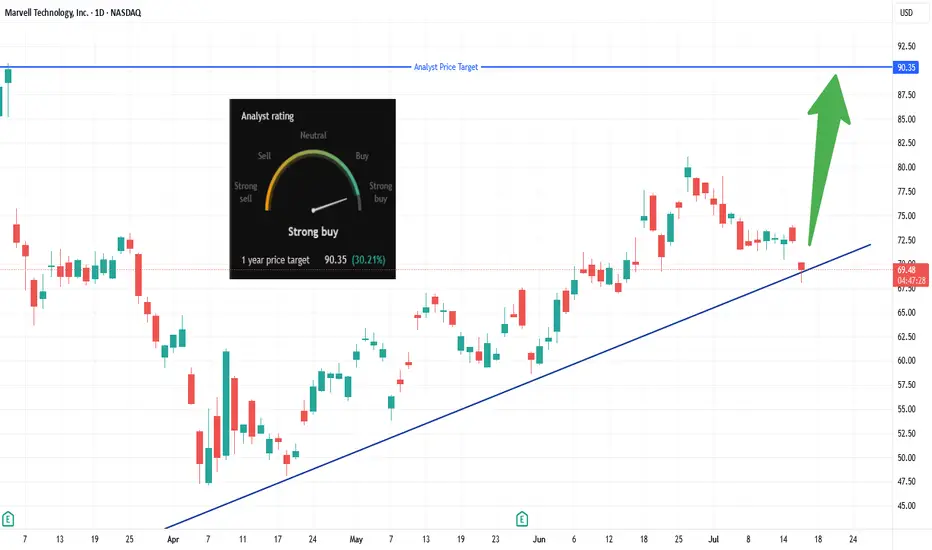
MRVL Long Breakout Setup, Eyes $90 Target!Looking to enter long on a clear breakout above $70.13 (today’s high).
• Entry: Above $70.13
• Stop-Loss: Below today’s low (~$68.50) to protect capital
• Target: $90.35 – per analyst consensus (~+30%)
✅ Why:
📈 Trendline bounce & momentum: Price holding strong above an ascending trendline from April suggests buyers are stepping in.
🏢 AI-chip catalyst: Marvell’s custom ASICs are gaining traction with Amazon, Microsoft, and Google—data-center demand is surging.
💰 Analyst confidence: Consensus is “Strong Buy” with average targets between $90–$94 (some as high as $133).
🧩 Market & Sector Tailwinds: AI chip stocks rallying; Marvell poised as lower-cost custom-chip alternative to Nvidia—and undervalued vs peers.
*** Be sure to follow us for more trade setups! ***
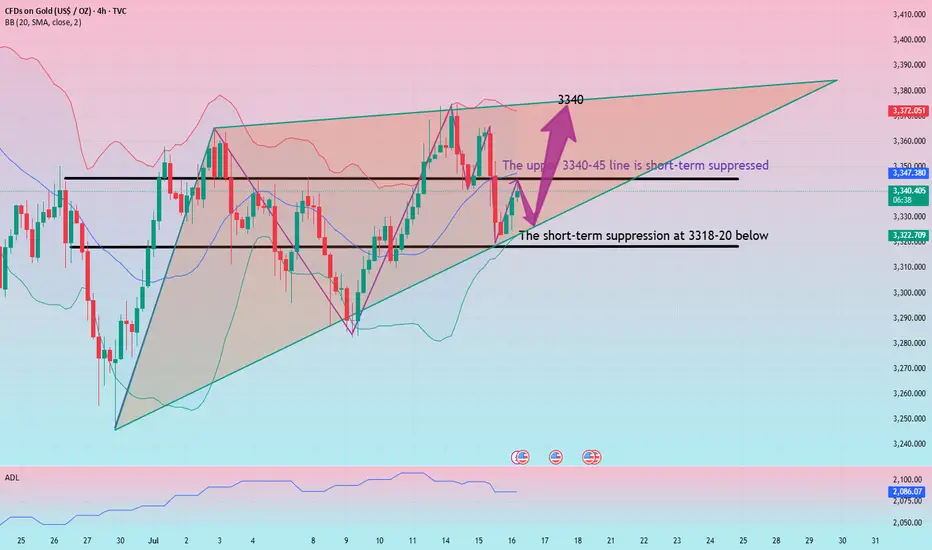
Gold adjustment is complete and continue to be long
Gold rebounded at 3322 today. Technically, it needs to rebound and repair when it falls back to 3318-25, so we can find opportunities to go long below to seize the profit space of the rebound. If your current gold operation is not ideal, I hope I can help you avoid detours in your investment. Welcome to communicate with us!
From the 4-hour analysis, the upper short-term pressure focuses on 3340-45, and the lower short-term support focuses on 3318-20. Relying on this range, the main tone of high-altitude low-multiple cycle participation remains unchanged during the day. In the middle position, watch more and move less, and follow orders cautiously, and wait patiently for key points to enter the market.
Gold operation strategy:
Gold falls back to 3318-25 and goes long, stop loss 3312, target 3340-45, and continue to hold if it breaks;
SOLUSDTThis chart BINANCE:SOLUSDT say to me that change of character. But we need to best confirmations for buy for example: pollback to 143 - 147 $ and higher high next pollback to level.
Support: 147 - 143 - 131.50
Resistance: 158 - 170 - 177 - 183
⚠️Please Control Risk Management in trades.

GBPUSD InsightWelcome to all our subscribers.
Please feel free to share your personal thoughts in the comments.
Don't forget to like and subscribe!
Key Points
- According to CBS and other U.S. media outlets, former President Trump asked Republican lawmakers during a closed-door meeting whether they supported removing Federal Reserve Chair Jerome Powell. It was reported that many lawmakers showed support for the idea. However, in a meeting with the Prime Minister of Bahrain, Trump stated that unless Powell is involved in a scandal related to renovations of the Federal Reserve building, the likelihood of his dismissal is very low.
- President Trump is actively lobbying lawmakers to pass three stalled cryptocurrency bills in the House of Representatives. Optimism about the bills' passage has resurfaced. In particular, the potential strategic use of stablecoins to strengthen the dominance of the U.S. dollar and boost demand for U.S. Treasuries has brought renewed attention to these legislative efforts.
- The U.K.’s Consumer Price Index (CPI) for June came in at 3.6%, exceeding the market expectation of 3.4%. As a result, the possibility of a Bank of England rate cut in July has significantly diminished.
Key Economic Schedule This Week
+ July 17: Eurozone June Consumer Price Index (CPI)
GBPUSD Chart Analysis
The GBPUSD pair failed to break above the 1.38000 level and fell through the trendline after facing resistance in that zone. Currently, it is testing support near the 1.34000 level. If the pair successfully rebounds from this area, we could expect another potential rally toward the 1.40000 level. However, if the support is broken, a further decline toward the 1.31500–1.32000 range is likely.

Hidden Support on RIG: Next Big Move?🔹 Trade Summary
Setup:
Price pulling back to ascending trendline support
Testing major support near $2.58
Analyst 1-year target: $3.76
Entry:
Above today's high of $2.64 (on confirmation of bounce from trendline)
Stop-loss:
Below $2.40 (clear break of trendline)
Targets:
$3.76 (analyst price target / major resistance)
Risk/Reward:
Approx. 1:4 (risking ~$0.25 for ~$1.10 gain)
🔹 Technical Rationale
🔹 Ascending trendline holding as key support since April
🔹 Oversold bounce potential at this zone
🔹 Daily timeframe shows structure for a trend reversal if support holds
🔹 Catalysts & Context
🏦 Strong analyst “Buy” rating; 1-year target at $3.76 (+45%)
🛢️ Oil sector volatility—any rally could boost offshore drillers
🌍 Macro: Global energy demand headlines could trigger momentum
🔹 Trade Management Plan
Entry: Wait for daily close above $2.65 to confirm support
Stop-loss: Move to breakeven if price closes above $3.00
Scaling: Trim partial at $3.20, rest at $3.76 (analyst target)
What’s your view? Are you watching NYSE:RIG ? Comment below:
🔼 Bullish
🔽 Bearish
🔄 Waiting for confirmation
🔹 Disclaimer
Not financial advice. Trade at your own risk.
*** Don't forget to follow us for more trade setups ***

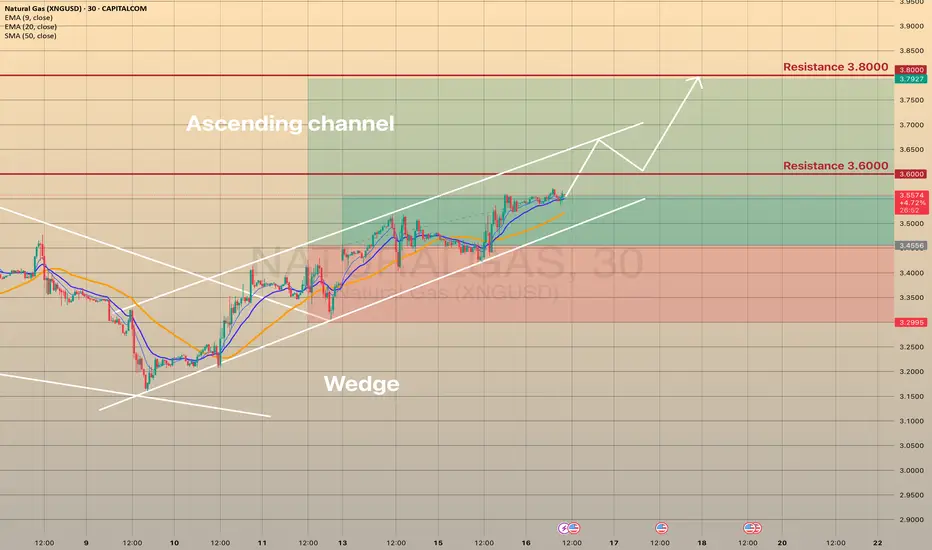
NATURAL GAS - STILL IN THE GAME TRADING IDEA UPDATE -
NATURAL GAS - STILL IN THE GAME🔥
The XNGUSD goes quite well, as predicted. It held the trendline and moving upwards slowly, but surely. Short-term support here is the EMA20 on 4h timeframe. The asset is just below 3.600 resistance level and sma200. Since the July 10, the asset seems to be moving within the ascending channel (pic 2). I expect that the price will break the 3.6000 resistance level, will go towards upper channel border and then, after quick retest, move towards 3.8000. Not a trading advice! Trade cautiously!
BAKE Bulls Targeting 0.105, +1692% Volume SurgeThe chart shows BAKEUSDT trading around 0.0898 USDT on Binance. Overall, the structure indicates that after a strong upward impulse from approximately 0.0835 USDT to 0.117 USDT, the price entered a correction and is now consolidating. This consolidation sits just above an important support level, signaling a possible preparation for the next leg up.
There is a clearly defined support area between 0.0835 and 0.0836 USDT, which has been tested multiple times. The most recent lows were bought up strongly, forming what looks like a potential double bottom or higher low, both common reversal patterns. Beneath this zone, the next deeper support rests near 0.0752 USDT, which would be considered only if the main support fails.
Overhead, the chart identifies resistance levels at 0.1050–0.1071 USDT, where price previously stalled and retraced. This zone aligns with the first target area for any bullish continuation. Further up, 0.1169 USDT marks the prior swing high and the most significant resistance to break for confirmation of a larger trend reversal.
Visually, the chart illustrates how the strong impulse rally was followed by a structured pullback, resembling an ABC correction pattern. The correction appears mature, as price action is tightening within a smaller range. This often suggests that momentum is getting ready to shift back upward if buying pressure sustains.
Several buy signals ("B") are marked on the chart near support zones, while sell signals ("S") have appeared near previous short-term peaks. The clustering of buy signals around the current levels reinforces the idea that traders have been accumulating positions in this area.
Below is the trading setup outlined on your chart:
• Entry Zone: Around 0.0898 USDT
• Stop Loss: Slightly under 0.0836 USDT to protect against a deeper retracement
• Take Profit Target: Between 0.1050 and 0.1071 USDT (initial target)
• Risk/Reward Ratio: Approximately 2.77, which is favorable for long positions
• Potential Gain: +17.69% from entry to target
• Potential Loss: -6.38% if the stop is hit
The highlighted risk/reward box shows the trade aims to capture a substantial move while limiting downside exposure.
The overall price behavior indicates that sellers failed to create new lows, and instead, the market printed a higher low above the key support zone. This is often one of the first signs that demand is absorbing supply and can set the stage for an upside breakout.
While volume data isn’t visible in the chart you shared, typically in this kind of setup, volume contracts during the correction phase and begins expanding again when price approaches a breakout point. Watching for rising volume on any move above 0.0900 USDT could confirm bullish intent.
If price breaks and closes above 0.0900 USDT on the hourly timeframe, this would be the first signal that momentum is flipping decisively in favor of the bulls. Ideally, you want to see a retest of this level hold as support, which would further validate the move. From there, a push into the 0.1050–0.1071 USDT resistance area becomes more probable. If this level is cleared on strong momentum, the extended target near 0.1169 USDT could be achievable.
In terms of sentiment, the fact that multiple buy signals have appeared near the support zone while sellers are absent near the lows reinforces a bullish bias. The risk is primarily centered around whether the 0.0835 USDT level holds. If price closes decisively below it, that would invalidate the current bullish thesis and potentially expose the market to a deeper drop toward the 0.0752 USDT support area.
Overall, the chart presents a constructive technical picture favoring further upside, provided that support holds and buyers can reclaim the short-term resistance above 0.0900 USDT. The consolidation phase appears to be maturing, and the combination of higher lows and consistent rejection of support zones increases the likelihood of a breakout.
Summary of the Bullish Scenario:
• The trend structure shows a strong impulse and controlled pullback.
• The price has respected a key support area repeatedly.
• Buy signals are clustered near the lows, suggesting accumulation.
• A breakout above 0.0900 USDT could trigger a rally toward 0.1050 USDT and potentially higher.
• The risk/reward profile is attractive, offering nearly 3 times the reward relative to the risk.

Axsome Therapeutics (AXSM) Breaks Out — Targeting Analyst Price Axsome Therapeutics (AXSM) has just broken out of a multi-month descending trendline, signaling renewed bullish momentum. I will buy at the open, targeting the analyst price target of $176.68 for a potential strong upside move. My stop will be set just below the prior resistance line (~$110), which should now act as support. This setup offers a favorable risk/reward, with the trendline breakout confirming renewed interest and upside potential.

Gold’s Uptrend Is a Mirage, Bears Are Lurking Beneath!Gold repeatedly touched around 3375 yesterday and then fell under pressure, proving that there is strong resistance above. Moreover, after gold retreated and touched around 3341 yesterday, it did not recover in time and stand above 3350. It was not until today that it rebounded and touched around 3365. The rebound cycle has been extended to the present, and the rebound strength is not very strong.
Since gold retreated, it has not been able to recover the lost ground in time. Gold is under pressure in the 3360-3370 area in the short term. If gold cannot successfully break through this resistance area during the day, then gold will retreat again, and will refresh the 3341 low again, and continue to the 3335-3325 area.
So for short-term trading, I think we can try to short gold in the 3360-3370 area appropriately, looking at the target area: 3350-3340
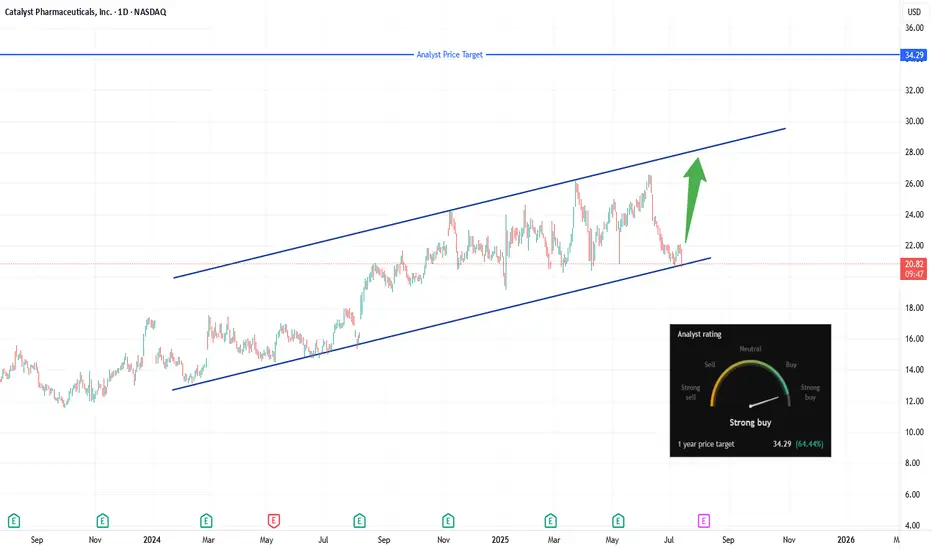
CPRX breakout watch: Eyes on $22.10, channel support intactCatalyst Pharmaceuticals (NASDAQ: CPRX) remains poised at the lower trendline of a well-defined ascending channel, trading in the $20.60–$21.00 area. The setup to monitor now is a daily close above $22.10, which would signal a real breakout through the $21.82–$22.11 resistance zone. A decisive push above that level opens the door for a test of the channel’s upper boundary near $27–$28.
💡 Trade Plan:
Trigger: Go long on a confirmed daily close above $22.10
Targets:
First: Mid-channel resistance around $24.50
Stretch: Upper-channel target of $27–$28
Stop‑Loss: Place below the channel base, ideally under $20.50 to manage risk
Why It Works:
Clear structure: Ascending channel with multiple supports provides clarity on entries and exits .
Momentum catalyst: Breaching the $21.8–$22.1 zone suggests fresh upside momentum.
Reward setup: A small stop near channel support offers a favorable risk/reward targeting channel top.
TL;DR:
Watching for a breakout above $22.10—that’s your entry trigger. Aim for $24.50, then $27–$28, with a stop under $20.50 if support fails.
EURUSD is Bearish After Breaking Regression ChannelHello Traders
In This Chart EURUSD HOURLY Forex Forecast By FOREX PLANET
today EURUSD analysis 👆
🟢This Chart includes_ (EURUSD market update)
🟢What is The Next Opportunity on EURUSD Market
🟢how to Enter to the Valid Entry With Assurance Profit
This CHART is For Trader's that Want to Improve Their Technical Analysis Skills and Their Trading By Understanding How To Analyze The Market Using Multiple Timeframes and Understanding The Bigger Picture on the Charts

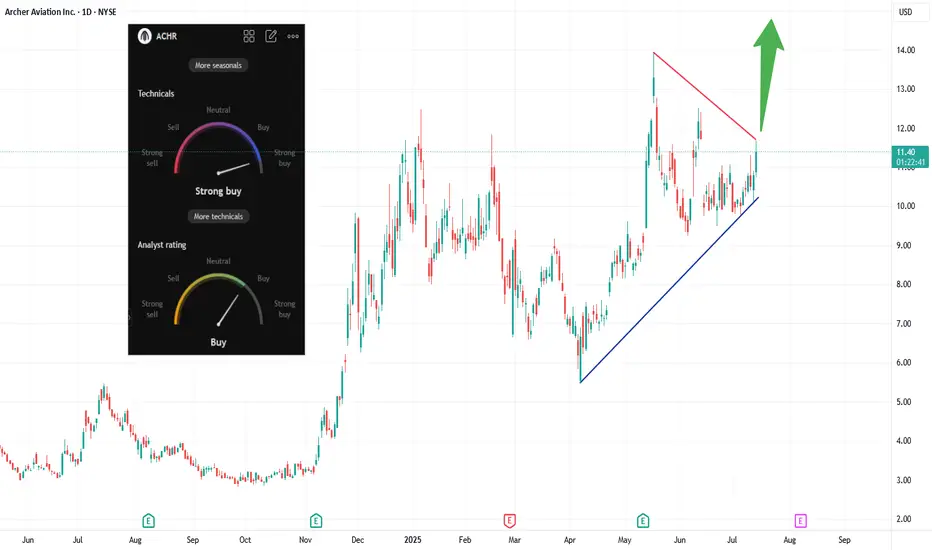
ACHR Eyes Breakout: eVTOL Sector Surges on Regulatory Tailwinds The eVTOL space is lighting up today, ACHR included. Shares have rallied ~7%, tapping into a bullish breakout off its ascending triangle and challenging its descending resistance (see chart). Analyst ratings lean strong‑buy, and technicals support further gains.
📈 Why the excitement?
A Trump executive order is fast‑tracking drone and air taxi regulations, boosting investor confidence across the sector.
Archer recently secured ~$850M in funding to accelerate U.S. rollout — fortifying its balance sheet and manufacturing plans.
The company is part of a new global alliance aiming to streamline eVTOL certification, joining forces with the FAA and five countries.
🚁 What’s next?
If ACHR breaks the red trendline resistance near ~$12, we could see a sharp move toward $14+ (green arrow on chart) as momentum builds. Watch closely for strong volume on the breakout — it could offer a clean entry.
Bottom line:
eVTOL is flying high today, and Archer stands poised to lead the charge. A breakout here could spark a fast move — keep it on your watchlist.
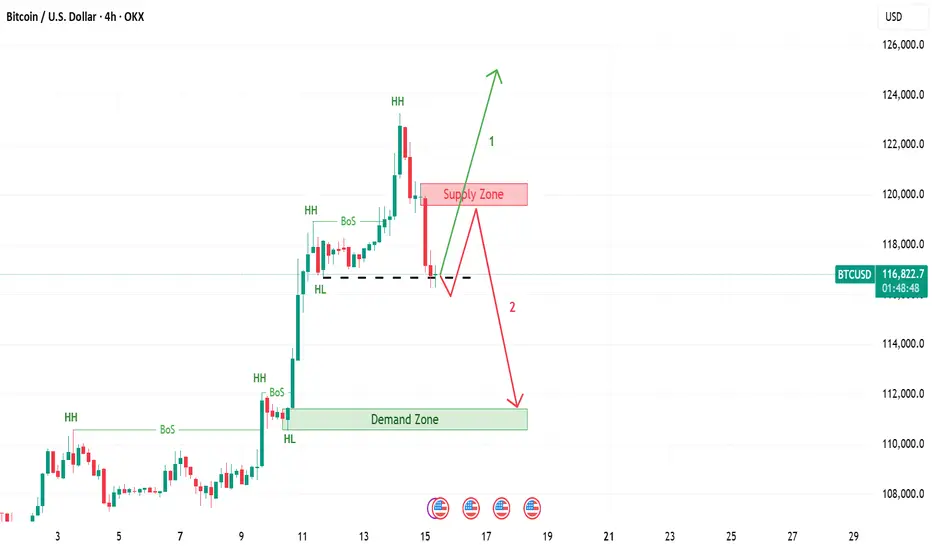
Bitcoin | 2 Scenarios If the 4 hour candle closes below last HL, then expect price return to supply zone and then go down till demand zone. If not, expect continuation of the upward trend, when 4 hour candle breaks last HH.
Which scenario you expect?
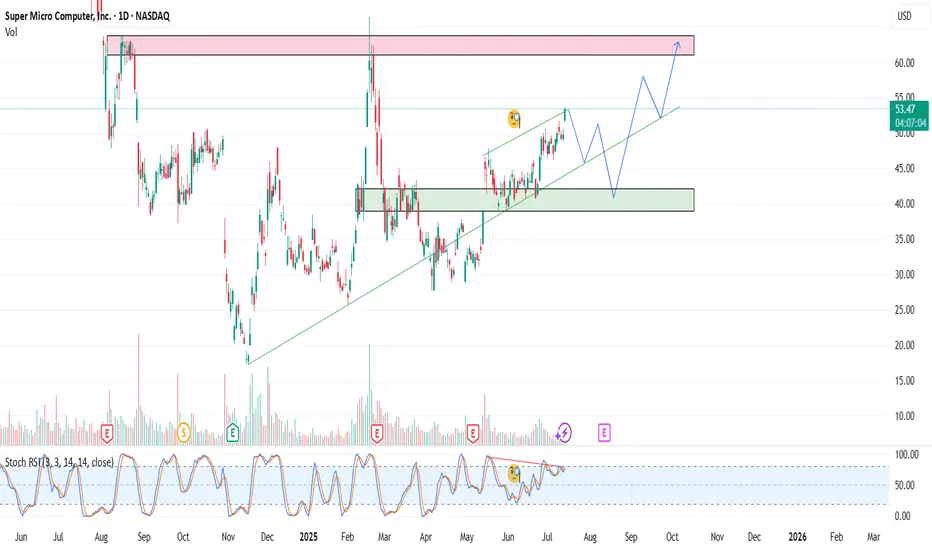
SMCI – Reloading the AI BeastSMCI continues to show strength as a key player in the AI infrastructure space. In this update, I present a new strategy with staggered entry zones at $49, $45, and $38 — designed to capture value during healthy pullbacks within a larger bullish trend.
Entry Plan:
1) $49
2) $45
3) $38
Target:
1) $56
2) $61
3) $66
📉 If price dips back to $45 or $38, I will reload heavier. No FOMO. Let the market come to us.
Drop a 👍 if you're still riding SMCI or waiting for the next entry.
This analysis is for educational and informational purposes only. It does not constitute financial advice or a recommendation to buy or sell any securities. Always do your own research and consider your risk tolerance before making investment decisions.
EURAUD, Trend continuationPrice has made a correction and pulled back into the trendline, a continuation of the uptrend is the next.

TIA Double Bottomed, $4.5 PossibleBYBIT:TIAUSDT.P bottomed out at the $2.3 level. From there, its initial rally took it to the $3.4 level. If a bottom formation occurs again at its current level, another rally could push it first to the $3.8 level, and if the rally is strong, potentially up to $4.5. Strength into higher levels are critical.

Golden Support Holds — Bulls Poised for Another Leg Higher"If gold cannot break through the 3365-3375 area, gold will fall under pressure again, or refresh the recent low of 3341, and continue to the 3335-3325 area." Gold's performance today is completely in line with my expectations. Gold just retreated to a low of around 3320, but soon recovered above 3325, proving that there is strong buying support below.
From the current gold structure, the short-term support below is mainly concentrated in the 3320-3310 area. If gold slows down its downward momentum and its volatility converges when it approaches this area, then after the gold bearish sentiment is vented, a large amount of off-site wait-and-see funds will flow into the gold market to form strong buying support, thereby helping gold regain its bullish trend again, thereby starting a retaliatory rebound, or a technical repair rebound.
Therefore, for short-term trading, I still insist on trying to go long on gold in the 3330-3320 area, first expecting gold to recover some of its lost ground and return to the 3340-3350 area.
Taking another trip to Palo Alto for a quick flip If you want all the details on why I'm taking this trade, refer back to my Palo Alto ideas from Jan 8th and May 21st of this year. The only thing that has changed since May is 4 more profitable trades on PANW, so it's now 25-0. The longest of those 4 has taken 4 days and the average return on them has been 2.16%. So I'm going to Palo Alto again.
The entire cybersecurity sector took it on the chin yesterday, with NET, CRWD, ZS and others all down big and it continued today for them. I know PANW the best, so that's why I'm choosing it, but I think any of them could do well here. PANW is right on its 200d MA and has been above it for the better part of the last 3 years. Even if this trade takes longer than expected to produce, PANW and cybersecurity are not going anywhere. If I had to hold this one for years, I'd be happy to. Well, not "HAPPY" happy, but you get the point.
My exit is signal-based rather than price level based, but I'm targeting under a week for a return of 1-3% on average. Let's hope PANW keeps its record intact and makes this my best trade of the day.
As always - this is intended as "edutainment" and my perspective on what I am or would be doing, not a recommendation for you to buy or sell. Act accordingly and invest at your own risk. DYOR and only make investments that make good financial sense for you in your current situation.

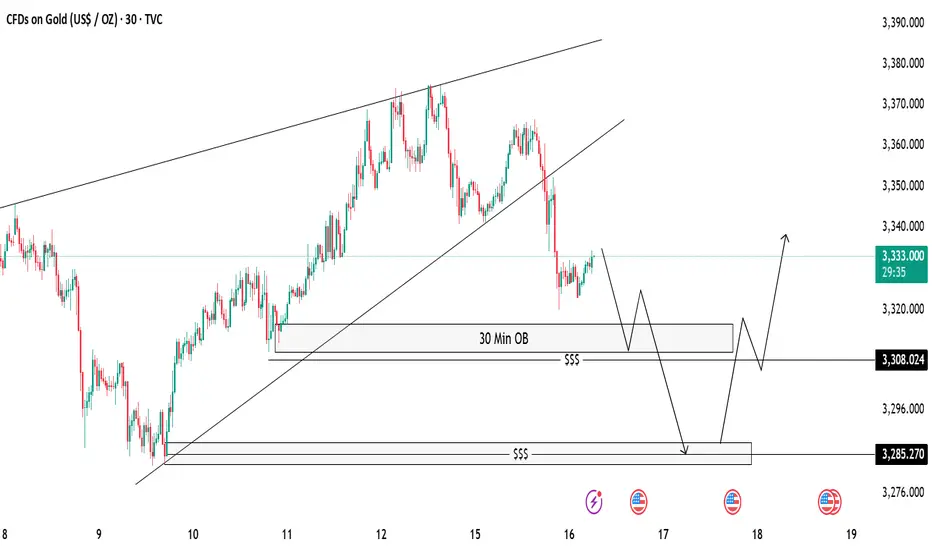
Gold 30-Min OB Analysis – Bounce or Drop..?Gold is showing a break of structure after a big sell-off 🔻. We have marked a 30-Minute Order Block (OB) 📍 which can act as a possible reaction zone.
📌 Two Scenarios We Are Watching:
✅ Scenario 1 (Bullish):
If price taps into the 30M OB and shows bullish rejection 🟢, we can look for buy opportunities, targeting the previous highs near 3335-3340 🎯.
❌ Scenario 2 (Bearish):
If price fails to hold the OB, we will watch for a liquidity sweep (marked with $$$) and expect price to move lower towards the next demand zone near 3285 📉.
⚠️ Key Notes:
Always wait for confirmation before entry.
Patience is the key 🧘♂️ — let the market come to us.
The rebound is not a reversal, continue to shortGold showed a trend of rising and falling back and closing low on Tuesday. The highest intraday rise was 3366, and the lowest fell to 3320. The daily line recorded a medium-sized Yin line with a long upper shadow. The K-line was negative, and the closing line broke the resonance support of the middle track and the short-term moving average, suggesting that the bullish momentum has slowed down and the bears are ready to move. Today, we need to pay attention to the further downward performance of gold. From the 4H level, the price stood firm at the four-hour resistance position last Thursday, and then rebounded upward in the short term. Yesterday, the price fell below the daily support level. Currently, the short-term market is bearish, and attention is paid to the resistance in the 3340-3345 range above. In the one-hour period, the price is in short-term shock adjustment. On the whole, it will be treated as a shock decline before breaking yesterday's low, and the lower side pays attention to the 3225-3320 area support. In the short term, you can consider shorting at 3340-3350 in the European session, and look towards 3330-3320
OANDA:XAUUSD
Beware of false decline and real rise of gold
💡Message Strategy
On Tuesday, the dollar index continued to rise, eventually closing at a high of 98.68, after a mild inflation report sparked speculation that the Federal Reserve might keep interest rates unchanged for the time being.
Spot gold gave up its intraday gains after the release of CPI data, once touching the $3,320 mark, falling for the second consecutive trading day.
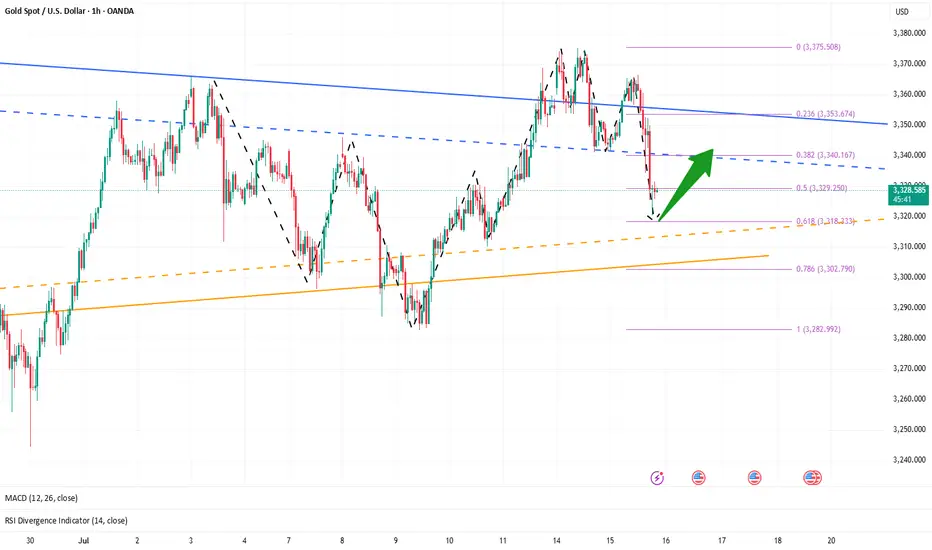
📊Technical aspects
In the hourly chart, gold has already touched the support trend line overnight.
Therefore, at present, it may be inclined to rebound, and gold still maintains an upward trend as a whole.
However, the upper 3340-45 is a short-term suppression position. If it cannot stand firm and break through 3340-45 today, it is not ruled out that it will continue to maintain 3320-40 for consolidation.
On the contrary, as long as it can stand firm above 3345 today, then gold will really rise in the future.
It is very likely that the high point of 3375 at the beginning of this week may be refreshed.
Therefore, in terms of operation, I suggest paying more attention to 3320-30. After all, 3320 is the overnight low. As long as it is not broken again, the probability of gold rising is very high.
However, if it falls below 3320 again today, it is not ruled out that it will continue to refresh the low.
💰Strategy Package
Long Position:3320-3330,SL:3305,Target: 3365