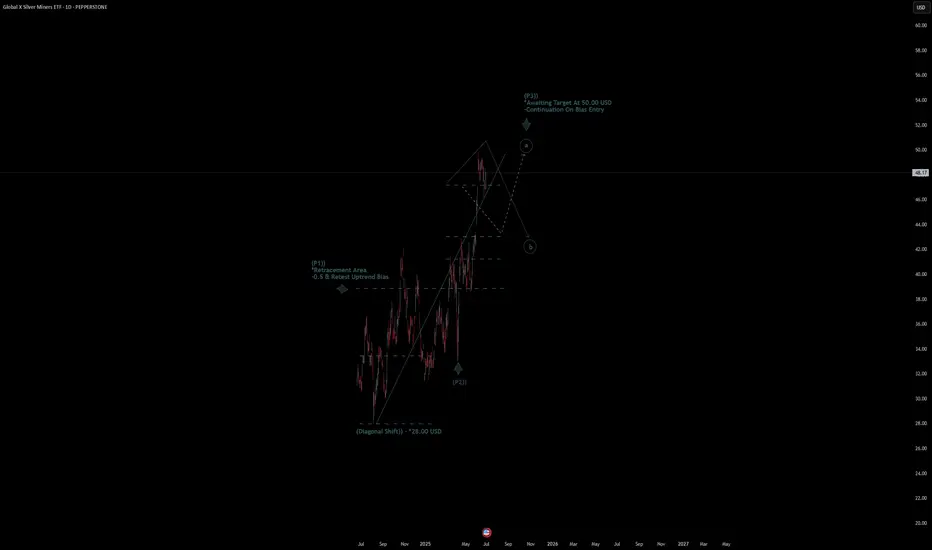
Global X SIlver ETF Quote | Chart & Forecast SummaryKey Indicators On Trade Set Up In General
1. Push Set Up
2. Range Set Up
3. Break & Retest Set Up
Notes On Session
# Global X SIlver ETF Quote
- Double Formation
* (Diagonal Shift)) - *28.00 USD | Completed Survey
* Awaiting Target At 50.00 USD
- Continuation On Bias Entry | Subdivision 1
- Triple Formation
* (P1)) / (P2)) & (P3)) | Subdivision 2
* (TP1) = a / Long Consecutive Range
* (TP2) = b / Short Consecutive Pullback | Subdivision 3
* Daily Time Frame | Trend Settings Condition
- (Hypothesis On Entry Bias)) | Regular Settings
- Position On A 1.5RR
* Stop Loss At 45.00 USD
* Entry At 48.00 USD
* Take Profit At 53.00 USD
* (Uptrend Argument)) & No Pattern Confirmation
* Ongoing Entry & (Neutral Area))
Active Sessions On Relevant Range & Elemented Probabilities;
European-Session(Upwards) - East Coast-Session(Downwards) - Asian-Session(Ranging)
Conclusion | Trade Plan Execution & Risk Management On Demand;
Overall Consensus | Buy
Trend Lines
Gold Wave Analysis – 30 June 2025
- Gold reversed from support level 3250.00
- Likely to rise to resistance level 3400.00
Gold recently reversed up from the support level 3250.00 (which stopped wave (b) at the end of May, as can be seen from the daily Gold chart below) intersecting with the lower daily Bollinger Band and the 50% Fibonacci correction of the upward impulse from May.
The support level 3250.00 was further strengthened by the upward-sloping support trendline from February.
Given the clear daily uptrend, Gold can be expected to rise to the next resistance level 3400.00, which stopped the previous short-term correction ii.

ZCXUSDT Breaks Key SupportZCXUSDT has broken below a strong support level, followed by a clean pullback and continuation to the downside. The projected target stands near $0.016, presenting a potential accumulation opportunity. If the structure plays out, the full downside objective aligns with the broader setup target highlighted on the chart.

Short BTC, it is about to retrace and test 100000 again!As BTC gradually fell back, the rebound did not stand above 110,000 in the short term, proving that there is strong selling pressure above, and the trend line formed by the technical high point 111,000 and the second high point 110,000 formed an important resistance area, which limited the rebound space of BTC and strengthened the demand for BTC's short-term retracement.
According to the current trend, the short-term oscillation bottom area of 106,000 may be broken at any time. Once it falls below the oscillation area, it may arouse a certain degree of profit-taking chips and stimulate BTC to accelerate its decline. I think BTC will at least test the 105,000-104,000 area again during the retracement, and may even test the 100,000 integer mark again.
Therefore, shorting BTC is still the preferred option for current short-term trading.
Consider shorting BTC in the 108,000-109,000 area, and the target area in the short term is 104,500-103,500. After breaking this area, the target can be extended to 101,000-100,000.
BINANCE:BTCUSDT BINANCE:BTCUSDT BITSTAMP:BTCUSD

The DXY looks doomedI drew this chart in September 2022. Now, almost three years later, the DXY has broken below its channel.

Short gold, it will fall again when encountering resistanceIn the short term, gold retreated to around 3274 and then rebounded again, and it is only one step away from 3300. Will gold regain its bullish trend again?
I think it is difficult for gold to break through in the short term. Although gold retreated to around 3274 and successfully built a double bottom structure with the second low point and the low point of 3245, it only increased the rebound space; it is not enough for gold to regain its bullish trend. Since gold fell and broke through, the confidence of bulls has been hit hard. The previous support at the technical level has formed a strong resistance area after the top and bottom conversion, and to a certain extent helped the short force. In the short term, gold faces resistance in the 3310-3320 area. Before gold breaks through this area, the short energy still has the upper hand.
Therefore, shorting gold is still the first choice for short-term trading.
It is appropriate to consider shorting gold in batches in the 3300-3320 area, and look at the target: 3385-3375-3365

Go long on dips and short on rallies📰 News information:
1. Gold market liquidity at the end of the month
2. Impact of geopolitical situation
📈 Technical Analysis:
Last week we predicted that gold would rebound. Today, after gold rebounded as expected, we gave a short trading strategy. Gold fell precisely at the point we gave, 3295, and successfully hit our TP3280-3270. The result confirmed the correctness of our trading strategy. Next, we will focus on the long trading opportunities below 3270-3260.
🎯 Trading Points:
BUY 3270-3260
TP 3290-3300
SELL 3295-3300-3310
TP 3280-3270
In addition to investment, life also includes poetry, distant places, and Allen. Facing the market is actually facing yourself, correcting your shortcomings, confronting your mistakes, and strictly disciplining yourself. I hope my analysis can help you🌐.
TVC:GOLD FXOPEN:XAUUSD PEPPERSTONE:XAUUSD FX:XAUUSD FOREXCOM:XAUUSD OANDA:XAUUSD

NZDUSD → Pre-breakout consolidation. One step away from a rallyFX:NZDUSD is consolidating, but the chart shows signs of readiness to shift to a distribution phase, which could lead to a rally.
Against the backdrop of a falling dollar, which is continuing its main trend, the NZD may break out of consolidation in a distribution pattern. Since the accumulation is quite large (taking into account the long squeeze), the trend may be strong.
A pre-breakout consolidation is forming relative to 0.6080, followed by the price breaking through the resistance of the global trading range. Consolidation above 0.6080 will confirm the breakdown of the structure, which could trigger distribution
Resistance levels: 0.6080, 0.612
Support levels: 0.6062, 0.604
The price may be supported by a bullish trend and a decline in the dollar. A breakout from the 4-month consolidation may be accompanied by a continuation of the uptrend until the intermediate high of 0.6355 is reached in the medium term.
Best regards, R. Linda!

SOLANA → BINANCE:SOLUSDT.P is consolidating after breaking through trend resistance. The market trigger is 148.0, and Bitcoin is provoking the market to recover...
The market is buying back all the losses. SOL breaks the local downward resistance and forms consolidation with a trigger of 148.0. The market has come to life following the rallying Bitcoin. If the general trend continues, SOL may break out of the accumulation zone and form a distribution towards 154.0
The latest retest of resistance is provoking a correction. Before rising, the price may test the zone of interest at 144 or the lower boundary of consolidation at 142.2. The ideal scenario would be a false breakdown of support at 142.2 before rising.
Resistance levels: 148.0, 154.2
Support levels: 142.2, 137.5
Fundamentally, the situation for the crypto market is improving. Technically, the market is also showing positive dynamics. SOL is consolidating after growth, which is generally a positive sign. Now we need to wait for the price to break out of consolidation and continue its growth. One of the signs of this is a rebound from the 0.5 range and a quick retest of resistance with a gradual squeeze towards the trigger.
Best regards, R. Linda!

Long idea on CRVWe need close on all HTF above trendline and we are good to go.
So far Rsi looking strong, still plenty of upside.
I'm in with small position, waiting for confirmation to add to my position

Failed to break higher — now it’s time to crash.After a sharp rally, the market has hit its previous all-time high.
📌 A double top is now forming — signaling a potential short-term pullback.
Get ready for a possible dip — let’s go! 🚨
OANDA:GBPCAD

Trading Recommendations for NZD/USDNZD/USD remain in a dominant bullish wave that began in April. Wave extremes from a "horizontal pennant" on the chart. The bearish phase since May 26 remains a part of internal correction. The bullish leg from June 23 has reversal potential.
Weekly Forecast:
The pair is likely to continue its upward movement for a few more days. A sideways trend and reversal conditions are expected near the resistance zone. Downward movement becomes more probable in the second half of week.
Potential Reversal Zones
Resistance: 0.6070 / 0.6120
Support: / 0.5940 / 0.5890
Recommendations:
Selling: Low potential and potentially risky.
Buying: Can be considered if reversal signals appear near the support zone.

Gold Threatens Yearly Support- Bulls on NoticeGold is threatening a break of the yearly uptrend with Friday’s decline clearing the monthly range low. The focus into the start of the month is on technical support at the 5/29 swing low / May low-day close (LDC) 3240/45.
A break / close below this threshold would be needed to suggest a more significant correction is underway towards the 38.2% retracement of the November rally at 3132 and the 100% extension of the April decline at 3072- both areas of interest for possible downside exhaustion / price inflection IF reached. Resistance now at 3355/80 with a breach above the Record high-close at 3431 needed to mark resumption of the broader uptrend.
-MB

GBP/USD Testing Resistance at 2022 HighsSterling marked an outside weekly-reversal through slope resistance last week with the rally trading just below resistance into the close of the month at the 2022 swing high at 1.3749. Look for support at the June high at 1.3633 IF price is heading higher on this stretch with a breach / close higher exposing the 61.8% extension of the 2022 advance at 1.4003. Weekly support rests with the 78.6% retracement at 1.3414 with media-term bullish invalidation now raised to the April high-week close (HWC) at 1.3270.
-MB

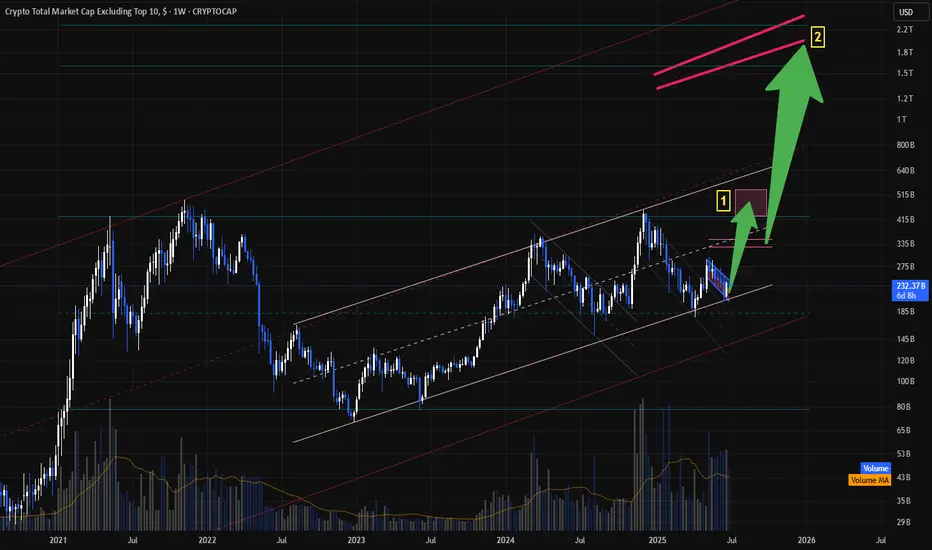
A Mini Rally and a Mega Rally expectation for Others MCapHi all,
This is how I follow Others Mcap.
If we break the ascending channel to the down, this idea will be invalid.
As long as the price keeps in the channel up, we should touch the upper channel band at some point which is Target #1 for me for a risk adjustment. I expect it to be in mid/late August. Then a small correction like 5-8 weeks. By beg. of October, I expect Others to start MEGA rally till end of the year.
These are just my opinions and not a financial advise.
DYOR!
Cheers!
USDJPY: Intraday Bearish ConfirmationLast week, I shared an update on a confirmed structure breakout for 📉USDJPY on a 4-hour chart.
On retesting the broken structure, the price showed a strong bearish signal.
I observed a rising wedge pattern with a broken support line
This breakout suggests a high likelihood that the price will decline to the 143.81 / 143.31 levels.

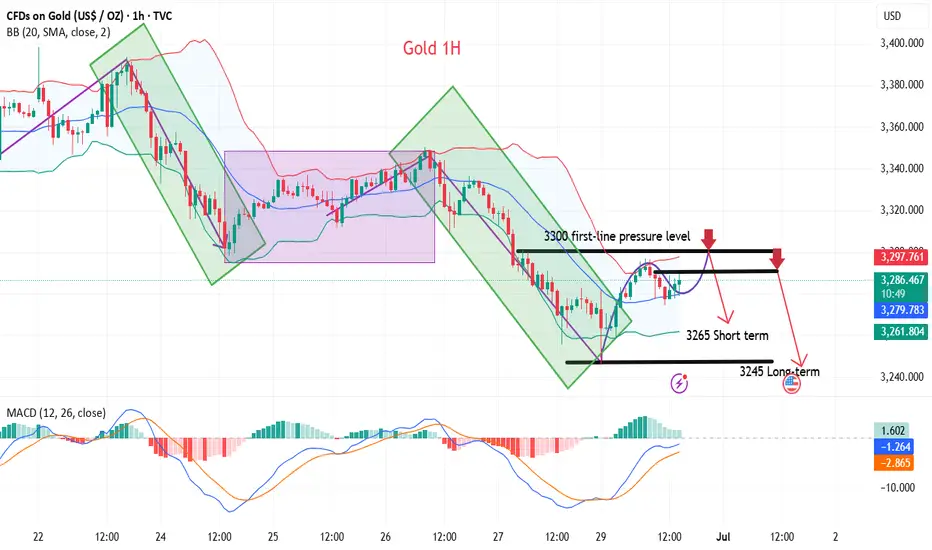
Gold bulls are suppressed, rebound short-selling range grasp
💡Message Strategy
The cooling of geopolitical tensions and the easing of Sino-US trade tensions have boosted market risk appetite, and rising stock markets have weakened the attractiveness of holding gold, suppressing gold prices.
However, geopolitical tensions have not completely calmed down, and expectations of a September rate cut by the Federal Reserve have increased, limiting the decline in gold and providing support. In terms of operations, it is recommended to treat it with a volatile mindset.
📊Technical aspects
On the daily chart, after gold hit a two-month high in mid-June, it encountered resistance and fell back, hitting a new low in nearly a month, and the short-term trend is biased downward.
For gold's upper pressure, pay attention to the intraday high of $3,300. The gold price bottomed out and rebounded during the day. For gold's lower support, pay attention to the intraday gold price rebounding above the rising position of $3,270, followed by the intraday low of $3,247, which is also near the low point of the gold price after the rise in May. The 5-day moving average and the MACD indicator cross downward, showing that the short-term technical side is dominant.
From the 1-hour analysis, the upper short-term resistance is around 3277-3281, the 3295-3301 line is suppressed, and the 3316 line is suppressed.
In terms of operation, the main short-term support is around 3250-3255. The overall main tone of high-altitude participation remains unchanged in this range, so pay attention in time.
💰Strategy Package
Short Position:3290-3300,SL:3316,Target: 3240-3250
Trading Recommendation and Analysis for GBP/USDThe British pound is rising, but the accompanying Marlin oscillator is quite weak. Before the bulls are not just the desired targets - 1.3834, 1.3935, etc. - but also potential traps from which the bears could launch an unstoppable offensive.
On the daily chart, the trend remains upward, which is also confirmed by the Marlin oscillator breaking upward out of its own descending channel. However, there is also suspicion that this might be a trap - it may be a false breakout from the channel, similar to what occurred on May 12, when it was a breakout to the downside (highlighted by a yellow rectangle) .A trend reversal would occur if the price breaks below the support level at 1.3635, which is additionally reinforced by the MACD line.
On the four-hour chart, the price appears to be finishing a consolidation phase. During this consolidation, the Marlin oscillator has had time to decompress and prepare for further growth. As long as the trend remains intact the no signs of reversal appear, we expect the price to continue moving gradually upward.

Analysis and layout of BTC trend in the third quarter📰 News information:
1. Pay attention to the movement of the cryptocurrency market
2. The impact of DAA, etc.
📈 Technical Analysis:
As demand weakens and supply pressure rises, BTC's network valuation exceeds the speed of activity. Exchange inflows and negative DAA divergences indicate that despite price stability, the risk of selling remains. Currently, BTC is experiencing a retracement after a rebound. In the short term, it is still possible to retrace to 106,500 and then rise after stabilizing.
🎯 Trading Points:
SELL 108000-107500
TP 107000-106500
BUY 106500-106000
TP 107500-108000
In addition to investment, life also includes poetry, distant places, and Allen. Facing the market is actually facing yourself, correcting your shortcomings, confronting your mistakes, and strictly disciplining yourself. I hope my analysis can help you🌐.

GOLD. Why is Gold Rising Again?The yellow metal is one again receiving support driven by two main factors. The first is the continued risk of failure in the negotiations between Tehran and Tel Aviv. The second is related to the chronic weakness of the U.S. dollar amid the American economy slipping into a recession, which may persist for a prolonged period, and the uncertainty surrounding the future global impact of Donald Trump's customs tariff policy.
From a technical perspective, gold prices continue to be in a long-term upward trend. The bullish momentum, driven by the aforementioned reasons, may continue after breaking and consolidating above the 3340 level.
Technical Outlook and Trading Idea:
The price is trading above the middle line of the Bollinger Bands, as well as above the 5-and 14-period SMAs , which have crossed and are giving a buy signal. The RSI is crossing the 50% mark, also indicating a buy. the Stochastic Oscillator is above 50% and continues to rise.
In this situation, I believe gold should be bought, with a potential rise toward 3384. A likely entry point for a buy position could be considered around 3347.

GOLD - Price can grow to resistance line of wedge patternHi guys, this is my overview for XAUUSD, feel free to check it and write your feedback in comments👊
Some time ago price bounced from $3390 level and declined, but soon turned back and even entered to resistance area.
After this, the price dropped from this area and then started to grow inside the wedge, where it at once made an impulse up.
Price reached $3390 level one more time and broke it, after which it continued to grow to the resistance line of the wedge.
When it reached this line, price turned around and in a short time declined below $3390 level, breaking and then made a retest.
Later, Gold broke $3300 level and fell to the support line of the wedge, after which it rose to the resistance area.
Now I expect that Gold can make a correction to almost support line and then bounce up to $3320 resistance line of the wedge.
If this post is useful to you, you can support me with like/boost and advice in comments❤️
Disclaimer: As part of ThinkMarkets’ Influencer Program, I am sponsored to share and publish their charts in my analysis.

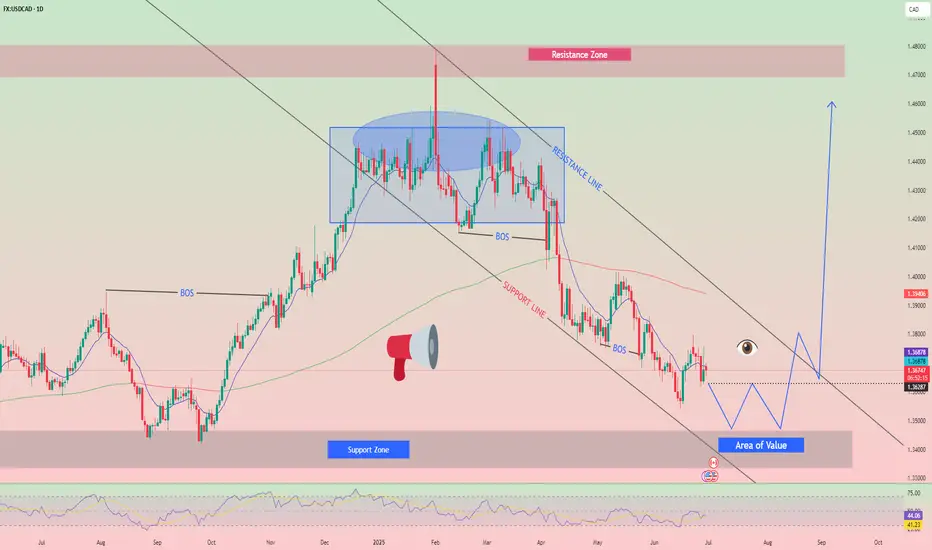
Weekly Forecast Based on Simplified Wave Analysis for USD/CADThe downward wave that formed on the USD/CAD chart tis year has been followed by a corrective move since late May. The pair is largely confined to a sideways price channel. The current wave structure remains incomplete, lacking final segment.
Forecast:
The pair may decline further in the coming days, reaching the support zone. A reversal and upward movement from support may follow. The resistance zone reflects the upper boundary of the pair's expected weekly volatility.
Potential Reversal Zones
Resistance: 1.3800/ 1.3850
Support: 1.3640/ 1.3590
Recommendations:
Selling: Possible intraday in small volumes, not beyond the support zone.
Buying: Consider only after confirmed reversal signals appear near support.
HelenP. I Gold may retest resistance before dropping to $3230Hi folks today I'm prepared for you Gold analytics. If we look at the chart, we can see that after a period of sideways consolidation, gold started to form lower highs under a descending trend line. Each time the price approached this trend line, it was rejected, confirming strong bearish pressure. Most recently, XAUUSD broke below the support-turned-resistance level around 3295, entering the lower resistance zone. Now, the price is trading just under this area, which has acted as a strong supply zone in the past. Given the current technical setup, I expect that gold may show a minor upward move to retest the resistance zone between 3285 - 3295. However, this retest is likely to act as a trigger for sellers to step back in. The prevailing downtrend and repeated failures to break the trend line suggest further weakness ahead. That’s why I’ve placed my target at 3230 points - a level that aligns with the next major support on the chart. This area could provide the next bounce opportunity, but for now, the bearish structure remains dominant. If you like my analytics you may support me with your like/comment ❤️
Disclaimer: As part of ThinkMarkets’ Influencer Program, I am sponsored to share and publish their charts in my analysis.
