EURUSD – June 30th OutlookBias: Still bullish
Liquidity zone pullback: 1.16853 held as expected
Next move: Watching for break of Friday's high at 1.17342 → possible retest of 1.17311 → continuation upward
HRHR Setup: If price returns to 1.16853 today, it's a high risk play due to end-of-month volatility
Caution: If we break below the previous 4H candle, we could range between 1.17342 and 1.16853 for the remainder of the day.
🔹 Approach with caution — it’s the final trading day of the month.
Trend Lines

Gold 1Hr OutlookGotten a trendline breakout. So am expecting the move according to the path lines drawn on the chart

GOLD (XAUUSD) – June 30th OutlookWeekly: Gold opens bullish while still respecting the Dec 2024 trendline, despite the last two weekly candles closing bearish.
Daily: Currently at 3295, approaching key intraday bearish structure at 3310.
Last Week’s Bounce: From 3274 delivered 220+ pips, now becoming a pivotal reaction zone.
If 3310 Breaks: Expect continuation to 3344 – a 350-pip swing.
If 3310 Rejects: Anticipate a move back to 3274 for re-evaluation.
⚠️ Note: Today is the final trading day of the month. Watch for false breakouts and potential liquidity traps.

EURUSD InsightHello to all our subscribers, and welcome!
Please share your personal opinions in the comments. Don’t forget to like and subscribe.
Key Points
- U.S. President Trump commented on the mutual tariff suspension deadline of July 9, saying, “We can do whatever we want. We could extend it, or shorten it,” leaving the door open for an extension.
- U.S. Treasury Secretary Scott Bessent stated that trade negotiations could be finalized by September 1, adding that agreements were nearing completion with more than 10 of the 18 major trading partners.
- President Trump noted that Canada is preparing to implement a digital tax, saying, “We will halt all trade discussions with Canada and within the next seven days inform them of the tariffs they must pay to operate in the U.S.”
- The U.S. Personal Consumption Expenditures (PCE) Price Index for May met expectations at 2.3% year-over-year, while the Core PCE Price Index slightly exceeded expectations at 2.7% year-over-year.
Key Economic Events This Week
+ June 30: U.K. Q1 GDP
+ July 1: Eurozone June CPI, Speech by Fed Chair Jerome Powell, U.S. JOLTS (Job Openings and Labor Turnover Survey)
+ July 2: U.S. June ADP Nonfarm Employment Change
+ July 3: U.S. June Nonfarm Payrolls, U.S. June Unemployment Rate
EURUSD Chart Analysis
The pair is showing a steep upward trend after breaking through a previous resistance level. Further upside potential appears to remain, with the next projected target area around the 1.18500–1.19000 range. However, there is currently a resistance zone in place, making it highly likely that a short-term dip may occur before the upward trend resumes.

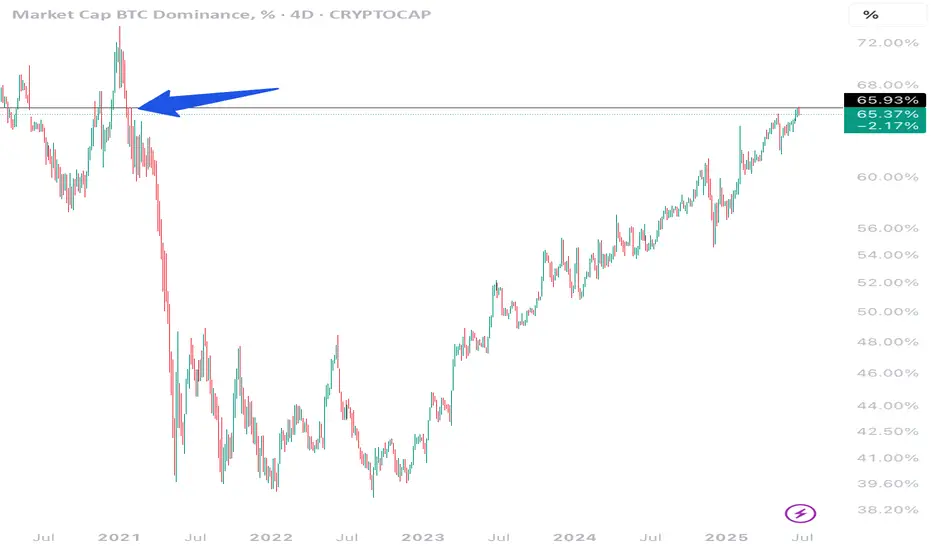
It's over for BTC Dominance, benjamin cowen is wrong hereAlt rally time :) . it will be incredibly hard to overcome this resistance on the chart. Don't listen to benjamin cowen at this point, he is too bullish on btc still. Cya in a few weeks when he changes his mind.
VIRTUAL – Setting Up for a July Breakout - $4 in the Horizon!
Another coin worth bidding on: $VIRTUAL.
It's setting up nicely above the mid-range of the current trading range, with a clean S/R flip off the previous cluster zone.
The 3-day MA is holding well, and the downtrend from the local highs is set to expire on July 6th.
Expecting a strong trend to kick in during the second week of July, with potential to push toward the $4 mark.

#btc #btcusd #elliottwave long buy setup wave 5/3 30Jun25This count is based on my assumptions so anything can happen not a trading or financial advice just for educational purposes only kindly do your own ta thanks trade with care good luck.

FLOKI on Fire! Bullish Summer for FLOKIUSDTDuring the two-month period from July to August, it's unclear what the specific catalyst might be, but Floki appears poised for a price surge between 75% to 133%. The June low at 0.00005923 seems to mark a solid bottom, and from here, I anticipate a bullish trend in Floki’s price.


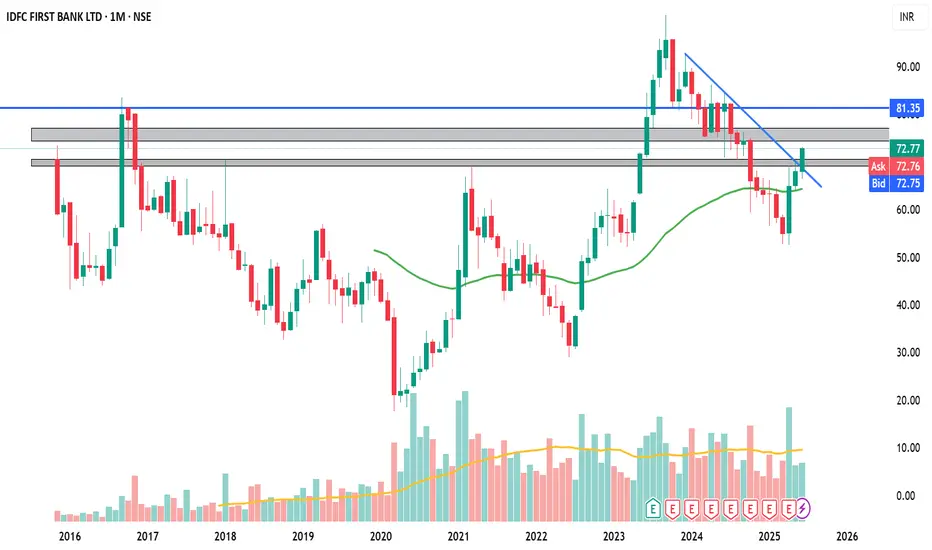
NIFTY50.....Next move to ATH!Hello Traders,
The NIFTY50 has shown breake out of the trendchannel vs triangle structure! It has risen to my cited target area @ 25260 to 25300 points and overcome the targets as well!
Another goal!
Chart analysis:
The ATH @ 26277 points will be the next target, and as I wrote many times, this will be not the end of the structure. I will refrain from mentioning any further goals for the time being.
So, the next move should lead N50 to new ATH`s well above the 26277 range. The potential is given for another long-term wave!
On the downside there is, not so much, potential for a corrective move. While the structure doesn't look complete, I think for at maximum downside potential to 23935 area! It should come, but not yet!
More often than not, the diverging trend lines, possibly created by the triangle structure, will be touched again in the next 1-2 weeks! Well, we will see if so to come, and if...we will judge again!
Caused by a busy weekend, this should be all for today!
Have a great week.....
Ruebennase
Please ask or comment as appropriate.
Trade on this analysis at your own risk.

Gold is in the Bearish DirectionHello Traders
In This Chart GOLD HOURLY Forex Forecast By FOREX PLANET
today Gold analysis 👆
🟢This Chart includes_ (GOLD market update)
🟢What is The Next Opportunity on GOLD Market
🟢how to Enter to the Valid Entry With Assurance Profit
This CHART is For Trader's that Want to Improve Their Technical Analysis Skills and Their Trading By Understanding How To Analyze The Market Using Multiple Timeframes and Understanding The Bigger Picture on the Charts

GOLD READY FOR SELL (READ CAPTION)Hello trader. what do you think about gold
current price; 3273
gold is breakout resistance zone in weekly candles i think gold retest upside and testing resistance then gold fall down
resistance zone : 3295_3325
support zone 3250
demand zone:3200
please like comment and follow thank you

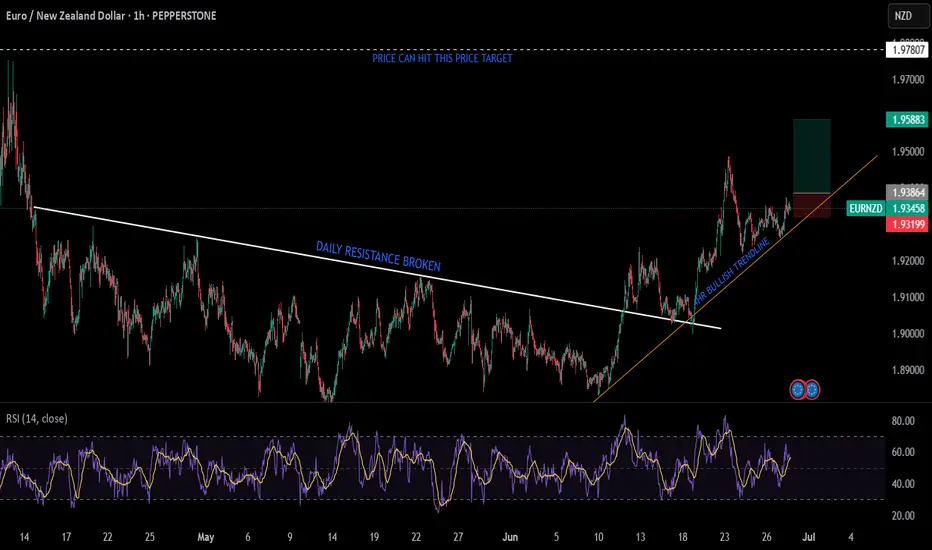
bullish rally for EURNZDas price broke the resistance (daily tf) and then made a decent pullback to retest that level and moved upwards, and now respecting the bullish trendline (4hr tf) also there is no divergence on multiple tfs with no major sign of reversal. All these confluences make this trend a bullish pair. To earn more RR 1hr or 30 min tf would be suitable, as I have also shown the buy stop order on the chart
PSYCHOLOGY OF A CRYPTO CYCLEWe expected a pullback, and now thats behind us!😅
The market is back on track, and we are firmly in the #Belief phase of the bull cycle.
With heavy short liquidity stacked around $110K, a push into that zone could trigger a short squeeze, launching us into the #Thrill phase.
And if momentum holds, all signs point to #Euphoria by late 2025.
Favorites so far this cycle:
🥑 POLONIEX:GUACUSDT 🔗 POLONIEX:LLUSDT 🎮 KUCOIN:MYRIAUSDT
🌐 HTX:SYNTUSDT 🧪 MEXC:DEAIUSDT 🏠 OKX:PRCLUSDT
🧱 MEXC:YBRUSDT ⛏️ MEXC:KLSUSDT 🧩 $RUJIUSDT
Comment below your favorite coins!

A new golden week, grasp it with the best condition
Good weekend everyone, this week's trading time is over, and next week's trading time will also enter the countdown. No matter how you grasp the market this week, whether happy or sad, Theo hopes that everyone will not bring your mood to the trading environment next week.
After all, next week is also a new beginning of the week. In the new week, everyone should be prepared for a new state. A good state should be persevered, and a bad state should be adjusted. With a good state to grasp the market trend of next week, I believe you can also be invincible and grasp the market better!
📊Technical aspects
Gold did not break through the upper pressure at midnight on Friday. Gold fell directly after opening in the morning on Friday. The bears broke through the previous 3295 support line, and the lowest level in the evening was 3255, closing at around 3274.
The daily line also closed in the form of a big negative line, with an obvious downward trend, and all the previous support will also turn into pressure. The short-term moving average system crossed downward to accumulate energy for the bears. Since the closing did not break through the upper 3300 pressure level, we will continue to rebound and short next week. After all, the technical side is still short, and only by following the trend can we keep up with the rhythm of eating meat.
From the 4-hour analysis, the upper short-term resistance is around 3295-3301, with special attention paid to the suppression at 3316. In terms of operation, the rebound continues to be the main short and the trend looks down. The lower short-term support is around 3250-3255. The overall main tone of high-altitude participation remains unchanged relying on this range.
💰Strategy Package
Short Position:3290-3300,SL:3315,Target: 3240-3250

Gold fluctuates and rebounds, don't chase shorts at low levels
💡Message Strategy
Yesterday, Thursday, we believed that the easing of tensions in the Middle East, the cooling of market risk aversion, and the hawkish stance of the Federal Reserve, which believed that the possibility of rate cuts should not be overly expected, suppressed expectations of rapid rate cuts, dragged down the dollar, and jointly suppressed the trend of gold.
However, trade uncertainty, geopolitical situation and expectations of rate cuts still support gold prices, which temporarily supports gold's rebound from a three-week low. Therefore, in terms of operations, it is recommended that everyone pay attention to the upper pressure of $3,345, followed by $3,357, and the lower support of $3,325, followed by $3,310.
From the subsequent trend, during the Asian session, gold fell back to $3,330 and stabilized. After the opening of the European session, the gold price rebounded and rose to $3,350 and encountered resistance. After that, gold fluctuated and fell. The decline continued after the opening of the US session, falling to $3,310 and stabilizing. After the rebound of $3,336 and encountering resistance, gold fell again, and continued to fall after the opening of Friday, refreshing the June low to $3,291, and performing weakly in the short term.
Overall, gold rebounded to $3,350 on Thursday and encountered resistance, then fell back to $3,310 and stabilized. It basically operated between the support and pressure levels we gave. On Friday, the gold price tried to break downward, and the short-term downside risk increased.
📊Technical aspects
On the daily chart, gold fell from a two-month high and rebounded from a low in June this week, but as gold prices fell back on Thursday, the short-term trend of gold prices turned downward again. For gold's upper pressure, pay attention to the integer position of $3,300, followed by Thursday's low of $3,310, and the 1-hour Bollinger band middle track of $3,325;
For gold's lower support, pay attention to the current intraday low of $3,291, which is also the lower track of the daily Bollinger band. A downward break may increase the risk of short-term decline. Pay attention to the two lows of $3,270 and $3,250 when gold prices rebounded at the end of May.
The 5-day moving average and MACD indicator cross, and the KDJ and RSI indicators cross. The short-term technical aspect shows that gold prices are at risk of continuing to fall.
💰Strategy Package
Short Position:3275-3295,SL:3315,Target: 3240-3250

USDJPY Potential UpsidesHey Traders, in tomorrow's trading we are monitoring USDJPY for a buying opportunity around 144.400 zone, USDJPY is trading in an uptrend and currently is in a correction phase in which it is approaching the trend at 144.400 support and resistance area.
Trade safe, Joe.

BITCOIN → Pause for consolidation before growth. 115K?BINANCE:BTCUSDT focus on the structure on D1. The market is forming local resistance and consolidation after growth. The fundamental background is positive. BTC is following the SP500
The market is recovering in line with the stock market (SP500, NQ) after the de-escalation of the situation in the Middle East. The fall in the DXY is also providing support.
Technically, the focus is on the consolidation phase after the distribution triggered by a false breakout of 100K. The price stopped before the resistance at 108100 and rolled back to 106500, confirming the boundaries of the local trading range, the essence of which is a pause for a breather before a possible continuation of growth. The structure on D1 is compression towards resistance. The trigger is 108100, and a breakout of this level could trigger distribution towards 110500 and ATH.
Despite the fact that the market is under a cascade of resistance (resistance: 108100, 110400, 11900 (ATH)), an important nuance is that after strong growth, the price moved into accumulation in the 100K-110K range on D1-W1, and there are no reasons for a decline yet.
Resistance levels: 108100, 108900, 110400
Support levels: 106500, 104650
If the market structure within 106500 - 108100 remains unchanged and BTC continues to storm the consolidation resistance in the “compression to level” format and stick to the level, the chances of a breakout will increase. I do not rule out the possibility of a pullback to 106500, 105650 before a possible rise to ATH.
Best regards, R. Linda!

Is the Uptrend Over? Critical Break on the Silver 1-Hour ChartHey everyone,
After the upward trend structure on XAGUSD broke down, the support level was breached, followed by a pullback. Because of this, my target level is 35.286.💬
Also, keep a close eye on key economic data releases on the fundamental side, as they could significantly influence your strategy.
I meticulously prepare these analyses for you, and I sincerely appreciate your support through likes. Every like from you is my biggest motivation to continue sharing my analyses.
I’m truly grateful for each of you—love to all my followers💙💙💙

RSI Flashes Warning on EURUSD: Critical Level Under Watch!Good morning traders,
If the EURUSD pair breaks below the 1.16729 level due to an RSI divergence, the next potential target could be around 1.16093.
Keep in mind that a break below 1.16729 may also signal a potential trend reversal.
I've marked the pivot points for you on the chart for better clarity.
Additionally, it's crucial to keep an eye on current economic data and news releases as part of your fundamental analysis.
I meticulously prepare these analyses for you, and I sincerely appreciate your support through likes. Every like from you is my biggest motivation to continue sharing my analyses.
I’m truly grateful for each of you—love to all my followers💙💙💙

Like this set up on GM using the 3 touch point TL StrategyLike this set up on GM using the 3 touch point trendline strategy

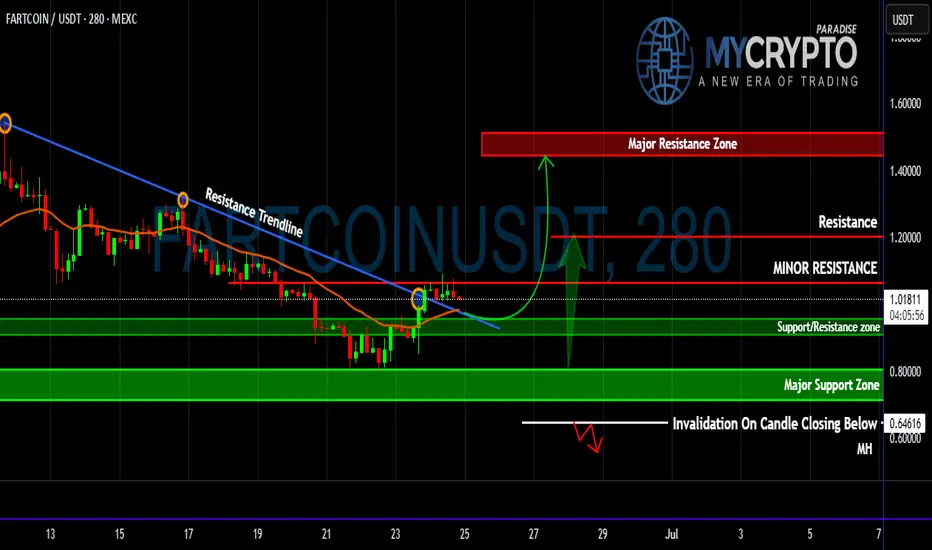
FARTCOIN Flipped Key EMA—Is This the Start of a Pump or Trap?Yello Paradisers ! Are we looking at a breakout that could deliver massive upside, or is this just another emotional trap before the next leg down? The market has been ruthless lately, and unless you base your decisions on structure, probability, and proper confirmation, you’re gambling—not trading. Let’s break down this #FARTCOIN setup from a professional standpoint.
💎#FARTCOIN has finally broken above a clearly defined descending resistance trendline, signaling a potential probable shift in short-term momentum. This breakout occurred precisely as the price reclaimed the multi-timeframe EMA —a key dynamic level that has consistently acted as resistance throughout the downtrend. The reclaim and hold above this EMA significantly increase the probability of a short- to mid-term trend reversal, especially as it aligns with an early attempt to build a bullish market structure.
💎Price is now trading just below a minor resistance level. This zone has capped previous upward attempts and is the first level bulls must overcome for continuation. A confirmed 4H/1H or daily candle close above this resistance will open the door to a measured move toward the next key level at $1.20265, with extended upside potential into the major resistance zone between $1.44660 and $1.55099. Should bullish momentum pick up with increasing volume, a Probable upside move becomes a realistic scenario.
💎However, none of this is guaranteed. We're dealing with probabilities, not certainties. The support/resistance flip zone between $0.95949 and $0.90596 now becomes a crucial reference point. A healthy retest of this area could provide a higher-probability long entry, especially if price continues to respect the reclaimed EMA. Below that, the major support zone from $0.80693 to $0.71058 represents a broader demand block. If the price pulls back this far, it may signal the formation of a larger accumulation range rather than immediate continuation.
💎To manage risk effectively, traders must monitor the invalidation level at $0.64616. A 4H candle close below this level would nullify the bullish breakout scenario and increase the probability of renewed bearish control, suggesting the recent breakout was a deviation or fakeout.
Stay sharp, Paradisers! Will this be a breakout or a fake-out? Only time—and disciplined trading—will tell!
MyCryptoParadise
iFeel the success🌴