BAKE Bulls Targeting 0.105, +1692% Volume SurgeThe chart shows BAKEUSDT trading around 0.0898 USDT on Binance. Overall, the structure indicates that after a strong upward impulse from approximately 0.0835 USDT to 0.117 USDT, the price entered a correction and is now consolidating. This consolidation sits just above an important support level, signaling a possible preparation for the next leg up.
There is a clearly defined support area between 0.0835 and 0.0836 USDT, which has been tested multiple times. The most recent lows were bought up strongly, forming what looks like a potential double bottom or higher low, both common reversal patterns. Beneath this zone, the next deeper support rests near 0.0752 USDT, which would be considered only if the main support fails.
Overhead, the chart identifies resistance levels at 0.1050–0.1071 USDT, where price previously stalled and retraced. This zone aligns with the first target area for any bullish continuation. Further up, 0.1169 USDT marks the prior swing high and the most significant resistance to break for confirmation of a larger trend reversal.
Visually, the chart illustrates how the strong impulse rally was followed by a structured pullback, resembling an ABC correction pattern. The correction appears mature, as price action is tightening within a smaller range. This often suggests that momentum is getting ready to shift back upward if buying pressure sustains.
Several buy signals ("B") are marked on the chart near support zones, while sell signals ("S") have appeared near previous short-term peaks. The clustering of buy signals around the current levels reinforces the idea that traders have been accumulating positions in this area.
Below is the trading setup outlined on your chart:
• Entry Zone: Around 0.0898 USDT
• Stop Loss: Slightly under 0.0836 USDT to protect against a deeper retracement
• Take Profit Target: Between 0.1050 and 0.1071 USDT (initial target)
• Risk/Reward Ratio: Approximately 2.77, which is favorable for long positions
• Potential Gain: +17.69% from entry to target
• Potential Loss: -6.38% if the stop is hit
The highlighted risk/reward box shows the trade aims to capture a substantial move while limiting downside exposure.
The overall price behavior indicates that sellers failed to create new lows, and instead, the market printed a higher low above the key support zone. This is often one of the first signs that demand is absorbing supply and can set the stage for an upside breakout.
While volume data isn’t visible in the chart you shared, typically in this kind of setup, volume contracts during the correction phase and begins expanding again when price approaches a breakout point. Watching for rising volume on any move above 0.0900 USDT could confirm bullish intent.
If price breaks and closes above 0.0900 USDT on the hourly timeframe, this would be the first signal that momentum is flipping decisively in favor of the bulls. Ideally, you want to see a retest of this level hold as support, which would further validate the move. From there, a push into the 0.1050–0.1071 USDT resistance area becomes more probable. If this level is cleared on strong momentum, the extended target near 0.1169 USDT could be achievable.
In terms of sentiment, the fact that multiple buy signals have appeared near the support zone while sellers are absent near the lows reinforces a bullish bias. The risk is primarily centered around whether the 0.0835 USDT level holds. If price closes decisively below it, that would invalidate the current bullish thesis and potentially expose the market to a deeper drop toward the 0.0752 USDT support area.
Overall, the chart presents a constructive technical picture favoring further upside, provided that support holds and buyers can reclaim the short-term resistance above 0.0900 USDT. The consolidation phase appears to be maturing, and the combination of higher lows and consistent rejection of support zones increases the likelihood of a breakout.
Summary of the Bullish Scenario:
• The trend structure shows a strong impulse and controlled pullback.
• The price has respected a key support area repeatedly.
• Buy signals are clustered near the lows, suggesting accumulation.
• A breakout above 0.0900 USDT could trigger a rally toward 0.1050 USDT and potentially higher.
• The risk/reward profile is attractive, offering nearly 3 times the reward relative to the risk.
Trend Lines

ICP to mark up for a higher highBYBIT:ICPUSDT.P looks like accumulating around $5 and can hit $8 in the coming days. There needs to be an increasing momentum soon.

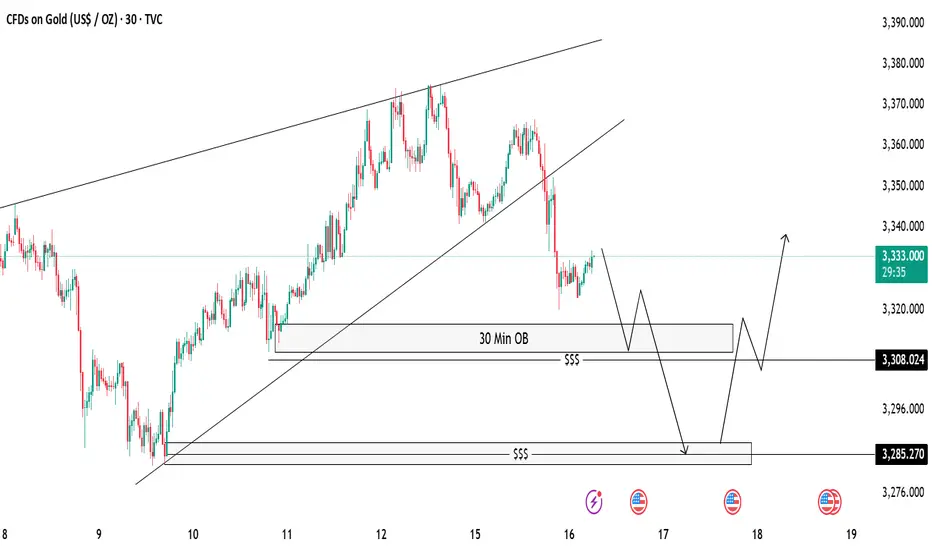
Gold 30-Min OB Analysis – Bounce or Drop..?Gold is showing a break of structure after a big sell-off 🔻. We have marked a 30-Minute Order Block (OB) 📍 which can act as a possible reaction zone.
📌 Two Scenarios We Are Watching:
✅ Scenario 1 (Bullish):
If price taps into the 30M OB and shows bullish rejection 🟢, we can look for buy opportunities, targeting the previous highs near 3335-3340 🎯.
❌ Scenario 2 (Bearish):
If price fails to hold the OB, we will watch for a liquidity sweep (marked with $$$) and expect price to move lower towards the next demand zone near 3285 📉.
⚠️ Key Notes:
Always wait for confirmation before entry.
Patience is the key 🧘♂️ — let the market come to us.
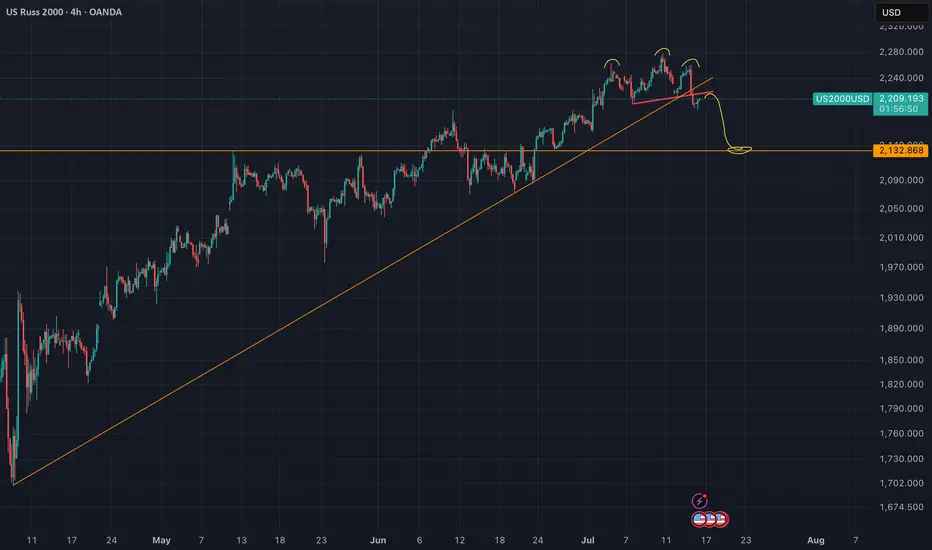
US2000 - Head And Shoulders (Top signal)Reversal in play. The neckline of the H&S got validated yesterday.
Nothing here should be interpreted as financial advise. Always do your own research and decisions.
Bitcoin to 128kThere is a strong support between 113k to 115k for Bitcoin, as you see that is the 61% of the Fibonacci, and it is just the start for the rally.

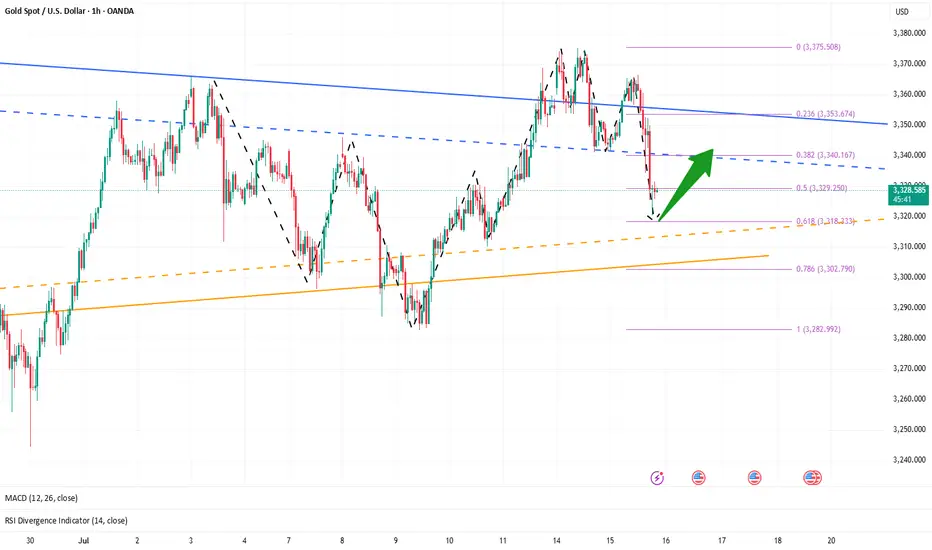
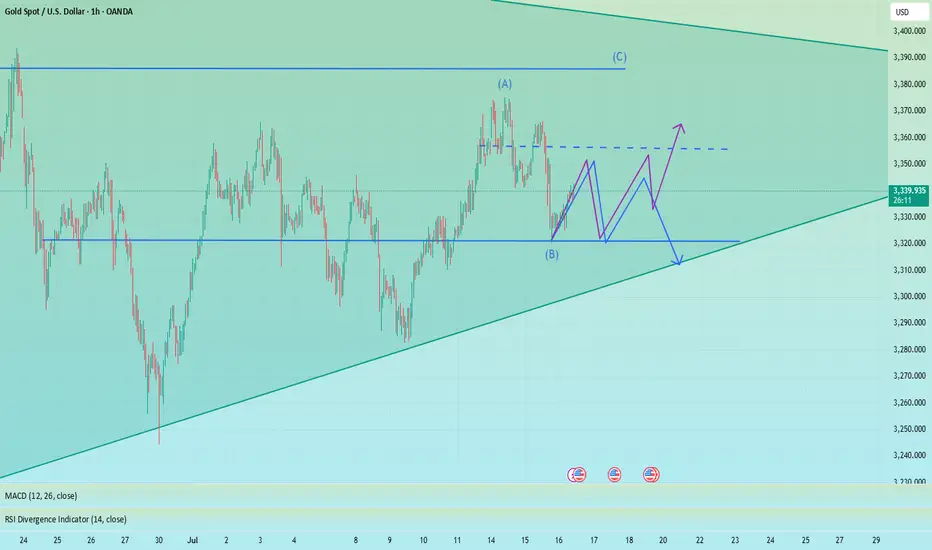
Golden Support Holds — Bulls Poised for Another Leg Higher"If gold cannot break through the 3365-3375 area, gold will fall under pressure again, or refresh the recent low of 3341, and continue to the 3335-3325 area." Gold's performance today is completely in line with my expectations. Gold just retreated to a low of around 3320, but soon recovered above 3325, proving that there is strong buying support below.
From the current gold structure, the short-term support below is mainly concentrated in the 3320-3310 area. If gold slows down its downward momentum and its volatility converges when it approaches this area, then after the gold bearish sentiment is vented, a large amount of off-site wait-and-see funds will flow into the gold market to form strong buying support, thereby helping gold regain its bullish trend again, thereby starting a retaliatory rebound, or a technical repair rebound.
Therefore, for short-term trading, I still insist on trying to go long on gold in the 3330-3320 area, first expecting gold to recover some of its lost ground and return to the 3340-3350 area.
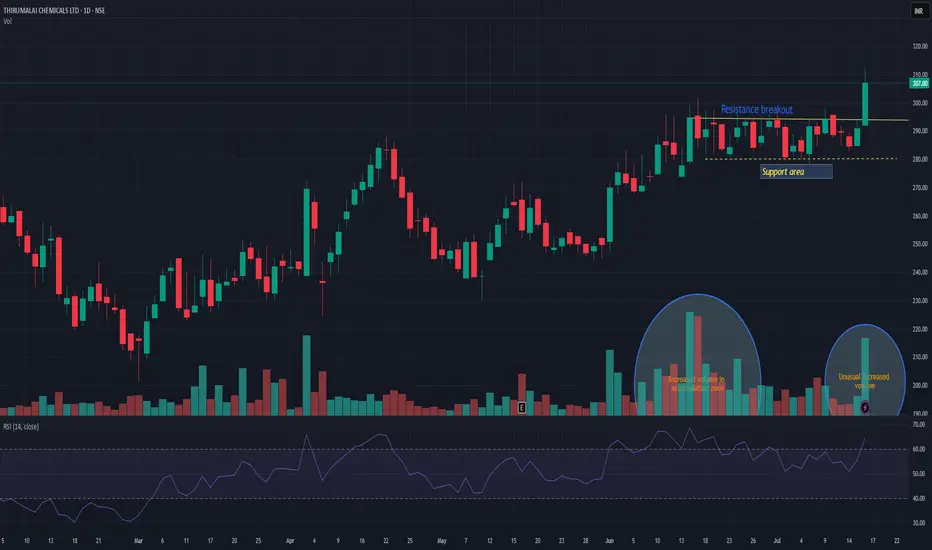
TIRUMALCHMTIRUMALCHM has given resistance breakout with decent volume. Another good thing is unusual volume increased in accumulation zone. Support can be seen near 280 levels. There is high probability that this time it may push the stock in to trend change and may take momentum to the next level. Keep it on radar.
The rebound is not a reversal, continue to shortGold showed a trend of rising and falling back and closing low on Tuesday. The highest intraday rise was 3366, and the lowest fell to 3320. The daily line recorded a medium-sized Yin line with a long upper shadow. The K-line was negative, and the closing line broke the resonance support of the middle track and the short-term moving average, suggesting that the bullish momentum has slowed down and the bears are ready to move. Today, we need to pay attention to the further downward performance of gold. From the 4H level, the price stood firm at the four-hour resistance position last Thursday, and then rebounded upward in the short term. Yesterday, the price fell below the daily support level. Currently, the short-term market is bearish, and attention is paid to the resistance in the 3340-3345 range above. In the one-hour period, the price is in short-term shock adjustment. On the whole, it will be treated as a shock decline before breaking yesterday's low, and the lower side pays attention to the 3225-3320 area support. In the short term, you can consider shorting at 3340-3350 in the European session, and look towards 3330-3320
OANDA:XAUUSD
Beware of false decline and real rise of gold
💡Message Strategy
On Tuesday, the dollar index continued to rise, eventually closing at a high of 98.68, after a mild inflation report sparked speculation that the Federal Reserve might keep interest rates unchanged for the time being.
Spot gold gave up its intraday gains after the release of CPI data, once touching the $3,320 mark, falling for the second consecutive trading day.
📊Technical aspects
In the hourly chart, gold has already touched the support trend line overnight.
Therefore, at present, it may be inclined to rebound, and gold still maintains an upward trend as a whole.
However, the upper 3340-45 is a short-term suppression position. If it cannot stand firm and break through 3340-45 today, it is not ruled out that it will continue to maintain 3320-40 for consolidation.
On the contrary, as long as it can stand firm above 3345 today, then gold will really rise in the future.
It is very likely that the high point of 3375 at the beginning of this week may be refreshed.
Therefore, in terms of operation, I suggest paying more attention to 3320-30. After all, 3320 is the overnight low. As long as it is not broken again, the probability of gold rising is very high.
However, if it falls below 3320 again today, it is not ruled out that it will continue to refresh the low.
💰Strategy Package
Long Position:3320-3330,SL:3305,Target: 3365
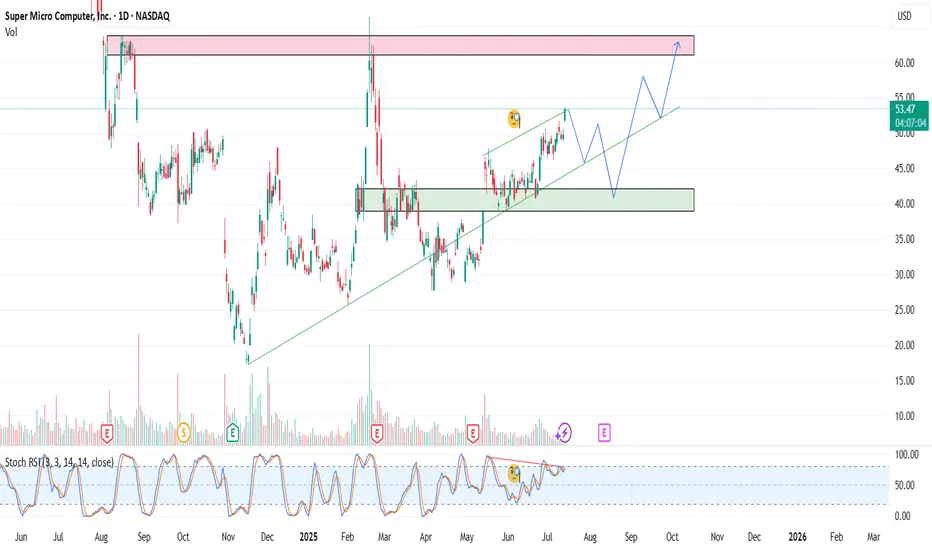
SMCI – Reloading the AI BeastSMCI continues to show strength as a key player in the AI infrastructure space. In this update, I present a new strategy with staggered entry zones at $49, $45, and $38 — designed to capture value during healthy pullbacks within a larger bullish trend.
Entry Plan:
1) $49
2) $45
3) $38
Target:
1) $56
2) $61
3) $66
📉 If price dips back to $45 or $38, I will reload heavier. No FOMO. Let the market come to us.
Drop a 👍 if you're still riding SMCI or waiting for the next entry.
This analysis is for educational and informational purposes only. It does not constitute financial advice or a recommendation to buy or sell any securities. Always do your own research and consider your risk tolerance before making investment decisions.
popcat long post trade📓 Trade Follow-Up — July 16 (Entry from Previous Session)
Timeframe:
Trading window is 10:00 p.m. to 12:00 a.m. (Vietnam time).
This session, I was on the charts for less than one hour.
⚙️ Trade Setup:
Trade idea was built during the New York open.
I didn’t execute the trade in real time because I hesitated.
Price moved without me, but I left a limit order at my pre-marked zone and went to sleep.
No chasing, no new setups added after market moved.
📈 Morning Outcome:
Woke up before 5:30 a.m.
The market had returned to the entry, nearly hit the stop loss, then turned.
I was in approximately +1% unrealized profit.
🧠 Morning Decision:
I had no pre-planned rule for what to do if I woke up and the trade was active.
Market was in Sydney session with about 90 minutes left in the trading day.
Tokyo session was approaching (~1 hour and 20 mins away).
I made a quick decision to close the trade:
Reason: setup originated during New York, no longer active session context.
I didn't want to micromanage outside my committed trading window.
During the short moment it took to decide, price pulled back slightly—final profit was just under 1%.
🧩 Notes:
I need to define pre-market and post-market rules:
What to do if a trade is active when I wake up?
Under what conditions do I manage or exit a trade outside my session?
Reaction was clean, no over-involvement or chasing.
Emotionally stable, but acknowledged mild excitement and urgency when waking up to a live position.

AUDUSD InsightHello to all our subscribers!
Please feel free to share your personal thoughts in the comments. Don't forget to like and subscribe!
Key Points
- The U.S. June CPI came in at 2.7%, matching market expectations, while core CPI was 2.9%, slightly below the expected 3.0%. Overall, the figures were in line with forecasts, but the prices of essential goods rose. Companies appear to be gradually passing on the rising import costs to consumers, indicating that the effects of tariffs are starting to filter through.
- U.S. President Trump announced a trade agreement with Indonesia, under which Indonesia will pay a 19% tariff on all exports to the U.S., while U.S. exports to Indonesia will be exempt from tariffs.
- President Trump also granted a 50-day grace period on sanctions against Russia.
Major Economic Events This Week
+ July 15: U.S. June Consumer Price Index (CPI)
+ July 16: U.K. June CPI, U.S. June Producer Price Index (PPI)
+ July 17: Eurozone June CPI
AUDUSD Chart Analysis
The pair continues a modest upward trend along the channel. As previously mentioned, a move toward the 0.69000 level is expected. However, there may be a brief pause around the 0.67000 resistance zone. This pullback is likely to be minor, and in the longer term, the 0.69000 level remains a potential target.

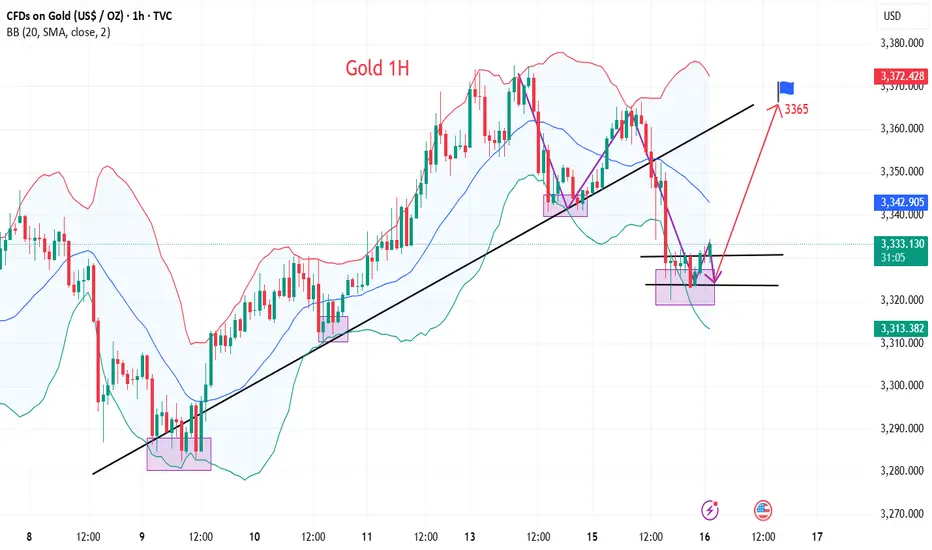
CPI triggers sell-off, 3330 can be short-term long📰 News information:
1. Focus on tomorrow's CPI data
2. Bowman's speech at the Federal Reserve
3. Tariff information outflows and countries' responses to tariff issues
📈 Technical Analysis:
The short-term trend flag pattern has been formed, and our short-selling strategy perfectly hits the TP. According to current news, Trump has once again urged the Federal Reserve to cut interest rates. While there is almost no possibility of a rate cut this month, there is a high probability that a 25 basis point rate cut will be completed in September, which is also in line with our previous prediction of market trends.
The big negative line in 4H pierced the middle Bollinger band. Although the CPI data is bullish, it has little impact based on the announced value. Market expectations have been digested in advance, so there is no room for a big drop. The upper points still focus on the short-term resistance of 3355-3365. If it rebounds to this area first in the short term, you can consider shorting again. Focus on the strong support of 3330 below. As long as the retracement entity does not fall below 3330, gold will rise again and touch the resistance line of 3375-3385.
🎯 Trading Points:
BUY 3335-3325
TP 3355-3365
In addition to investment, life also includes poetry, distant places, and Allen. Facing the market is actually facing yourself, correcting your shortcomings, facing your mistakes, and exercising strict self-discipline. I share free trading strategies and analysis ideas every day for reference by brothers. I hope my analysis can help you.
OANDA:XAUUSD PEPPERSTONE:XAUUSD FOREXCOM:XAUUSD FX:XAUUSD TVC:GOLD FXOPEN:XAUUSD
Axsome Therapeutics (AXSM) Breaks Out — Targeting Analyst Price Axsome Therapeutics (AXSM) has just broken out of a multi-month descending trendline, signaling renewed bullish momentum. I will buy at the open, targeting the analyst price target of $176.68 for a potential strong upside move. My stop will be set just below the prior resistance line (~$110), which should now act as support. This setup offers a favorable risk/reward, with the trendline breakout confirming renewed interest and upside potential.

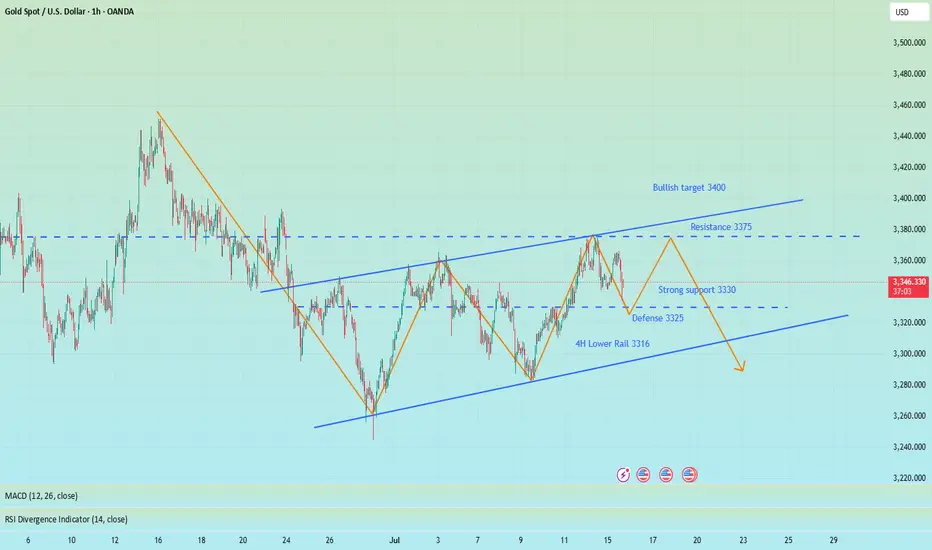
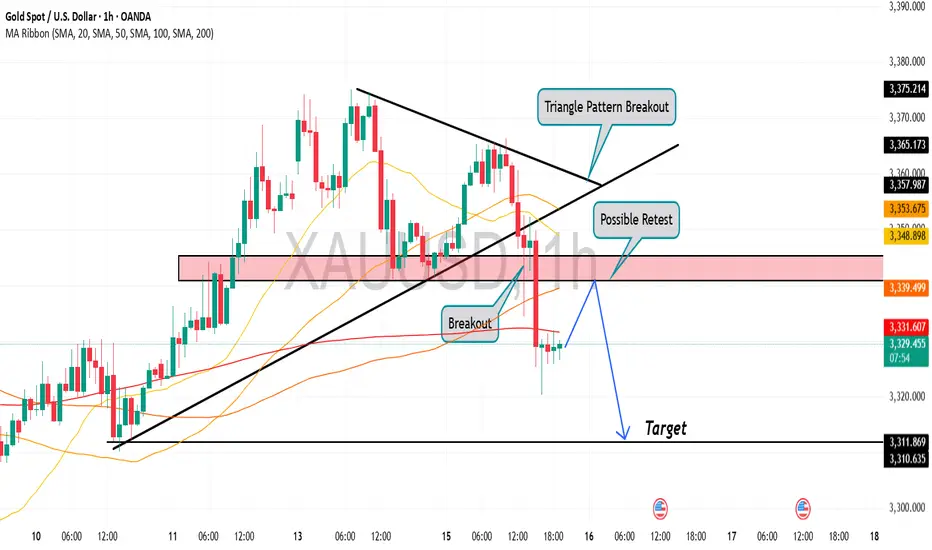
Gold is in the Bearish Direction after Breaking Triangle PatternHello Traders
In This Chart GOLD HOURLY Forex Forecast By FOREX PLANET
today Gold analysis 👆
🟢This Chart includes_ (GOLD market update)
🟢What is The Next Opportunity on GOLD Market
🟢how to Enter to the Valid Entry With Assurance Profit
This CHART is For Trader's that Want to Improve Their Technical Analysis Skills and Their Trading By Understanding How To Analyze The Market Using Multiple Timeframes and Understanding The Bigger Picture on the Charts
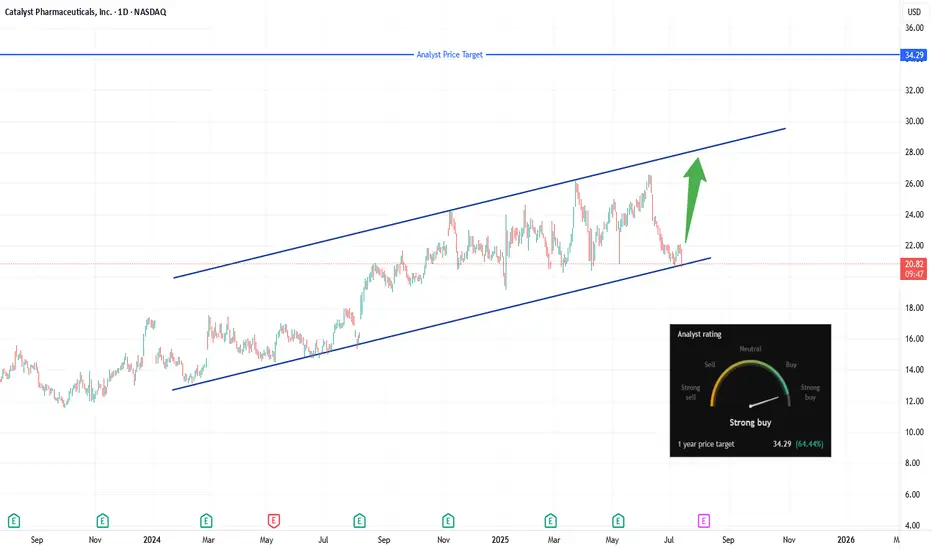
CPRX breakout watch: Eyes on $22.10, channel support intactCatalyst Pharmaceuticals (NASDAQ: CPRX) remains poised at the lower trendline of a well-defined ascending channel, trading in the $20.60–$21.00 area. The setup to monitor now is a daily close above $22.10, which would signal a real breakout through the $21.82–$22.11 resistance zone. A decisive push above that level opens the door for a test of the channel’s upper boundary near $27–$28.
💡 Trade Plan:
Trigger: Go long on a confirmed daily close above $22.10
Targets:
First: Mid-channel resistance around $24.50
Stretch: Upper-channel target of $27–$28
Stop‑Loss: Place below the channel base, ideally under $20.50 to manage risk
Why It Works:
Clear structure: Ascending channel with multiple supports provides clarity on entries and exits .
Momentum catalyst: Breaching the $21.8–$22.1 zone suggests fresh upside momentum.
Reward setup: A small stop near channel support offers a favorable risk/reward targeting channel top.
TL;DR:
Watching for a breakout above $22.10—that’s your entry trigger. Aim for $24.50, then $27–$28, with a stop under $20.50 if support fails.
USDJPY Wave Analysis – 15 July 2025
- USDJPY broke the resistance area
- Likely to rise to resistance level 151.30
USDJPY currency pair recently broke the resistance area located at the intersection of the resistance level 148.00 and the two resistance trendlines from January and March.
The breakout of this resistance area should strengthen the bullish pressure on his currency pair.
Given the continuation of the widespread yen sales seen recently across FX markets, USDJPY currency pair index can be expected to rise to the next resistance level 151.30 (monthly high from March).

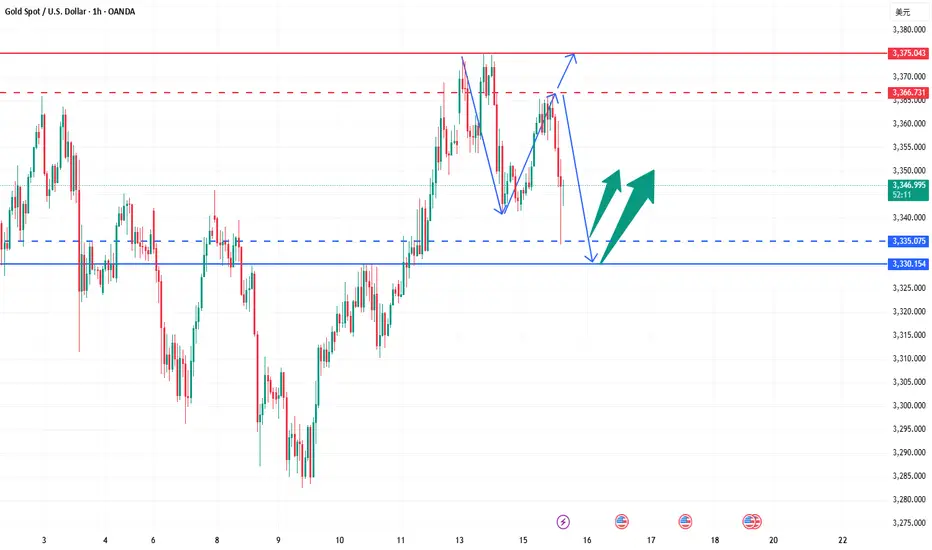
7/15: Watch for Long Opportunities Around 3343 / 3332–3326Good morning, everyone!
Yesterday, gold rose into the resistance zone before pulling back, testing support around 3343. After today’s open, the price continues to consolidate near this support level.
On the 30-minute chart, there is a visible need for a technical rebound, while the 2-hour chart suggests that the broader downward movement may not be fully completed. The MA60 support area remains a key level to watch.
If support holds firm, the price may form a double bottom or a multi-bottom structure, potentially leading to a stronger rebound.
As such, the primary trading strategy for today is to look for long opportunities on pullbacks, with key levels as follows:
🔽 Support: 3343, and 3332–3326 zone
🔼 Resistance: 3352–3358, followed by the 3372–3378 upper resistance band

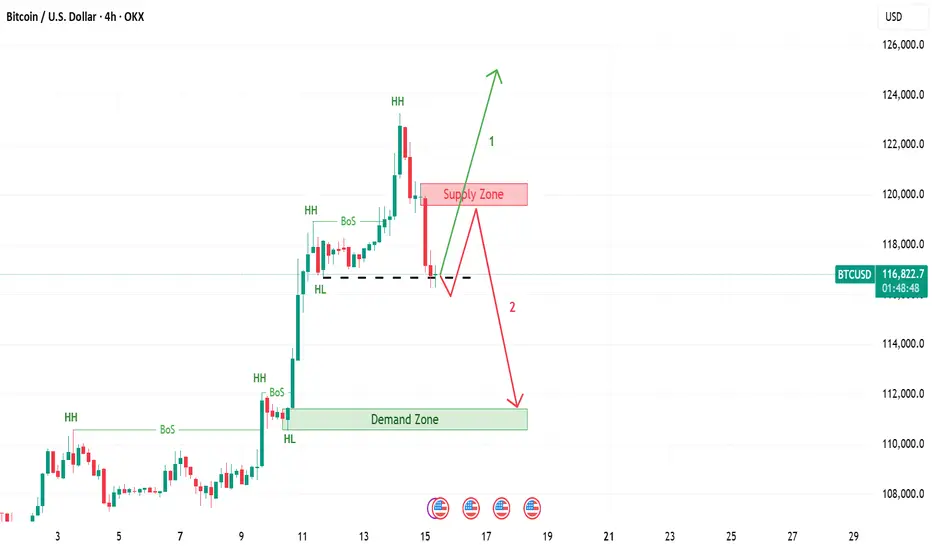
Bitcoin | 2 Scenarios If the 4 hour candle closes below last HL, then expect price return to supply zone and then go down till demand zone. If not, expect continuation of the upward trend, when 4 hour candle breaks last HH.
Which scenario you expect?
EURAUD, Trend continuationPrice has made a correction and pulled back into the trendline, a continuation of the uptrend is the next.

Gold bearishness once again in line with expectationsThe data released so far show that the US inflation data is stable and tends to decline, which increases the possibility of the Fed's monetary policy. The US dollar index fell first and then rose. Gold opened at around 3344 and rebounded all the way. The current highest rebound is around 3366. It fell back to 3352 before the data was released, and then quickly rebounded to 3360. After the data was released, it fell again quickly, and the current lowest touched around 3346. The short orders around 3360-3365 that we shared with brothers before were basically the highest short orders of the day, and we successfully completed our first goal. The brothers who participated in it all made good profits. Judging from the current trend of gold, we continue to participate in short orders during the rebound, and the long position is still around 3335-3330. After the release of the CPI data, it is bearish overall. The core is that it is lower than market expectations but higher than the previous value. Inflation has heated up again, which has once again suppressed the expectation of interest rate cuts. After this data, it also laid a good foundation for the decline in the market. If the price goes up again, it will still rely on the 3365 level to go short again. The data is obviously bearish, and it scared a lot of long positions before it was released.
Gold reference ideas:
Continue to short when it rebounds to around 3358-3365, with a target around 3350-3340;
Go long when it falls back to around 3335-3330, with a target around 3350.
Pay attention to the 3350 high point suppression!At present, we are paying attention to the short-term pressure near 3340-3350. If this position is not broken today, the daily line will continue to maintain a downward oscillation state, and continue to pay attention to the short-term competition near 3340-3350. Considering that the US dollar index is at a relatively high level in the short term, there is a certain demand for pressure repair, which may also bring a certain range of fluctuations to gold. Therefore, the gold operation maintains a range of fluctuations of 3300-3350. In the short term, we also need to pay attention to the emotional impact brought by fundamentals. From the current gold trend analysis structure, the short-term support below continues to focus on the vicinity of 3310-3300, the short-term suppression above focuses on the vicinity of 3340-3350, and the key pressure above focuses on the vicinity of 3380. The overall trend is running around the 3300-3350 range. The operation is mainly to participate in the volatile market with the idea of selling high and buying low, and remain flexible in response. It is recommended to wait and see more and do less in the middle position, chase orders cautiously, and wait patiently for key points to enter the market.
Gold operation strategy: Go long when gold falls back to around 3315-3305, with a target of 3335-3340.

Bottom-out rebound, 3338 short orders enteredYesterday, the gold market was affected by Trump's remarks about firing Federal Reserve Chairman Powell. After briefly falling below 3320, the price quickly rose by nearly 60 points, reaching a high of 3377. Trump later clarified that the news was false, triggering a gold sell-off, and the market rose and fell. As of Thursday's European session, gold prices fell back to around 3320. After a rapid rise and fall in the US market on Wednesday, the downward trend continued on Thursday, with the US market hitting a low of 3310 before rebounding. Judging from the 4-hour chart, the Bollinger Bands failed to open downward, indicating that the current market lacks continuity and the overall market remains in a volatile pattern. In a volatile market, it is recommended to pay attention to key support and resistance levels for high-selling and low-buying operations. The upper resistance range is currently at 3343-3351, and the important watershed support level below is at 3310.
OANDA:XAUUSD
