SOONUSDT → The coin that gets killed...BINANCE:SOONUSDT.P is under pressure. The coin looks extremely weak against the backdrop of a bullish market, with key support ahead, separating traders from the panic zone and a sharp decline
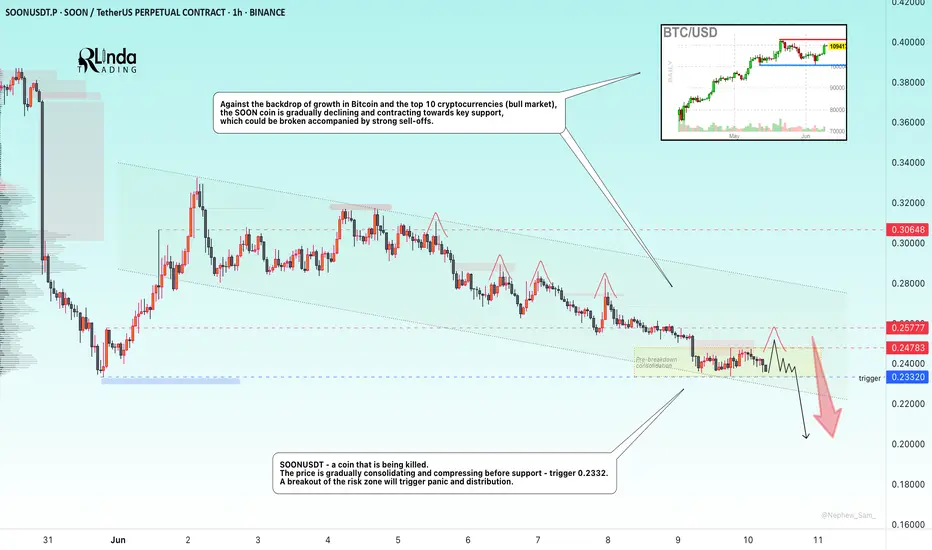
This coin is being killed. The price is gradually consolidating and compressing before support - the trigger is 0.2332. Against the backdrop of the overall decline that the market has experienced after a slight impulse from 0.2332, shocks are forming with the aim of capturing liquidity (red check marks). This generally indicates that large players are gathering a bearish position. A breakout of the risk zone will trigger panic and distribution.
Against the backdrop of growth in Bitcoin and the top 10 cryptocurrencies (bull market), the SOON coin is gradually declining and contracting towards key support, which could be broken accompanied by strong sell-offs.
Resistance levels: 0.2478, 0.25777
Support levels: 0.2332
If the coin continues to contract towards the 0.2332 support and form a pre-breakdown consolidation, there will be little chance of survival. In the short and medium term, I expect prices to fall.
Best regards, R. Linda!
Trend Lines
GBPAUD → Countertrend liquidity captureFX:GBPAUD is forming a countertrend correction within a global uptrend and testing the support level with W1-D1, forming a false breakdown...
Against the backdrop of the dollar's correction, GBP/XXX pairs are strengthening. On the weekly timeframe, GBPAUD is forming a retest of support at 1.067 (false breakdown) within an upward bullish trend.
Unable to continue falling, the price returns above 1.0673 and consolidates in the buying zone. A breakdown of the structure will confirm the bullish sentiment.
Support levels: 2.0673
Resistance levels: 2.0785, 2.0852
If the bulls manage to hold their ground above the 2.067 support level within the current structure, the currency pair will have a good chance of returning to the bullish trend.
Best regards, R. Linda!

EURAUD → Breakout and consolidation above key supportOANDA:EURAUD is trying to consolidate above the key support zone of 1.76 - 1.77. Within the uptrend, bulls have a fairly good chance.
The market continues to break of structure, confirming the bullish sentiment on the chart. A correction is forming from 1.7882. Before rising, the price may test support. The currency pair is supported by its own bullish trend and the falling dollar (especially against the backdrop of economic problems with the USD (DXY)).
Technically, the currency pair looks quite positive. After the formation of another ‘bos’, we are seeing a correction to the Fibonacci zone of 0.7 and support at 1.7696. If, during the retest, the bulls manage to hold their ground above the key support level, growth may continue in the medium term.
Support levels: 1.7696, 1.7629, 1.7463
Resistance levels: 1.7882, 1.7988
Locally, a reversal pattern is forming relative to the specified zone (as part of a correction). We need to wait for confirmation (price consolidation above the level). The potential within the bullish trend is quite large, and in the medium and long term, the price may test 1.85.
Best regards, R. Linda!

GOLD → Declining interest. Retest of supportFX:XAUUSD experienced significant volatility toward the end of the US trading session. This was due to developments in the Middle East. The de-escalation of the situation is leading to a decline in interest in the metal.
The announced ceasefire between Iran and Israel has reduced demand for gold as a safe-haven asset, while falling oil prices have reduced its appeal as a hedge against inflation. Gold is supported by expectations of a Fed rate cut in July. The focus is on Fed Chair Powell's testimony before Congress and further developments in the Middle East.
Technically, the price confirms the local bearish structure. A continued assault on the 3340 support level could trigger a further decline.
Support levels: 3343-3340, 3320
Resistance levels: 3360, 3366
Focus on the trading range (consolidation) 3340 - 3400. De-escalation of the conflict in the Middle East may lead to a decline in interest in gold as a hedge asset, which may cause the price to break down of consolidation. If the retest of 3340 continues, the price will begin to contract before the level, in which case the chances of a breakdown and decline will only increase. The target will be the liquidity zone of 3320 - 3306
Best regards, R. Linda!

AUDUSD InsightHello to all our subscribers.
Please share your personal opinions in the comments. Don’t forget to like and subscribe.
Key Points
- Fed Chair Jerome Powell, during his testimony before the House, responded to a question regarding Governor Christopher Waller’s suggestion of a possible July rate cut by stating, “There are a range of possible paths. It’s a possible scenario.” However, the overall tone of the testimony emphasized a wait-and-see stance.
- While there was some noise around the Israel-Iran conflict, it has been confirmed that a ceasefire was agreed upon. The Israeli side stated, “The focus will shift back to Gaza. We will bring the hostages home and dismantle the Hamas regime.”
- Due to the effects of de-dollarization, Australia’s bond market is gaining attention, and Australian government bond yields are on a downward trend.
Major Economic Events This Week
+ June 25: Testimony by Fed Chair Jerome Powell
+ June 26: U.S. Q1 GDP
+ June 27: U.S. May PCE Price Index
AUDUSD Chart Analysis
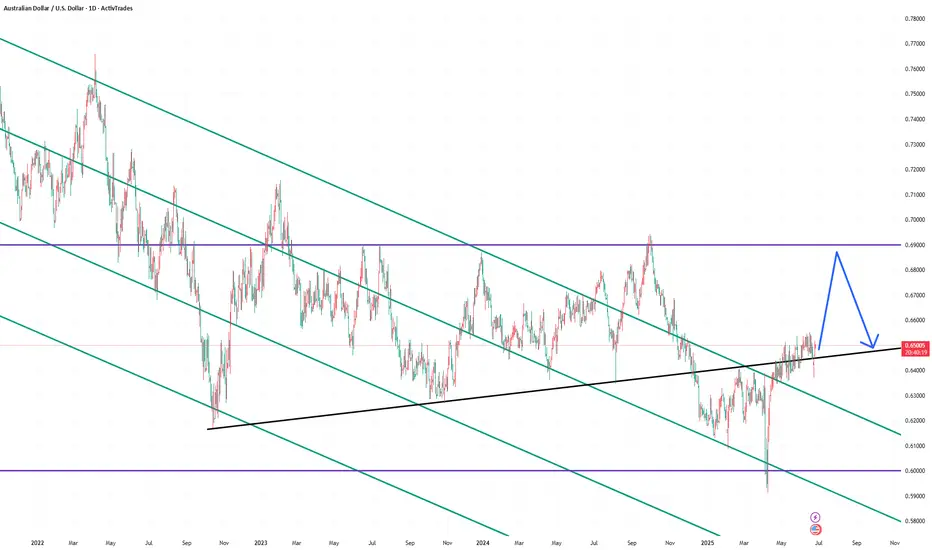
After a brief pullback, the AUD/USD pair fell to the 0.64000 level but rebounded from that support zone and is now showing an upward trend. A gradual climb is expected to continue, with the anticipated high near the 0.69000 level. However, there is minor resistance around the 0.67000 level, which could lead to a short-term decline, so caution is advised.
Give It The Gas
I've got a long Idea for the Henry Hub Natural Gas ETF, UNG.
After rising in late-2024/early-2025, UNG fell again (Mar-Jun), but recently (significantly) crossed above the trendline from that down move.
Time to look for a long position. But UNG is volatile - to reduce risk it's best to pick it up after a minor pullback. That seems to be happening now.
One thing I find useful when looking at an ETF backed by a commodity is to look at the chart for the underlying commodity future.
To be clear, I am NOT trading the future, only looking to it for (more) guidance.
In this case, for UNG, I chose the Aug Henry Hub Natural Gas contract (NGQ2025), which TradingView provides 10-minute delayed date for;
Here we see the trendline (light blue) is even stronger (i.e., more points of contact). In addition, the contract made a series of slightly higher lows (yellow line) before breaking through strong resistance at ~3.82 (a level which may now be providing support). Trendline breaks alone can be very flighty - they often don't work - so it helps to have other supporting factors (e.g., higher lows preceding, strong resistance breaks). And, not shown here but useful, UNG/NG is not overbought on the daily chart.
Now one could take a long position here, with a stop below the trendline, but I prefer my knives to at least slow down before I catch them.
Looking at the 4-hour chart for a reversal to enter;
A reversal and close above 3.92 would give a good entry point (using UNG), with a tighter stop at ~3.7 (or ~16.25 on UNG).
This is a "work in progress", so the actual trigger levels may change a bit. Or the whole setup could invalidate itself if the instrument(s) corrects back to at/below the trendline.
For targets, natural gas has resistance at 19.1 and again at 24.0 - best to trail a stop as UNG's price rises, bringing it up as each zone is hit.
For the long position, I anticipate an ITM option ~90 days out. I'm doing this in a taxable account, and for tax purposes UNG issues a K-1 to shareholders. I can do without the hassle. Option holders do not receive K-1's* (unless assigned), making tax reporting more routine.
Time to step on the gas?
*To the best of my knowledge - if any tax experts here know otherwise please drop a comment.
My ideas here on TradingView are for educational purposes only. It is NOT trading advice. I often lose money and you would be a fool to follow me blindly.

All That Glitters Is Not Gold (But Silver?)And another long Idea - this time in the Silver ETF, SLV.
Looking at the daily chart for SLV, a couple of things standout from a few days ago;
- The price just broke the all-time high at 31.80, along with significant resistance at ~31.50, and
- SLV gapped up, leaving tight stops a bit problematic.
As I've said before in this instance I do two things;
1. Wait for a pullback (which we're now seeing?), and
2. Switch to the commodity futures chart (emphasis - I'm not trading the future, just taking a look)
Using the July Silver contract on the CME;
We can see the breakout, and now the retest(s), of two critical highs from the last few months.
Switching down '1' interval, to the 4-hour chart;
We can see 3-4 retests of those old highs, which now may be acting as support. I've drawn in a short-term trendline and resistance. A cross of that trendline and a close above 36.260 should provide a good entry point.
A stop could then be placed at 35.00 (with a close below that on the 4-hour), just below this recent turmoil.
As for targets, this scenario has SLV making new all-time highs - best to just trail and let SLV tell you where to exit.
All that glitters..
My ideas here on TradingView are for educational purposes only. It is NOT trading advice. I often lose money and you would be a fool to follow me blindly.

USDCAD BUY OPPORTUNITY Price pulled back to a support level of 1.36712 a pretty nice level where we’re looking forward to seeing more bullish price action development. This pullback support shares a confluence with a trendline with a Doji candlestick pattern. We should be looking for a confirmation to go long.

BTC is expected to retreat in the short term, focus on 104500📰 Impact of news:
1. The ceasefire agreement reached earlier did not take effect, and Trump believed that both sides violated the agreement
2. Federal Reserve Chairman Powell delivered a speech 3 hours later
📈 Market analysis:
I haven't updated BTC for a while. Today I want to share my views on BTC with you. BTC is currently encountering resistance and pressure at the 106,000 level and is beginning to retreat. From the technical indicators, MACD is in a dead cross, and RSI is retreating after reaching the overbought area. There is no problem with the short-term bearish trend, and it is expected that it will be able to retreat to the 104,500 level without much problem. However, the recent decline in the gold market, DXY market, and crude oil market may cause funds to flow into the BTC market.
🏅 Trading strategies:
SELL 106000-105500
TP 105000-104500
BUY 140500-103500
TP 105000-106000
If you agree with this view, or have a better idea, please leave a message in the comment area. I look forward to hearing different voices.

Nasdaq: Bull flag breakout on daily chart, testing ATHsBeen a while since I last posted. So figured I'd share this quick chart. Market undoubtedly have been incredibly volatile this month. However luckily, the Nasdaq has been forming bull flag on the daily chart. This follows a strong prior uptrend. The breakout took place today, sending the index to test ATHs.
Notable stocks making a move are names like NASDAQ:AMZN and NASDAQ:NVDA , mainly due to the broader market strength. Other indices, such as the S&P 500 ( SP:SPX ) also are breaking out as they form a similar bull flag pattern.
At ATHs, this is a deciding factor of where the market goes next. Either it bounces off to near-term support, or the market rallies to a new all-time high until next cooldown.
Note: not financial advice

Stellantis | STLA | Long at $9.59Stellantis NYSE:STLA is the maker of the auto brands Fiat, Peugeot, Jeep, Citroën, Opel/Vauxhall, Ram Trucks, Dodge, Chrysler, Alfa Romeo, Maserati, DS Automobiles, Lancia, Abarth, and Vauxhall. The stock has fallen sharply due to a 70% profit drop in 2024, weak U.S. sales, high inventory, and tariff uncertainties. The turnaround for NYSE:STLA beyond 2025 hinges on new CEO Antonio Filosa’s focus on U.S. market recovery, new product launches (e.g., Ram 1500 Ramcharger, Jeep hybrids), pricing adjustments, aggressive marketing, $5B U.S. manufacturing investment, and mending dealer relations. The stock is trading at a P/E of 5.1x, debt-to-equity of 0.8x (not bad), a book value of $29 (undervalued), a tangible book value of $9.82, and earnings and revenue are forecasted to grow into 2028. Economic weakening and tariffs may hamper these predictions, but the new CEO and future interest rate drops may get this stock rolling again.
However, if NYSE:STLA shows zero sign of near-term recovery or other fundamental issues arise, I truly think this stock could enter the high $5-$6 range before a true reversal begins.
From a technical analysis perspective, the stock price is currently with my selected "crash" simple moving average. This area often signifies a near-term bottom, but like mentioned above, watchout out for the "major crash" simple moving average area currently between $5.83 and $7.09.
Regardless of bottom predictions, NYSE:STLA is in a personal buy zone at $9.59 with a greater position likely if it enters my "major crash" zone, as mentioned above.
Targets into 2027:
$12 (+25.1%)
$14 (+46.0%)

XAUUSD BUY SETUPHere the price action shows bullish shift at M15 so we wait to retest at our zone to enter buy .
Please follow to support me .
Thank you !

Diageo | DEO | Long at $101.15Diego NYSE:DEO is the owner of alcohol brands such as Johnnie Walker, Crown Royal, Smirnoff, Baileys, Guinness, Tanqueray, Don Julio, Cîroc, and Captain Morgan. The stock has fallen significantly since 2021 due to several factors, such as: post-COVID recovery slowdown; retail/travel disruptions hurting high-margin segments; inflationary pressures raising costs for materials like glass and agave, squeezing margins; consumer downtrading to cheaper alternatives; and macroeconomic headwinds. While tariffs may prolong overall recovery, I do not think it's the end for this company by any means.
Factors likely to drive NYSE:DEO stock higher include:
Interest Rate Cuts : Expected U.S. rate cuts in 2025 could boost consumer confidence and spending, benefiting premium brands. Lower rates may also reduce debt costs, easing pressure on its debt load.
Productivity Initiatives : NYSE:DEO $2B savings program (2025-2027) aims to improve efficiency, margins, and cash flow, potentially restoring investor confidence.
Undervaluation : Trading at 17.5x forward earnings (below historical 21x), the stock may attract value investors.
From a technical analysis perspective, NYSE:DEO has been riding my "crash" simple moving average zone. While the momentum has a strong downtrend, entry into this "crash" zone typically only happens a few times before a trend reversal. But there is a good probability, that my "major crash" zone (currently in the $80s) is possible before a true reversal. Regardless, without a crystal ball, I am starting to form a position and plan to add more if the "major crash" happens with this stock.
Thus, at $101.15, NYSE:DEO is in a personal buy zone with the noted potential for a drop into the $80s due to projected earnings revisions, etc.
Targets into 2027:
$120.00 (+18.6%)
$140.00 (+38.4%)

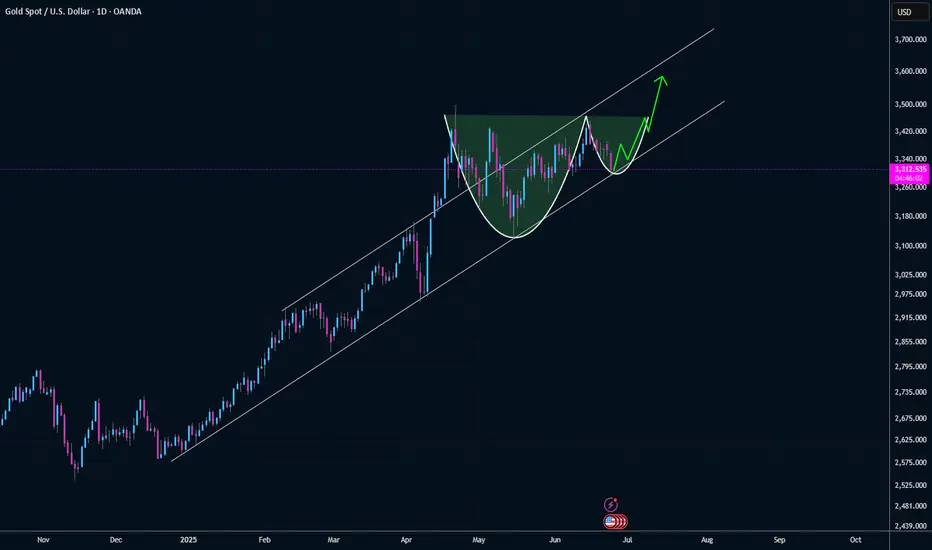
Gold Trend Still In TactPotential cup and handle formation as it the trend works into the bottom of the handle. Still think this comes back into play as the "big beautiful bill" comes back into focus and national debt is a topic of concern.
GBPJPY → Assault on the resistance 196.400FX:GBPJPY under the pressure of the bull market breaks through the resistance with the aim of possible continuation of growth and retest of the liquidity zone
Against the background of the dollar growth, the Japanese yen is losing value, which in general may provide support for the currency pair GBPJPY
The currency pair, after a false breakout of the key resistance and a small correction, technically, the bullish structure has not broken. The price returns to the resistance at 196.400 and breaks it. If the bulls hold their defenses above the level, we can expect a rise
Resistance levels: 196.400, 198.24
Support levels: 195.94, 195.45
Consolidation above 196.400, retest and break of 196.93 may trigger continuation of the growth. Zones of interest 198.24, 198.94
Regards R. Linda!

EURNZD: Time to Grow 🇪🇺🇳🇿
EURNZD is strongly bullish after a test of a key horizontal support.
A bullish violation of a resistance line of a falling channel provide
a strong bullish signal.
Goal - 1.936
❤️Please, support my work with like, thank you!❤️
I am part of Trade Nation's Influencer program and receive a monthly fee for using their TradingView charts in my analysis.

Analysis and layout of the latest gold trend in the evening📰 Impact of news:
1. The ceasefire agreement reached earlier did not take effect, and Trump believed that both sides violated the agreement
2. Federal Reserve Chairman Powell delivered a speech 3 hours later
📈 Market analysis:
After falling below the 3300 mark, gold hit the 3295 line and then rebounded. However, there are too many long orders at the current high level of gold, and the market will not rise easily. The current international situation is so tense, and gold is still slowly declining. It is difficult to rebound sharply in this situation. In the short term, focus on 3290-3280 below. If effective support is obtained, you can go long and look towards 3300-3310. If it falls below the support line of 3290-3280, the downward channel of gold will be opened and it is expected to reach 3265. At the same time, pay attention to the 3328-3338 resistance range on the upside. If the first rebound in the evening encounters pressure and resistance here, you may consider shorting.
🏅 Trading strategies:
SELL 3328-3338-3400
TP 3310-3300-3295
BUY 3290-3280
TP 3300-3310
If you agree with this view, or have a better idea, please leave a message in the comment area. I look forward to hearing different voices.
TVC:GOLD FXOPEN:XAUUSD FOREXCOM:XAUUSD FX:XAUUSD OANDA:XAUUSD

HelenP. I Bitcoin may break trend line and continue to move downHi folks today I'm prepared for you Bitcoin analytics. After testing the resistance area between 107500 and 108200 points, the price started to form a clear descending pattern, respecting the downward trend line with multiple touches. The price consistently failed to break above it, confirming bearish pressure. Eventually, it dropped below the 101500 support level and entered the support zone down to 100700 points, where it found temporary relief. From there, BTC attempted a short-term rebound and moved back toward the 101500 resistance area. However, it now trades just under the trend line again, signaling that the sellers are still in control. The structure suggests a potential pullback toward the trend line or the lower boundary of the resistance zone before further downside continuation. In my opinion, BTCUSD is preparing for another move lower. That’s why I expect a slight upward correction, followed by a new bearish impulse that could push the price toward the 97500 level, my current goal. Given the ongoing pressure from the trend line and the failed breakout attempts, I remain bearish and expect further decline. If you like my analytics you may support me with your like/comment ❤️
Disclaimer: As part of ThinkMarkets’ Influencer Program, I am sponsored to share and publish their charts in my analysis.

HelenP. I Gold may continue to decline to support levelHi folks today I'm prepared for you Gold analytics. After dropping from the support zone, the price of Gold found temporary support near the trend line and started to rise again. The upward movement was sharp and even created a gap while breaking through the previous support level, which then acted as resistance. For some time, the price hovered around this resistance area but failed to gain enough strength to break higher. Eventually, Gold pulled back to the trend line and began consolidating within a triangle pattern. Inside this structure, it managed to break above the resistance zone again, but this breakout turned out to be false. The price quickly reversed and dropped, breaking through the resistance level and exiting the triangle to the downside. This breakdown also shows that the bullish momentum has weakened significantly. Now, Gold is trading near the trend line again, showing hesitation and a lack of strong bullish continuation. Given this technical behavior, I expect a small rise toward the trend line, followed by a continued drop toward the support level at 3320. That’s the area I’m watching as my current goal. If you like my analytics you may support me with your like/comment ❤️
Disclaimer: As part of ThinkMarkets’ Influencer Program, I am sponsored to share and publish their charts in my analysis.

use/jpy (Short term move) 6/24/2025 10:39AM western time zone Stop loss: 144.40
Take profit: 145.30
(Short term move)

Gold remains weak and is expected to fall below 3,300
Gold fell today due to the news of a comprehensive ceasefire in the Iran-Israel conflict. In addition, as Fed officials claimed that there was no need to cut interest rates at present, expectations of interest rate cuts fell, the dollar strengthened, and gold was under pressure. In the short term, it may continue to fall and further test 3291 to 3285. Therefore, today we should continue to operate short, pay attention to 3336-38 to suppress shorts, defend 3346, and look at 3300/3285 support.
Gold short-term trading: short near 3336, stop loss 3346, take profit 3300

USNAS100 Technical Setup: Watching 21635 and 21835 LevelsUSNAS100 – Technical Outlook
The price has stabilized above the key pivot level at 21635, indicating potential short-term upside toward the resistance at 21835.
However, as long as the price trades below 21835, the broader bias remains bearish. A confirmed 1H close below 21635 would reintroduce downside pressure, targeting 21470 and potentially extending toward 21375 and 21250.
Pivot Level: 21635
Support: 21470, 21375, 21250
Resistance: 21835, 21930, 22090
previous idea:

How to Tell BITCOIN is BULLISH using MOVING AVERAGES OnlyBTC is trading sideways and it sparks a lot of debate whether or not we are at the beginning of a new bearish cycle, or if there is still a push upwards waiting to happen.
Here's how you can use the Moving Averages to determine whether or not BTC is bullish.
Don't miss this update on my stance on the market and why I think ALT Season is waiting:
______________________
BINANCE:BTCUSDT
