Buy gold, there may be a rebound in the short termAt present, gold has touched the area of 3325-3315 mentioned in my previous article, and the lowest price is around 3316. At present, due to the current important support area of 3310-3300 below, gold still has a rebound demand in the short term; although gold has not rebounded sharply at present, the downward momentum has indeed slowed down, and gold may rebound after the short force is consumed. Moreover, the ceasefire between Iran and Israel has not yet been settled. Moreover, the ceasefire between Iran and Israel has not yet been settled. With the fluctuating situation in the Middle East, bulls may have opportunities to counterattack.
However, the current performance of gold is indeed relatively weak, so there is no need to expect gold to rebound and fill the upper gap area of 3360-3370 in the short term; in trading, the rebound expectation can be appropriately lowered, and long positions can continue to be held and look up to the 3340-3350 area.
Trend Lines

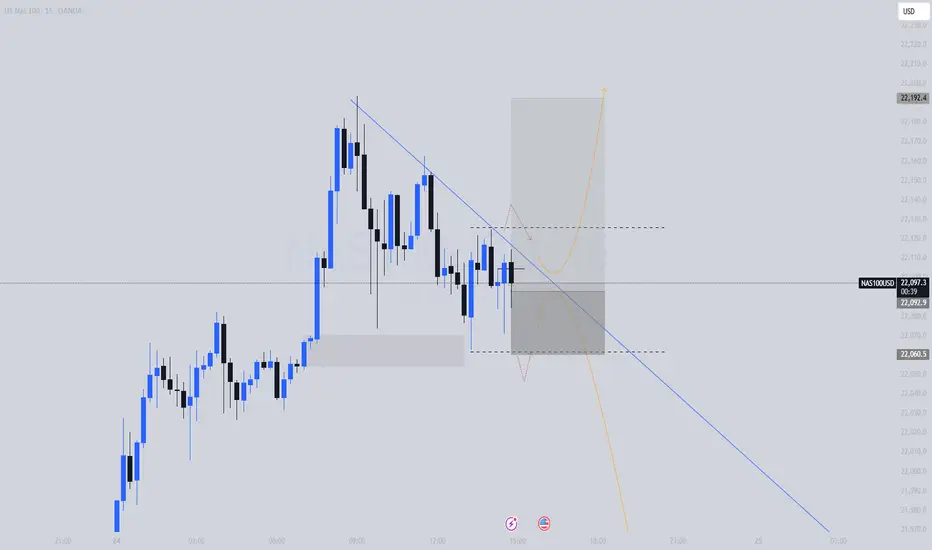
NAS100 | 15min | Breakout or Breakdown SetupPrice is currently testing the descending trendline and a key demand zone after a short-term selloff. Entry taken at a possible liquidity grab with bullish intent, targeting a breakout above the trendline. If rejection continues, a drop towards the lower liquidity area near 22,060 is likely. Watching for confirmation on the next 1–2 candles.
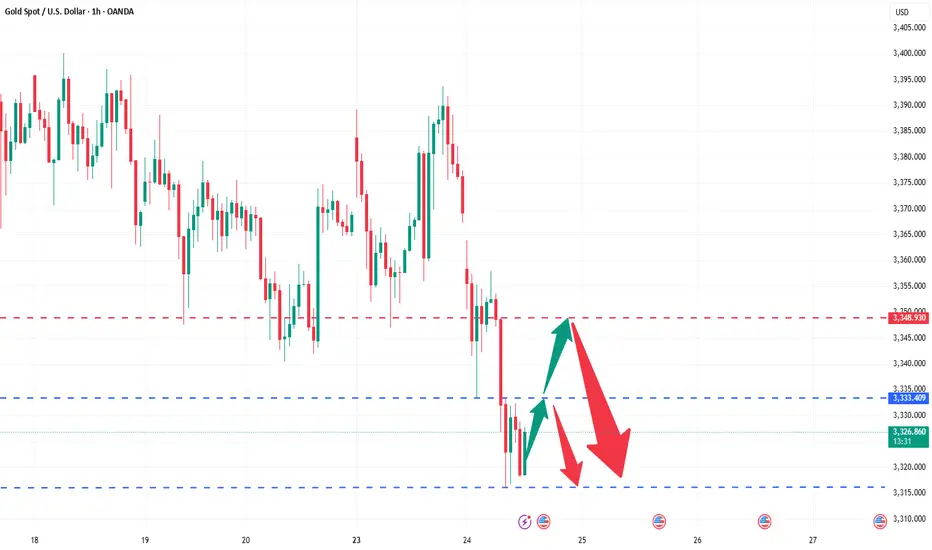
The golden storm is coming again, are you ready?Gold rebounded after falling back to 3333 in the first wave, and then rebounded to 3357 in the second wave before falling again, breaking through the previous low of 3333 and accelerating down to 3316. Currently, the short-term trend has stabilized in the 3316 area, which is also the support level for multiple rebounds in the previous period. After continuing to fall today, it has not broken through. We have arranged long orders in the 3316-3317 area in advance and have taken profits near 3331. Gold rebounded after stepping back again. Our long order plan is still in position. If the subsequent rebound breaks through the 3333 line, it is expected to further rise to the 3340-3348 area. We will try to short in this area.
In the short-term structure, the upper resistance focuses on the 3340-3348 area, and the lower support focuses on the 3310-3315 area. 3300-3305 is the watershed between the strength of long and short positions in the short term. The daily level is still under pressure as a whole, and the main idea of high altitude continues.
Gold operation strategy: short gold when it rebounds to around 3340-3348, target the 3330-3320 range.
NAS100 | LTF viewpointWe are currently caught between 2 LQC candles that have both swept LQ and we are waiting for the break of the trend to the upside as we have tapped into to 68 & 72% fib levels
So the is a high chance we continue to the upside with NASDAQ BUT if market decides to disregard that setup o9f UPSIDE momentum the is a chance of sellers stepping into the market only if of LQC(liquidity swept candle) decides to not hold then we can begin looking for SELLING OPPORTUNITIES
FEEL FREE TO DROP A FEW ADVICES IN THE COMMENT SECTION IF YOU HAVE SOMETHING SIMILAR THAT SUPPORTS MY ANALYSIS OR IF YOU ARE SEEING SOMETHING DIFFERENT

Will the gold bearish trend continue?
💡Message Strategy
The gold market is facing a complex game of long and short factors in the near future. On the one hand, US President Trump announced that Iran and Israel had reached a "comprehensive ceasefire", and the market's risk aversion demand plummeted, and gold was under obvious short-term pressure. However, according to Reuters, Israel still has small-scale military operations, which has led to differences in the market's optimism about the situation in the Middle East, and the downward space of gold is temporarily limited.
On the other hand, US economic data is mixed. In June, the S&P global manufacturing PMI remained unchanged at 52, the service industry PMI fell slightly to 53.1, and the composite PMI fell slightly to 52.8, suggesting that the momentum of economic expansion has slowed down marginally. More importantly, Fed officials have released dovish signals one after another. Fed Governor Bowman expressed concern about labor market risks and supported interest rate cuts this year, echoing Governor Waller's expectations of a rate cut in July. This adjustment in monetary policy expectations has led to a weakening of the US dollar, providing some support for gold prices.
📊Technical aspects
1. Pay attention to the defensive position at the weekly level. As time goes by, this position is now in the 3316-3315 area. After breaking 3333 at noon, it accelerated to reach here, so pay attention to the gains and losses here in the future, so as to prepare for the next space switch
2. The daily line has been defending the lifeline for nearly a month. The current lifeline position is 3355. No matter how it pierces in the previous process, the final closing line must return to the top of the lifeline, thus becoming a support area
This means that today's closing is very critical. It can be closed below the lifeline, and then switch space downward to enter the area from the lifeline to the lower track 3355-3280
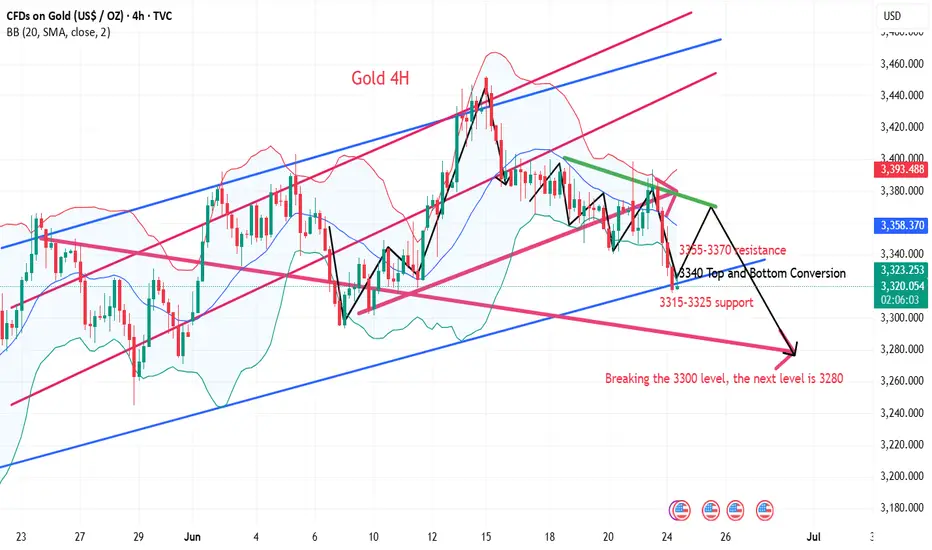
3. The four-hour pattern opens downward. Yesterday, the resistance of the upper track of the pattern was determined twice, and then it began to fall continuously, fell back to the lifeline, and then fell below the lower track of the pattern. Now it is further down and breaking the low
Then, keeping high is the key, breaking low is the focus. The previous starting and falling acceleration points are 3357 area, 3370, and finally 3388-3390.
Today's high point is 3370 area. The resistance range of 3357 is determined at noon. The pattern opens downward. Keep high and break low to see acceleration. After breaking the high point, it returns to sweeping.
4. The double lines of the hourly chart are glued together to form a pressure area. The interval of 3355-3370 just coincides with the two resistances above. Use this as suppression to switch space downward.
5. The large channel cooperates with the small channel. The price falls below the lower track position of the large channel and begins to switch space further downward. The top and bottom conversion position is 3340, and the final acceleration starting point is 3348.
Use this as suppression, and look down to the weekly defense line area of 3316-3315.
If it falls below, the next support will focus on the 3300 mark. If it breaks 3300 again, the next position is 3280
💰Strategy Package
Short Position:3348-3354,SL:3375,Target: 3300-3310
Long Position:3280-3290,SL:3260,Target: 3340
AUDCHF: Bearish Move From Resistance Confirmed?! 🇦🇺🇨🇭
AUDCHF may drop from the underlined blue supply zone,
following a bearish breakout of a support line of an expanding
wedge pattern on an hourly time frame.
Goal - 0.5253
❤️Please, support my work with like, thank you!❤️

Eicher Motors breaks?Eicher Motors breaks out of resistance with volume eyes set on the upper trendline near 6011.
After weeks of consolidation between 5250 and 5575, Eicher Motors has finally broken out of its sideways zone with strong follow-through and bullish intent.
Price not only cleared horizontal resistance but also pushed above the red supply zone around 5645, confirming buyer dominance.
This breakout aligns with the broader ascending channel that has been intact since March. The structure now hints at a potential continuation toward the upper channel line, projected near 6011 level highlighted risk-reward 1:3,
From a fundamental lens, Eicher has seen improved export numbers and rising traction in the premium segment, especially with Royal Enfield's increasing demand in overseas markets. If macro sentiment remains supportive, this technical breakout could be backed by earnings momentum in the upcoming quarters.
On the flip side, a failure to sustain above ₹5575 may drag the price back to test the breakout zone around ₹5430–₹5250.
Like, comment your thoughts, and share this post
Explore more stock ideas on the right hand side your feedback means a lot to me!
Disclaimer: This post is for educational purposes only and should not be considered a buy/sell recommendation.

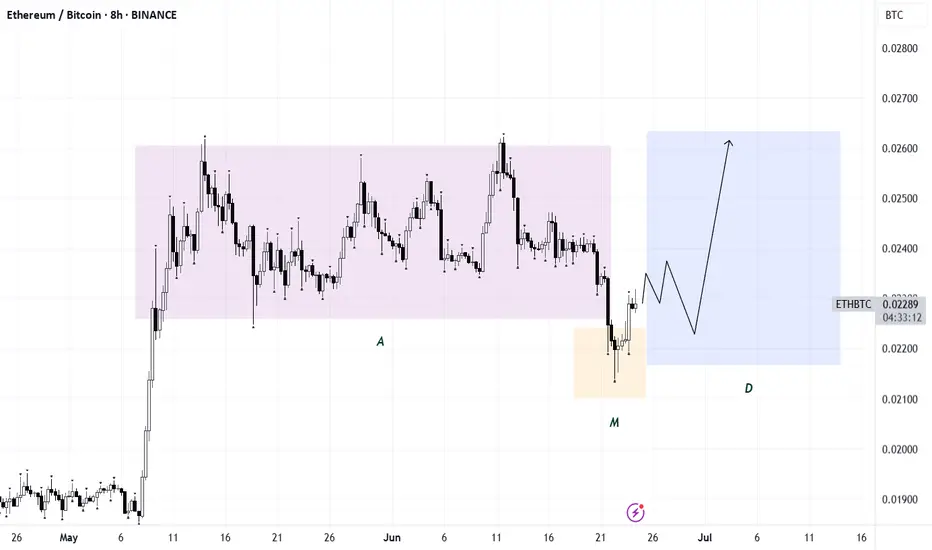
ETH/BTCPotential AMD setup forming. Ideally, a distribution phase unfolds before July 9th — which could trigger a rotation into altcoins.
As always, confirmation is key for any entry. No confirmation — no trade.
S&P 500 Futures Rise on Ceasefire Relief, Eyes on Fed PowellSPX500 OVERVIEW
U.S. Futures Rise as Ceasefire Eases Tensions, Focus Turns to Powell
U.S. stock futures climbed on Tuesday, with S&P 500 futures up 0.8%, extending gains from the previous session as Middle East tensions eased following a ceasefire announcement.
President Trump confirmed a ceasefire agreement between Israel and Iran, which appears to be holding for now—though early signs of potential violations have already emerged.
Market attention is now firmly on Federal Reserve Chair Jerome Powell’s testimony before Congress today, where traders hope to gain more clarity on the Fed’s economic outlook and rate path.
TECHNICAL OUTLOOK – SPX500
The price touched resistance at 6,098 and is currently hovering near that level.
Failure to break above 6,098 may trigger a short-term correction toward 6,041, before another push higher.
A confirmed breakout above 6,098 would open the path toward the All-Time High (ATH) at 6,143, followed by extended targets.
Support Levels: 6041 → 6010 → 5966
Resistance Levels: 6143 → 6175 → 6225
Stability above 6,098 confirms bullish continuation, while failure to hold may suggest a temporary pullback before resuming the uptrend.

War breaks out again? The latest analysis and layout of gold📰 Impact of news:
1. The ceasefire agreement reached earlier did not take effect, and Trump believed that both sides violated the agreement
2. Federal Reserve Chairman Powell delivered a speech 3 hours later
📈 Market analysis:
At the 4H level: the Bollinger Band opening is enlarged, the MACD indicator double-line death cross is downward, the short-selling force is strengthened, but the RSI indicator rebounds after being oversold. Overall, there are obvious signs of a rebound in gold prices. At the hourly level: the gold price is in a downward channel, the Bollinger Bands are expanding, the MACD indicator is dead cross and the red bars are converging, and the short momentum has weakened. The RSI indicator rebounds from oversold, and the demand for spot gold rebounds is obvious. Therefore, we still hold long orders near 3320 in the short term. Short-term operation suggestion: go long when it stabilizes at 3325-3315, pay attention to the resistance range of 3370-3380 on the upside, and consider shorting when encountering resistance and pressure.
🏅 Trading strategies:
BUY 3325-3315
TP 3335-3345-3365
SELL 3370-3380
TP 3340-3330
If you agree with this view, or have a better idea, please leave a message in the comment area. I look forward to hearing different voices.
OANDA:XAUUSD FX:XAUUSD FOREXCOM:XAUUSD FXOPEN:XAUUSD TVC:GOLD

Dow Jones Gains on Rate Cut Hopes and Ceasefire Relief US30 OVERVIEW
Wall Street Rises on Fed Rate Cut Hopes and Geopolitical De-escalation
The Dow Jones (US30) remains under bullish pressure, supported by rising expectations of a Federal Reserve rate cut later this year and a ceasefire agreement between Iran and Israel, which has eased market tensions.
TECHNICAL OUTLOOK – US30
The price maintains a bullish bias as long as it trades above the pivot level at 42,810, with upside potential toward the key resistance at 43,210.
A short-term bearish correction is possible toward 42,810 or even 42,670, but the broader structure remains bullish above these levels.
Resistance Levels: 43,060 → 43,210 → 43,350
Support Levels: 42,670 → 42,420 → 42,160
A sustained break below 42,670 could signal deeper correction, while a clear move above 43,210 would confirm continued bullish momentum.

Weakness continues, continue to short the bear market📰 Impact of news:
1. Pay attention to Powell's speech in New York
2. Pay attention to geopolitical influence
📈 Market analysis:
Gold opened lower and showed a weak situation. The 1H moving average was arranged downward. In the short term, bears still occupied the main trend. From the 4-hour analysis of gold, the bulls still had repeated resistance before breaking down. Once it breaks down, the market will go further bearish. Pay attention to 3330 below. 3400 is still the key above in the short term. Only by breaking through the bulls can the rebound continue. In terms of operation, high-altitude and low-long are temporarily maintained. Pay attention to the short-term resistance of 3355-3365 above, and the support of 3340-3330 below. Pay attention to the breakthrough! Pay attention to Powell's speech in the New York session.
🏅 Trading strategies:
SELL 3370-3365-3355
TP 3340-3330
BUY 3340-3335-3320
TP 3345-3355-3365
If you agree with this view, or have a better idea, please leave a message in the comment area. I look forward to hearing different voices.
TVC:GOLD FXOPEN:XAUUSD FOREXCOM:XAUUSD FX:XAUUSD OANDA:XAUUSD

Gold is under pressure and continues to focus on weekly support
The Israeli-Iranian conflict that broke out on June 13th lasted for 12 days before a ceasefire agreement was reached. Iran retaliated against the US military base but did not block energy transportation. Trump called its response weak, and market concerns cooled. Gold and oil prices gave up their gains. Spot gold closed at $3,368.98 per ounce, close to flat. U.S. crude oil fell 9% from a 5% increase. Trump announced on Tuesday that Israel and Iran had reached a ceasefire agreement. After mediation by Qatar, Iran agreed, and Israel also hoped to end the conflict within a few days.
Gold fell as the situation eased and the demand for safe-haven assets weakened. Oil prices fell more due to the lack of risk in the Strait of Hormuz, and U.S. stock index futures rose. Federal Reserve Vice Chairman Bowman unexpectedly said that interest rates may be cut in July. U.S. Treasury yields fell and the U.S. dollar index fell, but did not support gold prices. The U.S. economy is facing inflation and growth slowdown pressure. If the situation in the Middle East worsens, oil prices may soar, exacerbating the risk of stagflation. Short-term ceasefires and differences with the Federal Reserve suppress gold prices. Medium- and long-term geopolitical risks and expectations of interest rate cuts support gold. Investors can pay attention to relevant developments and diversify their allocations.
In terms of gold, the overall price of gold fell on Monday. The highest price rose to 3396.68 on the day, and the lowest price fell to 3346.92, closing at 3368.94. On Monday, gold jumped higher in the early trading, and then came under pressure again. It continued to rise after the European and US trading to test the opening high. The price fell very weakly overnight, and finally ended with a big negative. At present, gold is still in a volatile decline.
From a multi-cycle analysis, first observe the monthly rhythm. The price ran according to the rhythm in May as the author said, and finally in a cross state. For June, focus on the gains and losses of the highs and lows in May. The price will only be a real break if it really closes above this position. The long-term watershed is at 2780. From a weekly level, the gold price is supported by the 3280 regional support level. From a mid-term perspective, we are still in a mid-term bullish position, but we need to pay attention to the market's retracement to the weekly support. At the same time, the price will be further under pressure only if it breaks the weekly support. From the daily level, the price breaks the 3365 daily watershed. The overall follow-up still focuses on the pressure performance, and the focus below is on the retracement to the weekly support. At the same time, according to the four-hour level, we need to pay attention to the 3360 position temporarily. Since gold is currently in a volatile decline, it will continue to be short before breaking 3405. In the short term, we will first focus on the four-hour and daily resistance pressure, and focus on the 3320 and 3280 area support below.
Gold 3360 and 3365 range is under pressure, and the target is 3320-3280

Gold: Breakout and Potential retraceHey Traders, in today's trading session we are monitoring XAUUSD for a selling opportunity around 3,340 zone, Gold was trading in an uptrend and successfully managed to break it out. Currently is in a correction phase in which it is approaching the retrace area at 3,340 support and resistance area.
Trade safe, Joe.

Are you ready for the next wave of gold market?Gold fell back as expected after opening high. Today's strategy arranged long orders at 3350-3352, and successfully closed the market at around 3362 with profit. The subsequent three short orders also closed the market at a profit as expected. The points were perfectly predicted, and the long and short positions were perfectly grasped during the day. The strategic ideas were disclosed in advance and all were fulfilled.
At present, the overall trend of gold is still bullish, and it is in the adjustment stage in the short term. The large range this week is 3340-3405. Although there is a rebound, the upward pressure is still not small, and the gold price may continue the wide range of long and short fluctuations. Pay attention to the 3355-3340 area below. In terms of operation, long orders are arranged according to the strength of the retreat; pay attention to 3385 in the short term above. If it can effectively break through, look at 3395-3405. The strong pressure is still at the 3405 line. If it does not break, it will still fall under pressure. On the contrary, if it stabilizes, it is expected to hit last week's high.
Operation suggestion: When gold falls back to around 3355-3340, long orders can be arranged in batches, with the target at 3370-3380. Short orders will be adjusted according to the real-time market, please pay attention to the bottom 🌐 notification for specific points.

Fintech or Government Regulation? — A Perspective from MacromicsStablecoins have evolved from a supplementary tool into a cornerstone of the digital economy. They are used in DeFi, cross-border settlements, and provide liquidity in crypto markets. Today, the question is not whether stablecoins are needed, but who will control them — private fintech companies or government regulators.
Fintech: Flexibility, Speed, Innovation
Projects like USDC, USDT, and Paxos have demonstrated that private companies are capable of launching robust digital assets, quickly adapting them to markets, APIs, wallets, and decentralized platforms.
Advantages:
24/7 availability;
Operational independence;
Flexible integration architecture.
The downside is legal uncertainty. Without licenses and oversight, issuers are exposed to regulatory risk.
Government Pressure and CBDCs
The US, EU, and China are moving toward tight control over stablecoin issuance. The EU has adopted the MiCA regulation, while the US is discussing mandatory licensing of issuers. China and India are betting exclusively on CBDCs, banning private stablecoins altogether.
While CBDCs currently lack the flexibility of private solutions, they offer an alternative for the public sector and B2B settlements.
