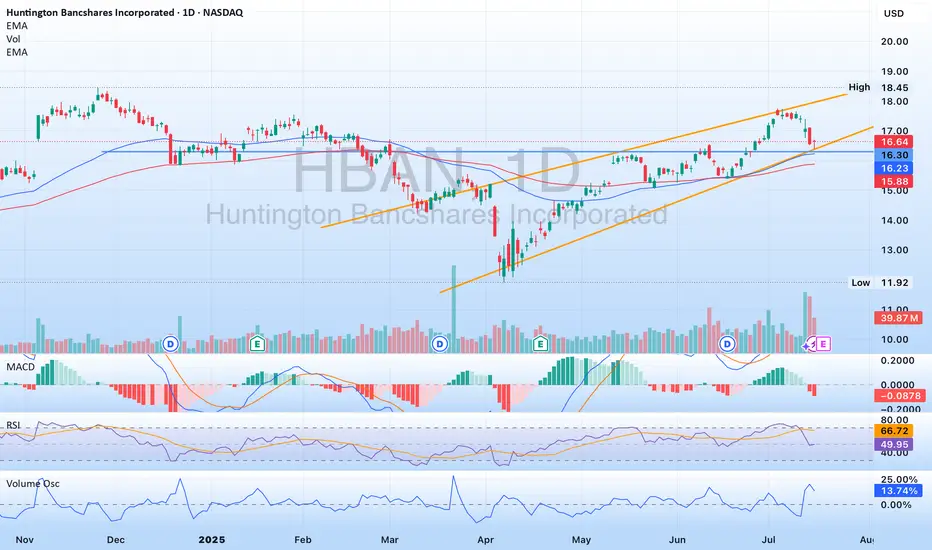
$HBAN - well positioned to continue on its pathNASDAQ:HBAN has been in a rising channel since April, and is no touching the lower band of the channel. His area also includes some previous resistance turned support, as well as some movement paces. NASDAQ:HBAN recently announced they are acquiring Veritex ( NASDAQ:VBTX ) which will strengthen their mark in Texas. Please note NASDAQ:HBAN is releasing earnings July 18th. A good report should see the stock moving towards the upper band of the channel, maybe break through it.
Trend Lines
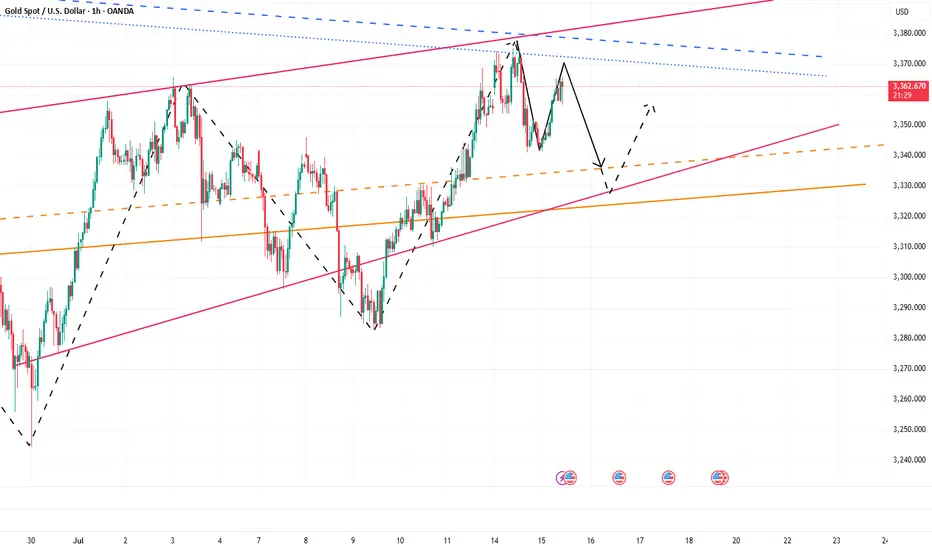
Oolong news stirs up gold market trend analysisWe decisively prompted support and arranged long orders near 3320. While the bottom stabilized, Trump suddenly released a smoke bomb, saying that he was considering whether to fire Fed Chairman Powell. The risk aversion sentiment exploded instantly, and gold soared in the short term, hitting the target of 3340-3345 in a few minutes, and the highest rose to 3377! But then Trump denied the relevant plan, and the risk aversion sentiment quickly cooled down. The gold price immediately fell from a high level, and the market returned to a volatile pattern. At present, the risk aversion drive has been falsified. In the short term, we need to focus on the trend opportunities after the high and fall. Considering that the news is still uncertain, it is recommended to wait and see first, and wait for the situation to become clearer before entering the market.
🔍Technical observation: The 1-hour chart of gold shows an obvious high and fall pattern, accompanied by a long upper shadow line closing. If there is no new risk aversion stimulus, the short-term momentum for another attack is limited.
📉Operational suggestions: Maintain the main idea of rebound short selling, pay attention to the short-term pressure in the 3365-3370 range, and choose to arrange short orders. ⚠️It should be noted that news has a great impact on the market. Transactions need to be executed decisively, but be careful not to be led by short-term fluctuations. Strict implementation of trading plans is the key.

BorgWarner Inc Quote | Chart & Forecast SummaryKey Indicators On Trade Set Up In General
1. Push Set Up
2. Range Set Up
3. Break & Retest Set Up
Notes On Session
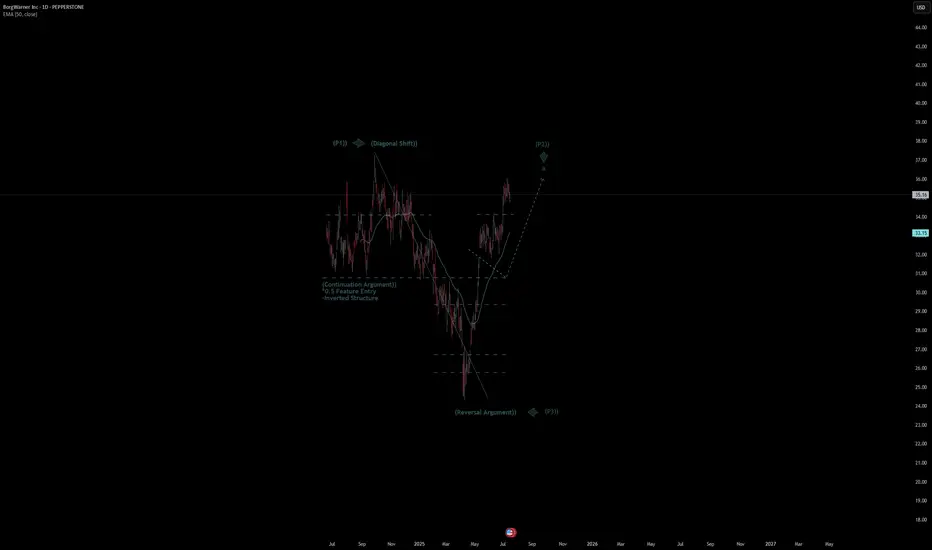
# BorgWarner Inc Quote
- Double Formation
* (Diagonal Shift)) At 38.00 USD | Completed Survey
* 0.5 Feature Entry | Subdivision 1
- Triple Formation
* (P1)) / (P2)) & (P3)) | Subdivision 2
* (TP1) = a / Long Consecutive Range | Subdivision 3
* Daily Time Frame | Trend Settings Condition
- (Hypothesis On Entry Bias)) | Regular Settings
- Position On A 1.5RR
* Stop Loss At 32.00 USD
* Entry At 35.00 USD
* Take Profit At 39.00 USD
* (Uptrend Argument)) & No Pattern Confirmation
- Continuation Pattern | Not Valid
- Reversal Pattern | Not Valid
* Ongoing Entry & (Neutral Area))
Active Sessions On Relevant Range & Elemented Probabilities;
European-Session(Upwards) - East Coast-Session(Downwards) - Asian-Session(Ranging)
Conclusion | Trade Plan Execution & Risk Management On Demand;
Overall Consensus | Buy
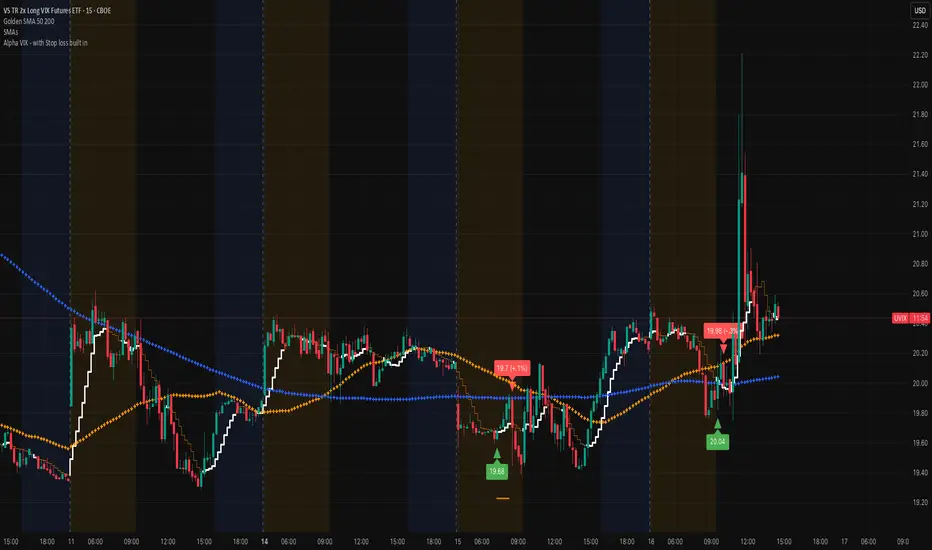
UVIX marching on (VIX proxy)Very nice spike this morning, that's typically a sign that there's more volatility in the works. Remember that we are at record lows on the VIX and that doesn't stay in this region for a long time. Add the Alpha VIX indicator to help you get an entry. The economy is brittle and staying focused on the VIX is a very nice play!
Best of luck and DM if you have any questions.....
Potential buys?Trade Journal Entry – XAUUSD (Gold Spot)
Date: July 16, 2025
Platform: TradingView (Demo Account)
Timeframe: 4H
Direction: Long
Status: Active, In Profit
Unrealized Profit: +301.54 GBP
Entry: ~3,327
Stop Loss: Below 3,316 zone
Take Profit (TP): ~3,492
Risk:Reward Estimate: ~1:4 or better
Market Context
Previous pullback into the sell-side liquidity and POI zone held firmly.
Price rejected from POI and aggressively moved upward, confirming bullish order flow.
POI (Point of Interest) is marked intentionally — awaiting a return to the zone after price closes above the wick.
A full buy confirmation is expected only upon a bullish close above the wick, followed by a retest into the POI.
Trade Logic
Trade was initiated based on:
- Break of market structure (BMS)
- Sweep of sell-side liquidity
- Bullish intent shown via momentum candles
- Expectation: price returns to POI after wick close for full confirmation
Management Plan
- Consider partial TP at 3,365–3,375 zone.
- Trail SL below latest higher low on lower TF.
- Wait for price to revisit POI after close above wick before scaling in full size.
Emotional Reflection
Feeling composed. The trade plan is well-structured with a POI-based confirmation strategy. No rush to fully size until POI is respected post-wick close.
Reflection Questions
- Did I stick to my POI confirmation logic?
- Am I patient enough to wait for a close above the wick?
- Is my entry risk properly managed while awaiting confirmation?

BIG ALERT: Stock Market shown a massive break on a TL support. 🚨BIG ALERT: Tech Sector shown a break on a massive TL support level and this news just came out.
We may see everything reverse here pretty soon, depending how the market responds......
CRYPTO may still trend upward and most likely WILL!
- Crypto wins in the end, stay watchful! #BlackChain

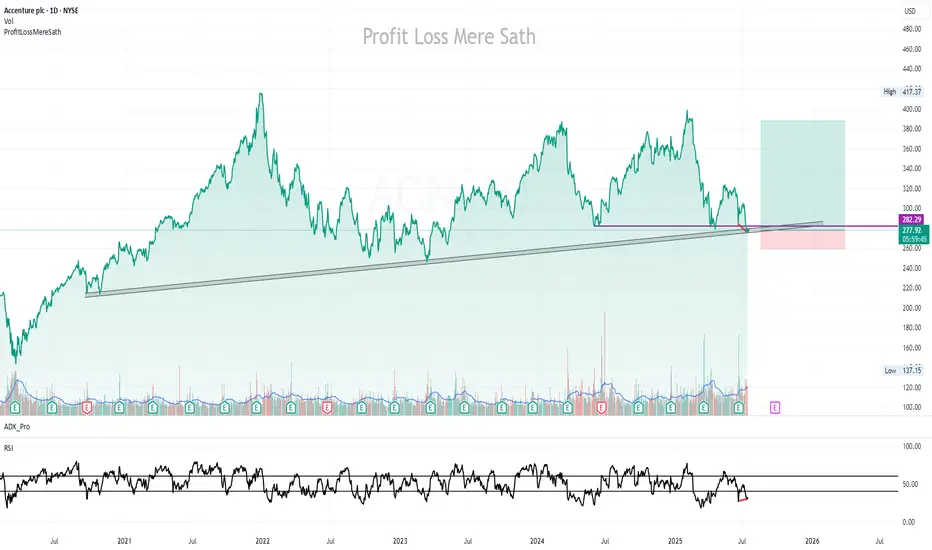
ACN | Buy @LTP | SL below 260 on closing basis | Target 385Disclaimer:
This is not financial advice. Please do your own research or consult with a financial advisor before making any investment decisions. Investments in stocks can be risky and may result in loss of capital.
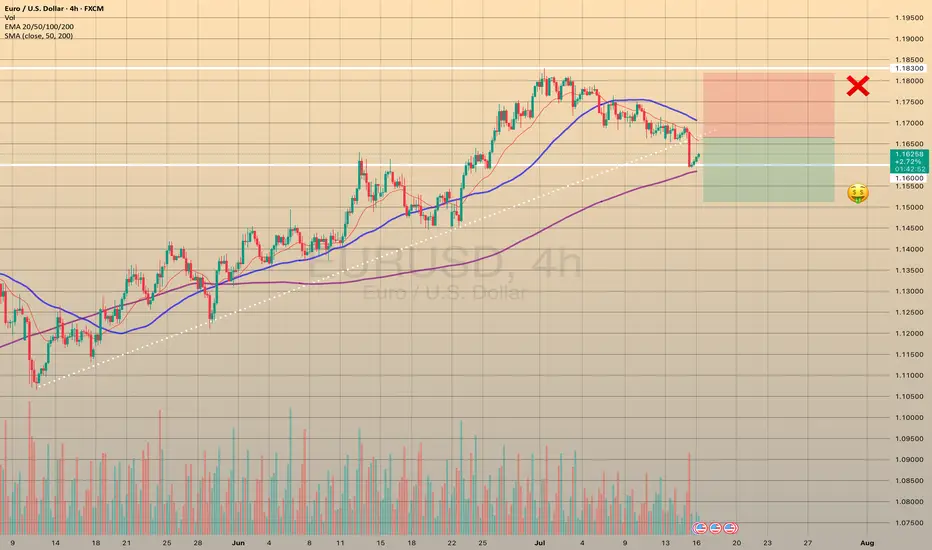
EURUSD TRIGGERED STOP LOSSTRADING IDEA UPDATE - EURUSD TRIGGERED STOP LOSS
The U.S. CPI report data came out right what the market expected (2.7% vs. 2.7% annually). After this report the pair went downwards on increased volume, triggering my stop loss and found the support only on 4-h sma200 and 1.16000 level.
What will be the possible scenario next?
I assume that the asset will go testing the trendline at 1.16650. If the test is successful, I will consider opening a
🔽 a pending sell stop order at 1.16651 with
❌a stop loss at 1.18180 and
🤑a take profit at 1.15122
Only if the retest is successful, not earlier! Let's observe first. Additionally, today is the U.S. PPI report coming out at 12:30 p.m. UTC, so got to be careful around this time
DENTA – SMC & Breakout Structure Analysis (Jul 2025)Accumulation/Distribution: Long consolidation near ₹270–₹311
Break of Structure (BOS): Trendline breakout + recent close above prior top
Neutral toward Bullish: Awaiting volume and price action confirmation to validate trend shift
1. Defined Range Structure
Support ~₹270 (red line) holding over 4+ months
Resistance ~₹311–₹315 (blue line) tested multiple times before today
2. Possible Breakout Attempt
Price has breached the descending trend line—an early mark of bullish structure shift
Close is marginally above resistance, but lacks volume confirmation for breakout validation
3. Volume & Confirmation
No substantial volume spike yet—breakouts typically require accompanying volume
Watch for multi-session closes above ₹315 with sustained volume to support continuation
4. Pullback as an Opportunity
Retracing into ₹305–₹310 could form a higher-low
Such a move would align with healthy trend behavior, offering clearer structure and stronger validation

Public short selling profit, NY short-term multiple layoutInterest rate futures data showed that the results were in line with our previous expectations, with a lower rate cut this month and a higher probability of a 25 basis point cut in September. In the short term, gold may first take profits and then rebound. NY session trading has just begun. Bros can pay attention to the 3335-3330 area below. If it falls back and stabilizes, you can consider participating in long positions, defending 3325 and targeting 3355-3365.
OANDA:XAUUSD

EDELWEISSAfter a strong uptrend , Price consolidated near the resistance forming a tight closing base
Price is breaking out of the range.

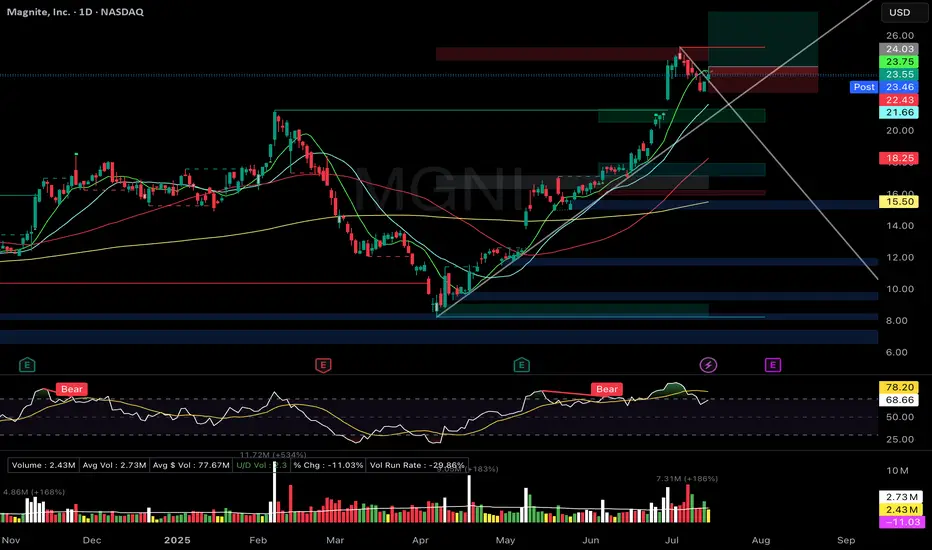
MGNI Zanger-style Bull Flag Breakout PullbackMagnite Inc. (MGNI)
🚀 Entry: $24.03
📊 Setup: Zanger-style Bull Flag Breakout Pullback
🛑 Stop: $22.43
🎯 Target: $27.50
🔑 Why I Entered:
Picture-perfect bull-flag pullback pattern with volume drying significantly, tapping precisely on the rising trendline.
Price action holding strong above rising short-term EMAs (9/21).
Excellent relative strength, reflecting a previous strong-volume breakout move.
🎯 What's Next:
Seeking strong volume surge confirmation to confirm continuation of the breakout.
Earnings report in three weeks—ready to take partial profits if price significantly appreciates ahead of the event.
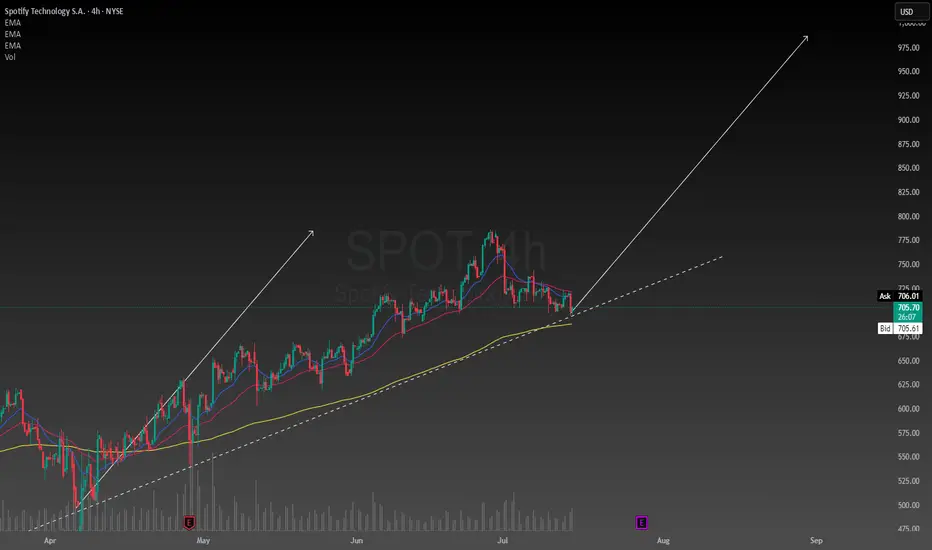
Raising the bar for SpotifySpotify has been my favorite stock so far this year. Primarily because resilience in uncertain economies. Subscription-based services, especially freemium models, are seen as defensive. Spotify is the number one music streaming service in the world and unless that changes people will keep using it every single day in their lives.
They will generate revenues based on advertisements and subscriptions which are in my opinion reasonable and conducive of a strong business model. I am raising my price target to $985. This is not unreasonable considering the intrinsic value of the stock is between $400 and $2900. I am confident Spotify will find ways to stay ahead of its competitors and dominate the music streaming industry. While keeping its customers happy and loyal.
USD/CAD Coils Below Key ResistanceUSD/CAD has rallied nearly 1.3% off the monthly low with the advance now testing resistance at 1.3729/50- a region defined by the 38.2% retracement of the 2021 rally and the May opening-range lows. Note that pitchfork resistance converges on this threshold over the next few days and further highlights the technical significance of this key zone- looking for a reaction off this mark this week.
USD/CAD is trading within the confines of an embedded channel extending off the monthly low with the weekly opening range taking shape just below confluent resistance at 1.3729/50. Ultimately, a breach / close above the June high / 61.8% retracement of the December 2023 advance at 1.3795/98 is needed to suggest a more significant low was registered last month / a larger trend reversal is underway. Subsequent resistance seen at the 2022 high close / 2023 high at 1.3881/99 and the 2022 high / 2020 March weekly-reversal close at 1.3977/90- both levels of interest for possible topside exhaustion / price inflection IF reached.
Initial support rests with the weekly range lows at 1.3670- a break / close below the monthly channel would threaten resumption of the broader downtrend. Subsequent support objectives unchanged at the yearly low-day close (LDC) / May, June, July lows at 1.3571/90 and the Fibonacci confluence at 1.3504/23.
Bottom line: The USD/CAD is testing confluent resistance at the February downtrend with the weekly opening-range set just below- look for the breakout in the days ahead and watch the weekly close here. From a trading standpoint, losses would need to be limited to the weekly lows IF price is heading for a breakout on this stretch with a close above 1.3795 ultimately needed to put the bulls in control.
-MB

SOL / ETH at Critical Inflection PointSOL / ETH loses the 50WMA.
Has been trading below it for the past 7 weeks, something we haven't seen since 2021.
Has also broken down from the 8 month bull flag / parallel channel. Retesting the key POI I've been eyeing.
HOPIUM: We've seen great rallies after CRYPTOCAP:SOL goes down ~40% vs CRYPTOCAP:ETH , which it is at now. We SHOULD see a turnaround here soon.
And I still believe SOL will greatly outperform ETH this cycle, especially when the ETF launches and Alt Season kickstarts.
Right now we're seeing a typical market cycle BTC > ETH > Large Caps > Mid Caps > Micro Caps

IS PRICE REVERSAL AROUND THE CORNER IN AUDCHF?- H4 Outlook! AUDCHF has been trending bearish for a long period of time in H4 timeframe and also on daily timeframe. Recently, we saw a bullish breakout couple of days ago and we’re yet to ascertain the next possible move in this pair.
Technically, if we get a break above 0.52522 I’d be anticipating more bullish price action to develop.

USD/JPY ticks higher today!USDJPY has been trading strongly bullish in couple of days now and it seems the momentum ain’t slowing down anytime soon! Yes, this is a good time to opt in for a buy once we get any opportunity for that. We’re looking forward to tracking the market for a time price will begin to make a pullback so as to opt in for a buy.

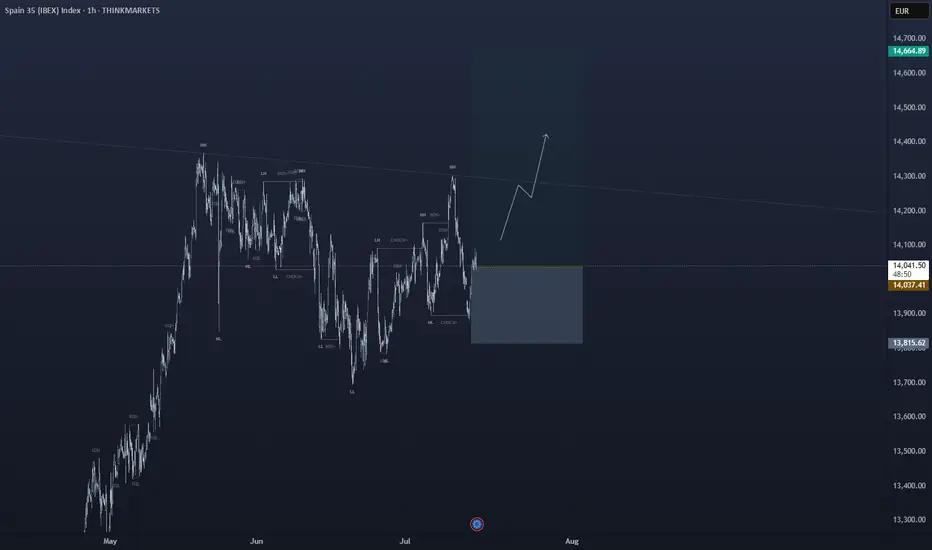
bullish on IBEX35Trading Idea Setup:
IBEX35 has given me enough confirmation indicators to forecast a bullish run from this price point. ↗️🟢
✅Favorable TP level(s):
⦁ 14269.64
⦁ 14357.51
🛑Stop Loss:
⦁ 13834.00
Indications used:
Trend confirmation indicator
Elliot wave assistance
Momentum indicators
______________________________
Trading Involves Risk: Decisions to buy, sell, hold, or trade in securities, commodities, and other investments carry inherent risk, including the possibility of substantial losses. Please ensure every trade placed is supported by your own thorough analysis and/or fundamental research.
Ps: All the trades that I place, I do hold indefinitely unless noted otherwise but TP points will always be provided. Happy Trading 🖤
Gold’s Uptrend Is a Mirage, Bears Are Lurking Beneath!Gold repeatedly touched around 3375 yesterday and then fell under pressure, proving that there is strong resistance above. Moreover, after gold retreated and touched around 3341 yesterday, it did not recover in time and stand above 3350. It was not until today that it rebounded and touched around 3365. The rebound cycle has been extended to the present, and the rebound strength is not very strong.
Since gold retreated, it has not been able to recover the lost ground in time. Gold is under pressure in the 3360-3370 area in the short term. If gold cannot successfully break through this resistance area during the day, then gold will retreat again, and will refresh the 3341 low again, and continue to the 3335-3325 area.
So for short-term trading, I think we can try to short gold in the 3360-3370 area appropriately, looking at the target area: 3350-3340
The battle for gold 3375-40 has begun, and CPI is coming!The current market has entered a short-term shock consolidation phase. Taking advantage of the temporary calm of the market, I would like to share my judgment and strategy with my brothers. I still tend to be bullish in the medium term. Yesterday's trend just verified my point of view. If the bulls want to break through the 3375 line, they must first complete the "deep squat wash", and this wave of retracement has also brought good profits to both our long and short traders. Friends who follow should have gained.
But the core of today is the CPI inflation data. As a heavy macro event, the recent forward-looking data (such as employment and labor market) is likely to be bearish for gold. The market has formed a consistent expectation. In this case, I have to temporarily put aside the long thinking and turn to short. My point of view is that as a qualified trader, I have always attached great importance to the data market. Whether it is non-agricultural, CPI or interest rate resolution, I have never easily made mistakes in grasping this kind of structural drive. Since the market has locked the focus of long and short positions in the core range of 3375-3340, we must face up to this structural competition. If the judgment is wrong this time, I will re-evaluate whether I should continue to participate deeply in this obvious data expectation transaction, but for now, I must respect the game logic of the market.
Operation strategy reference:
Currently, the 3360-3366 area can be lightly shorted. If it touches the 3370 line before the CPI is released, it can be appropriately covered; the stop loss is clearly set above 3375. Once it breaks through, leave the market decisively without hesitation. The lower target is 3350-3340 first. If it breaks, continue to look down to the 3330 area.

CPI is coming, gold 3340-3375 pay attention to the breakthrough
Review of yesterday's market trends and technical points:
Gold: Yesterday's opening gapped up and touched the upper track of the short-term channel and the 618 split resistance level of 3374. After being under pressure, it filled the gap and continued to choose to be bullish after stabilizing close to the middle track of the hourly line; the European session attacked 3374 many times without success, and the US session lost the middle track of the hourly line downward, which means that it is not urgent to be bullish repeatedly above the intraday low; finally lost the lower track of the short-term channel, so there will be a certain downward correction, but follow the trend of last Thursday and Friday. , the downward correction space is not large, just still stable above the daily middle track 3340, so use this as a defense, so continue to try to be bullish, today as expected ushered in a wave of higher;
Today's market analysis and interpretation:
First, the gold daily level: three consecutive positives and negative closing is a correction. According to the recent shock cycle, today is expected to close positive, and the focus is on whether the market can continue to rise in the future; today, the first thing to pay attention to is whether the middle track 3340 can stabilize and continue to rise, because yesterday's negative line is considered to be a correction. If the market can continue to fluctuate, then there is hope for testing 3400 and above; on the contrary, if it falls back to 3340 or below today, it will continue to hover below the resistance level of 3375, and the lower track line of the convergence triangle will support above 3300; then the CPI inflation data released today will be relatively important, and the market expects it to increase to 2.7% this time. Once the announced value is greater than or equal to 2.7%, then inflation will rise, which will weaken the interest rate cut and suppress the gold price; on the contrary, if the announced value is less than 2.7%, it does not meet the The market is expected to boost gold prices; if it is less than or equal to 2.4%, the probability of interest rate cuts will be increased, which will significantly boost gold prices;
Second, the 4-hour level of gold: today's focus is on the upper support of the lower middle track 3340 and the lower resistance of 3375 above, to see which side is effectively broken;
Third, the hourly level of gold: after stabilizing 3340 today, it will break through the early morning resistance level of 3351-52 and hit the 3365-66 line, so the overnight low bullishness will be successful; Currently it is running in a narrow range of 3365-3356, which means waiting for today's data; from a technical perspective, pay attention to the support of the middle track 3352 on the bottom. If it stabilizes, you can continue to be bullish. Pay attention to the resistance of 3374-75 on the top. Only when the big sun or continuous sun breaks through can new room for pull-up be opened; if the data is bearish and the middle track is not held downward, there is no rush to be bullish. Wait for the downward momentum to slow down, and a stop-loss signal will appear. If there are signs of sideways trading at the bottom, choose to layout low and long. Below 3340, there is still 3334 and 618 support, which is also the annual average. If it goes down again, it will give a good bottom speculation low. You can directly sell below 3310. The market will still repeatedly attack the resistance of 3365 and 3374 if it is stable; as long as it converges along the lower track of the daily triangle, the lows gradually move up, and every time it approaches the low, it is a good bottom speculation point, and there is basically a pull-up of 50-100 US dollars.
GOLD (XAUUSD): Mid-Term Outlook
Analysing a price action on Gold since March,
I see a couple of reliable bullish signals to consider.
As you can see, for the last 4 month, the market is respecting
a rising trend line as a support.
The last 4 Higher Lows are based on that vertical support.
The last test of a trend line triggered a strong bullish reaction.
The price successfully violated a resistance line of a bullish flag pattern,
where the market was correcting for almost a month.
A strong reaction to a trend line and a breakout of a resistance of the flag
provide 2 strong bullish signals.
I think that the market may grow more soon and reach at least 3430 resistance.
An underlined blue area will be a demand zone where buying orders will most likely accumulate.
❤️Please, support my work with like, thank you!❤️

HelenP. I Bitcoin will go to a correction after a strong impulseHi folks today I'm prepared for you Bitcoin analytics. If we look at the chart, we can see that the price has recently made a powerful impulse upward, breaking out of a long consolidation range between 110500 and 102500. This range acted as a strong accumulation zone, where the price bounced multiple times from both support levels. After the breakout, Bitcoin gained momentum and pushed sharply toward the 122000 mark. Now, after this sharp rally, I believe a correction is highly probable. Often, after such strong bullish moves, the market tends to pull back to retest the trend line or previous breakout zones. In this case, the trend line has been respected several times and now aligns with the 117500 area, which also acts as local support. That’s why I consider this zone to be a logical target for the correction. I expect BTCUSD can drop from the current highs and retest the trend line near 117500 points - that is my main goal for this setup. If the trend line holds, buyers may return to the market and push price higher again. Given the strong impulse, the breakout from consolidation, and the importance of the trend line, I remain bearish short-term and expect a drop toward 117500 points. If you like my analytics you may support me with your like/comment ❤️
Disclaimer: As part of ThinkMarkets’ Influencer Program, I am sponsored to share and publish their charts in my analysis.
