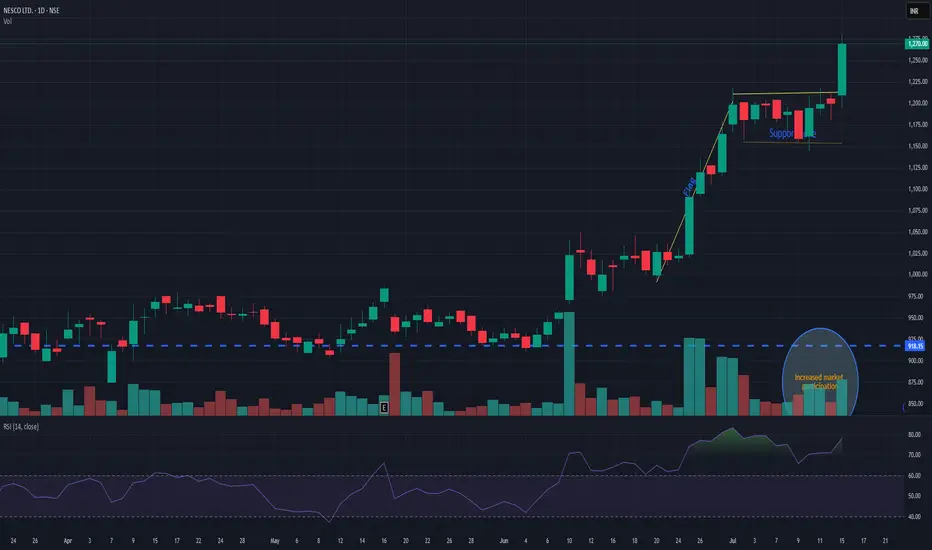
NESCONESCO giving flag pattern breakout with decent volume. Support is seen nr 1180. while pole initiation can be seen near 1010. Currently trading near 1270. It has a potential for new momentum. Keep it on radar.
Trend Lines
Nas100USD (LONG)
Price had been respecting the resistance trendline for months/years.
USD is at it support level which means indicies will go short
Perfect correlation.

USDJPY Short: Completion of Triple Combination Sub-wave 2Hello everyone! Over in this video, I analyzed the USDJPY and go through how I counted the waves and go through the lower levels sub-wave counts. I believe that USDJPY has completed a triple combination with the Z wave as a 5-wave structure. I talk about how this final wave might not be ideal and propose how the waves might be viewed in a different perspective. However, I believe also that the price is now good enough to short and propose a scaling-in method to short USDJPY.
Eventually, I think that USDJPY will go down to the lower trendline and break it. However, we will have to revisit the chart again when it does to see how the waves unfolded and then decide how to trade it.
Finally, as always, keep your risk tight and Good luck!

USDJPY InsightHello to all subscribers,
Please feel free to share your personal thoughts in the comments. Don’t forget to like and subscribe!
Key Points
- U.S. President Trump raised tariff uncertainty by sending tariff letters to 25 countries, but mentioned that “negotiations remain open with major trading partners like the EU,” reigniting TACO trading sentiment.
- Trump warned that if Russia does not reach a ceasefire agreement with Ukraine within 50 days, the U.S. will impose “secondary tariffs” on Russia and any countries conducting trade with it.
- BOE Governor Andrew Bailey hinted that the Bank of England could cut interest rates more aggressively if needed.
Key Economic Events This Week
+ July 15: U.S. June Consumer Price Index (CPI)
+ July 16: U.K. June CPI, U.S. June Producer Price Index (PPI)
+ July 17: Eurozone June CPI
USDJPY Chart Analysis
The pair showed a mild upward trend near the 142 level and successfully rose to the 148 level. The direction is expected to shift around the 148 resistance. If it fails to break through, a decline back to 142 is likely. However, if it breaks above 148, a further rise toward the 151 level is expected.

bullish on GOLDTrading Idea Setup:
XAUUSD has given me enough confirmation indicators to forecast a bullish run from this price point. ↗️🟢
✅Favorable TP level(s):
⦁ 3414.022
⦁ 3445.179
🛑Stop Loss:
⦁ 3277.205
Indications used:
Trend confirmation indicator
Elliot wave assistance
Momentum indicators
______________________________
Trading Involves Risk: Decisions to buy, sell, hold, or trade in securities, commodities, and other investments carry inherent risk, including the possibility of substantial losses. Please ensure every trade placed is supported by your own thorough analysis and/or fundamental research.
Ps: All the trades that I place, I do hold indefinitely unless noted otherwise but TP points will always be provided. Happy Trading 🖤

Crude oil rises slowly but falls quickly?
💡Message Strategy
International oil prices continued to climb on Monday, but the gains were limited. Brent crude futures rose 8 cents to $70.44 a barrel, continuing Friday's 2.51% rise. U.S. WTI crude rose 5 cents to $68.50, having surged 2.82% the previous trading day.
The main driving force behind this round of gains came from the market's expectation that the United States would further increase sanctions on Russia. U.S. President Trump said on Sunday that he would provide Ukraine with the Patriot air defense missile system and would make a "major statement" on the Russian issue on Monday.
The contradiction between supply and demand is also intensifying. According to market surveys, Brent crude oil rose by 3% last week and WTI rose by 2.2%. The International Energy Agency (IEA) pointed out that although the market supply and demand appear to be balanced on the surface, the actual global oil supply may be tighter than expected due to the summer refining peak and rising electricity demand.
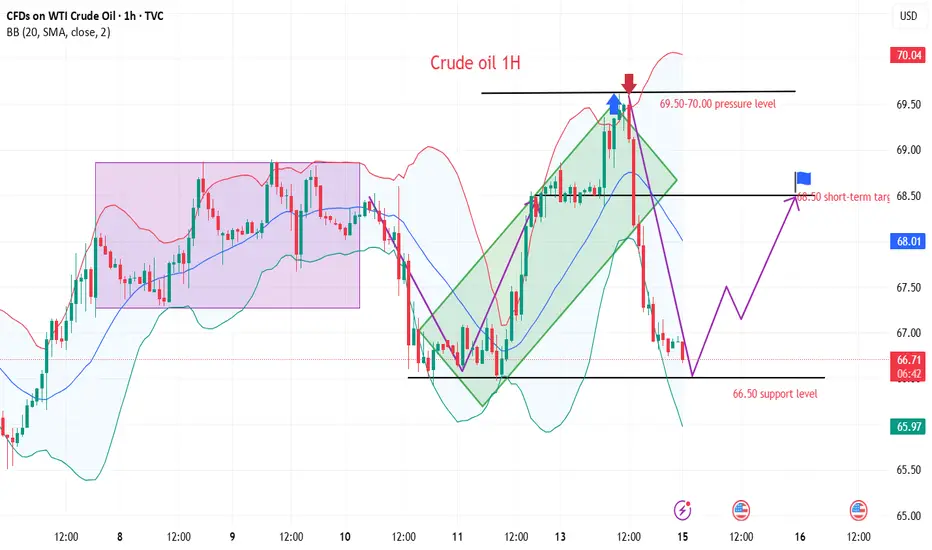
📊Technical aspects
WTI crude oil continued its rebound from last week's low on the daily chart, and the current price is running at the downward support of $66.70, indicating that the short-term bullish power has increased. The MACD indicator shows a golden cross and initial volume, and the momentum column begins to turn positive, indicating that the price is expected to challenge the previous high area (69.50-70.20 US dollars).
The short-term (1H) trend of crude oil is highly repetitive, and the oil price is supported at the lower edge of the wide range and rises again. The short-term objective trend direction is upward within the range. The bullish momentum is sufficient.
💰Strategy Package
Long Position:65.50-66.50,SL:64.00,Target:69.00-70.00
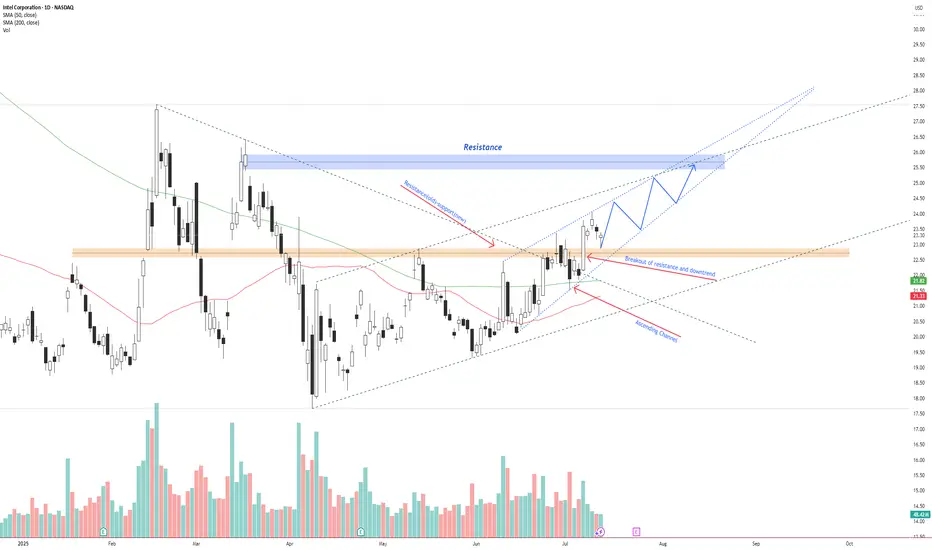
INTC – Breakout Confirmed, Bullish Continuation Inside AscendingIntel NASDAQ:INTC has broken above previous resistance and a descending trendline, confirming a bullish reversal.
Price is currently respecting an ascending channel and forming higher highs and higher lows. The breakout retest around $22.50 has held as new support.
If the current structure remains intact, price could continue toward the $26.00–$26.50 resistance zone. A breakout above this zone opens the door for a move toward $28+.
Key levels:
Support: $22.50 (previous resistance)
Resistance: $26.00–$26.50
Trend structure: Bullish channel
Volume supports the trend, and price is trading above both the 50 SMA and 200 SMA.
📌 Watching for a pullback and continuation move inside the channel.
This is not financial advice. Always do your own research.
Today's summary and tomorrow's market forecast📰 News information:
1. Focus on tomorrow's CPI data
2. Bowman's speech at the Federal Reserve
3. Tariff information outflows and countries' responses to tariff issues
📈 Technical Analysis:
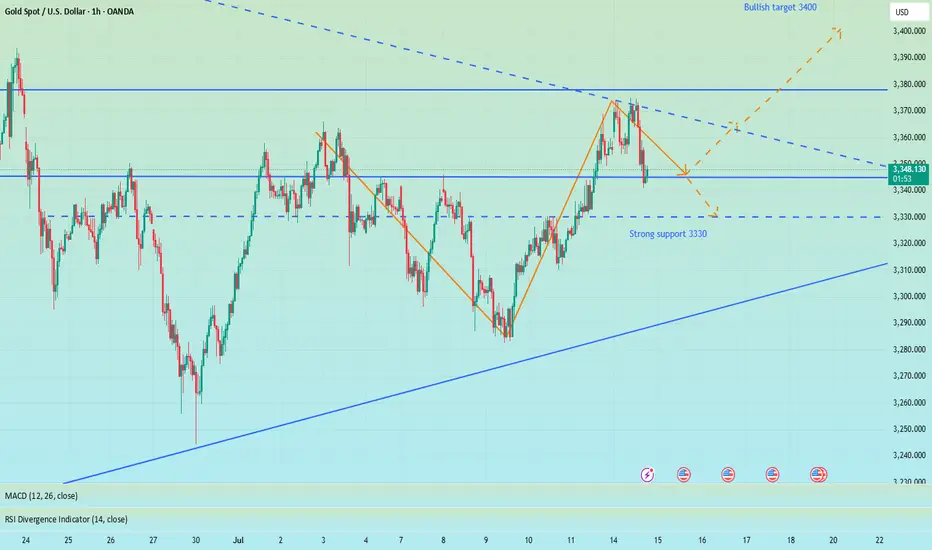
Bros, I had some things to deal with just now so I went out for a while. Now I come back to share my ideas. When the market is blindly chasing longs, I chose to give a bearish trading opportunity. I know that after I proposed the idea of shorting to test the support level of 3340-3330 below, many people were skeptical and even looked at it with a sarcastic attitude. After all, most people in the market are long. But facts and results have proved that only by following the trend can there be better room for operation. When doing transactions, you must first have a clear goal. Those who follow the crowd will often only blame their mistakes on others or luck.
Regarding the arrangements for future trading, first of all, 3375-3385 above is still an important short-term resistance. If today's closing is above 3360, then 3375 will most likely be tested again during the Asia-Europe trading session. Once it goes up again, it is very likely to break through the resistance area of 3375-3385. Before the US data, the price may stay at 3390 or 3400. On the contrary, if today's closing is below 3360, then the price still has room for adjustment. In this way, 3340 will not be the low point of this week. The bearish volatility in the Asian and European sessions will also test the strong support of 3330-3320.
In addition to investment, life also includes poetry, distant places, and Allen. Facing the market is actually facing yourself, correcting your shortcomings, facing your mistakes, and exercising strict self-discipline. I share free trading strategies and analysis ideas every day for reference by brothers. I hope my analysis can help you.
OANDA:XAUUSD PEPPERSTONE:XAUUSD FOREXCOM:XAUUSD FX:XAUUSD TVC:GOLD FXOPEN:XAUUSD
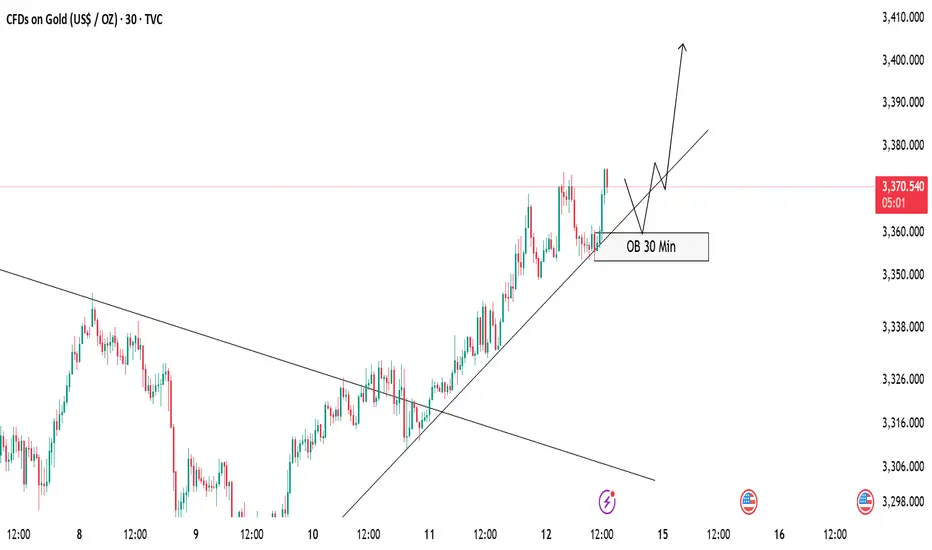
GOLD Buy Setup – OB Zone in FocusCurrently, gold is respecting the ascending trendline and maintaining a bullish structure 🟢. Price hasn’t tapped into the 30 Min Order Block (OB) yet, but we are expecting a potential pullback into this OB zone 📍.
✅ Our Plan:
We will wait patiently for price to mitigate the OB.
After the tap, we will look for bullish confirmation (rejection wick, bullish engulfing, or break of minor structure) before entering a buy position 🚀.
As long as the trendline holds, we remain bullish on gold.
📝 Invalidation:
If price breaks and closes below the trendline and OB zone, we will stay out or re-evaluate the setup ❌.
Stay disciplined and follow the plan! 💪
Gold’s Chart Update Next Move: Bullish or Bearish?Gold has shown strong bullish momentum 💪 as it breaks through the descending trendline 📉, positioning itself to target the upper liquidity zone 💰. Right now, we have two key scenarios to watch:
1️⃣ Bullish Scenario: If Gold breaks above the 3345 level and closes a solid candle above it 🔝, we could see a move towards 3360 🚀, signaling further upward potential.
2️⃣ Bearish Scenario: However, if Gold sweeps the 3345 zone and fails to maintain the bullish momentum 🔻, we may see a pullback that could push prices lower 📉.
Stay vigilant 👀 and keep an eye on price action for the next big move! 🔍📊

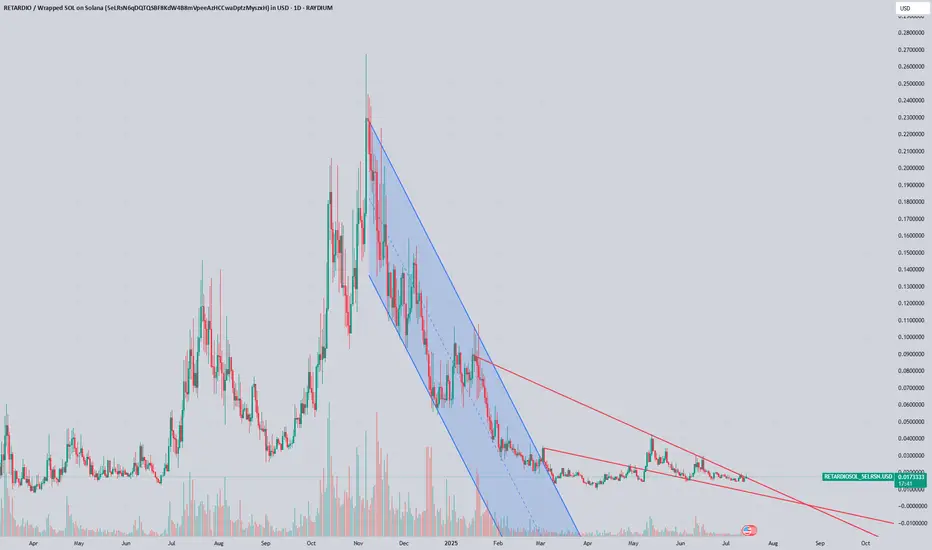
$Retardio LongI have added to my Retardio long. The entire crypto memespace is well... you get it.
No other token comes close to defining the entire space. I'll be holding this one for a long time just because of the lolz. Not advice. This is retardio.
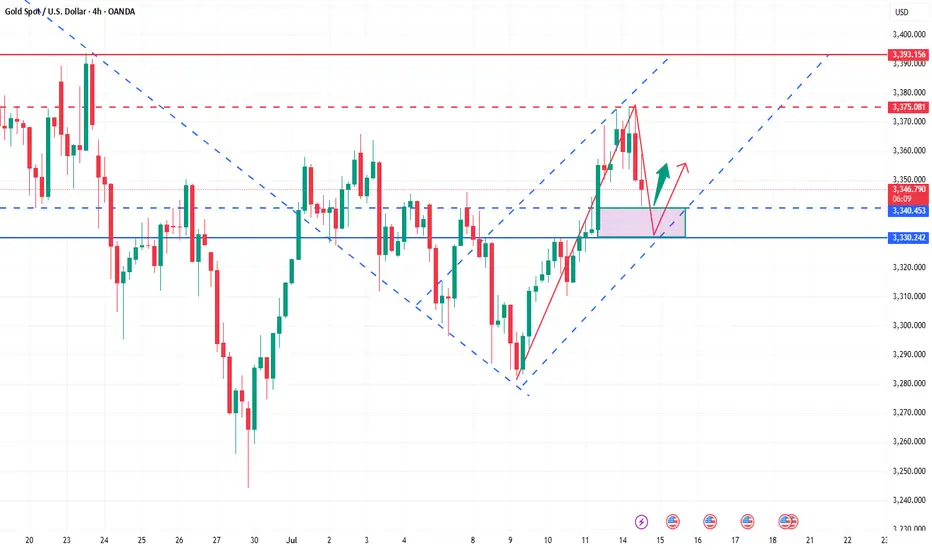
XAUUSD Weekly Trade Setup(14-18th July 2025) - Bullish StrategyIn the ever-volatile world of commodities, Gold (XAUUSD) has yet again presented a promising technical setup. For traders looking to capitalize on price action and structure-based strategies, the upcoming week (14th to 18th July 2025) offers a clean breakout and retest opportunity backed by a strong risk/reward ratio.
Let’s break down the trade plan in detail.
1. Overview of the Current Market Structure
As shown in the 4-hour chart, XAUUSD is approaching a key horizontal resistance zone around 3360–3370. Historically, this area has acted as a rejection point for buyers. However, the recent bullish momentum, supported by price trading above the 200 EMA, suggests a potential breakout.
This forms the basis of a Breakout-Retest-Continuation strategy – one of the most reliable setups in price action trading.
2. The Trade Plan
Here’s the structured plan for this setup:
🔵 Step 1: Wait for the Breakout
Price must break above the resistance zone (3360–3370) with a strong bullish candle.
Avoid chasing the breakout; instead, let the market confirm its direction.
🟠 Step 2: Look for the Retest
After the breakout, wait for the price to pull back to the broken resistance, now acting as support.
Confirm this retest with a reversal candlestick pattern (e.g., bullish engulfing or hammer) on the 1H or 4H timeframe.
🔴 Step 3: Entry and Stop Loss
Enter the trade after the confirmation candle closes.
Place a stop loss below the swing low of the retest zone.
This protects the trade in case of a false breakout.
🟢 Step 4: Set Your Target
The profit booking zone lies around the 3440–3450 region.
This setup offers a Risk/Reward Ratio of 1:4, targeting 1:2, 1:3, and potentially 1:4 if momentum continues.
3. Why This Setup Makes Sense
EMA Confirmation: Price is trading above the 200 EMA, showing bullish bias.
Clean Price Action: Well-defined structure makes it easy to identify breakout/retest levels.
Strong Risk Management: The stop is tight and logical, while the upside potential is considerable.
Psychological Support Zone: 3360–3370 has repeatedly acted as a key decision level.
4. Trade Management Tips
Trail your stop loss once 1:2 R:R is achieved.
Consider partial profit booking at 1:2 or 1:3 to lock in gains and reduce risk.
Be patient – the key to this strategy is waiting for the retest confirmation.
5. Final Thoughts
Trading XAUUSD can be both rewarding and risky. This weekly setup gives you a disciplined approach to enter the market at a high-probability point with excellent reward potential. Whether you’re a swing trader or an intraday scalper on lower timeframes, this strategy adapts well with proper confirmation.
Stay tuned for live updates, and as always – plan your trade, and trade your plan.
Happy Trading!
=================================================================
Disclosure: I am part of Trade Nation's Influencer program and receive a monthly fee for using their TradingView charts in my analysis.
=================================================================

Two lines of defense for bulls: 3340 and 3330 are the key!Gold maintains a strong pattern in the short term, and it is recommended to mainly buy on dips. The short-term support below focuses on the neckline of the hourly line at 3340 last Friday. The more critical support is locked at the 3330 line. This range is an important watershed for judging the continuation of short-term bullish momentum. As long as the daily level can remain stable above the 3330 mark, the overall trend will remain upward. Before falling below this position, we should adhere to the idea of buying low and buying low, and rely on key support levels to arrange long orders. At present, the price has completed a technical breakthrough and broke through the upper edge of the 3330 convergence triangle under the dual positive factors of Trump's tariff landing to stimulate risk aversion and the support of the Fed's interest rate cut expectations, and formed three consecutive positive daily lines. It is necessary to pay attention to the short-term pressure at the 3375 line. The overall operation strategy will be combined with the real-time trend prompts during the trading session, and pay attention to the bottom in time.
DOGEUSDMay have some time to take this large move, but at least look pretty good for long-term,
In a very large scale of indicators, they are oversold so lets wait this movement.

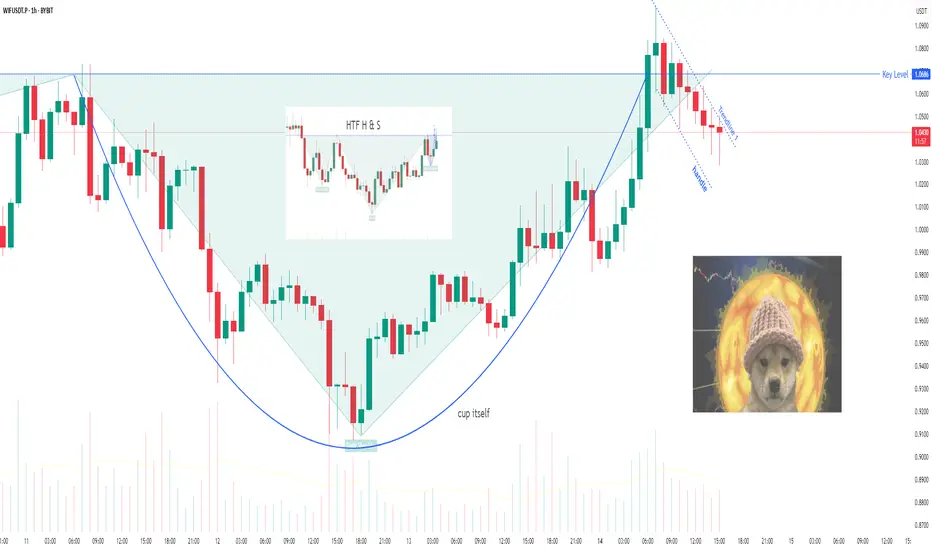
WIF/USDT: Dog back on track?WIF is building a "Cup And Handle" pattern alongside a (hopefully) last trendline, Trendline 1.
That breakout would lead back to the main keylevel, which is also the neckline of a H&S formation on a higher timeframe. To make it even more funny, that H&S is "the handle" of a even bigger cup n handle pattern on the next HTF.
So the break of trendline 1 might bring us to the keylevel, and that might start the H&S being "priced".
KURA Set for Liftoff: Breakthrough Cancer Drug, Massive Analyst Kura Oncology (KURA) is emerging from a prolonged downtrend just as its lead drug candidate, ziftomenib, approaches a critical FDA decision deadline this fall. With zeroed-in focus on targeted leukemia treatments and no approved competitors in its niche, Kura is positioned to benefit from increasing demand for precision oncology therapies and growing biotech investment.
Wall Street analysts remain highly optimistic, projecting more than 300% upside based on Kura’s strong cash position, late-stage pipeline, and potential blockbuster market for its lead asset. In a healthcare landscape where next-generation cancer treatments are both a clinical and economic priority, Kura’s story stands out as a high-reward opportunity for long-term investors.
Don’t miss our next big setup—hit follow now!

#ETHUSDT: Currently On The Way Towards Filling The FVG?ETCUSDT is currently experiencing a significant correction as the price approaches a pivotal juncture where a substantial bullish price reversal is anticipated, potentially propelling it to new all-time highs or even surpassing them. It is imperative to exercise meticulous risk management and conduct your own thorough analysis before engaging in any cryptocurrency trading or investment activities.
Should the price indeed undergo a major correction, it is likely to decline to our second designated area, where it is anticipated to fill the liquidity gap and subsequently reverse course, continuing its trajectory towards our established targets.
Please consider this analysis as a secondary influence only, or even solely for educational purposes. It is crucial to conduct your own independent analysis and risk management prior to engaging in any cryptocurrency trading or investment endeavours, as they inherently carry substantial financial risks.
We extend our best wishes and encourage you to trade safely and responsibly.
Should you wish to demonstrate your support, you are welcome to express your appreciation through likes, comments, or sharing this information.
Thank you for your consideration.
Have a pleasant weekend.
Team Setupsfx_

LINK has FINALLY Broken out of a 207D DowntrendReclaimed the .236 Fib 🔥
Volume to confirm ✅
Bullish crossover on the 20 / 50MA
It’s about time!!!
CRYPTOCAP:LINK Marines Unite 🪖

NZDUSD Pullback in Play – Head & Shoulders Signals More DownsideNZDUSD ( OANDA:NZDUSD ) is currently trading near the Resistance zone($0.612-$0.605) and has also managed to break the Support zone($0.604-$0.602) . We consider the Support zone as the neckline of the Head and Shoulders Pattern .
In terms of classic technical analysis , NZDUSD has managed to form a Head and Shoulders Pattern .
I expect NZDUSD to decline towards the Support zone($0.5968-$0.5946) after completing the pullback .
Note: Stop Loss(SL): $0.6062
Please respect each other's ideas and express them politely if you agree or disagree.
New Zealand Dollar/ U.S. Dollar Analyze (NZDUSD), 1-hour time frame.
Be sure to follow the updated ideas.
Do not forget to put a Stop loss for your positions (For every position you want to open).
Please follow your strategy and updates; this is just my Idea, and I will gladly see your ideas in this post.
Please do not forget the ✅' like '✅ button 🙏😊 & Share it with your friends; thanks, and Trade safe.

Gold Breakout and Potential RetraceHey Traders, in tomorrow's trading session we are monitoring XAUUSD for a buying opportunity around 3,340 zone, Gold was trading in a downtrend and successfully managed to break it out. Currently is in a correction phase in which it is approaching the retrace area at 3,340 support and resistance area.
Trade safe, Joe.

BTC POTENTIAL PULL BACK ????Will Bitcoin continue going higher or will it crash a bit? Its something we have to wait and see. We have to be ready and prepared for what it wants to do!!!
Here is my technical analysis, but may the Lord lead you as you trade and invest. May you allow Him to show you where to cast your nets!!! (John 21:6 KJV)

GBP/USD Bears Charge Yearly Trend Support- US / UK CPI on TapSterling broke below confluent support last week at the 61.8% retracement at of the June rally at 1.3530. The decline is now within striking distance of yearly trend support at 1.3388-1.3415- a region define by the 61.8% retracement of the May rally, the June close lows, and the 2024 high-day close. A good zone to reduce portions of short-exposure / lower protective stops IF reached. A break / close below would be needed to suggest a more significant high was registered this month / a larger reversal is underway.
Initial resistance now back at 1.3530 with a close above the 25% parallel needed to threaten resumption of the broader uptrend. Keep in mind we get the release of US / UK inflation data this week- stay nimble into the releases and watch the weekly close for guidance here.
-MB

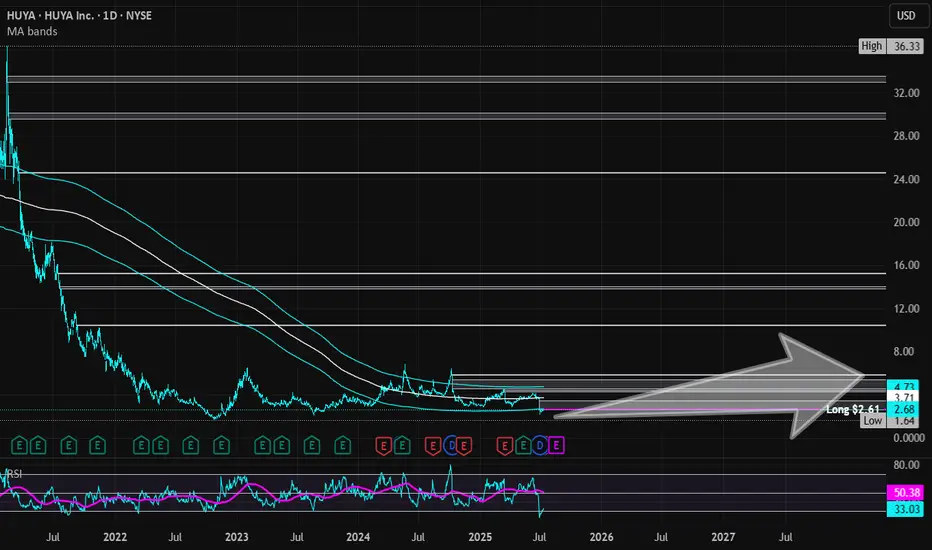
HUYA | HUYA | Long at $2.61HUYA NYSE:HUYA operates game live streaming platforms in China. This stock got my attention based on the reported fundamentals and price position, but moderate "Chinese delisting" risks exist given the US's new political administration.
Book Value = $3.23 (Undervalued)
Forward P/E = 4.1x (Growth)
Debt-to-equity = 0x (Healthy)
Quick Ratio = 1.56x (Healthy)
Altman's Z Score = <1.8 (Bankruptcy risk is relatively high)
From a technical analysis perspective, the stock price momentum has shifted upward based on the historical simple moving average. The price often consolidates within and slightly outside of this simple moving average band before progressing higher (after a long period of selling). While near term-declines are a risk, a longer-term hold (if the fundamentals do not change and delisting doesn't occur) may pay off given the value, growth, and overall health of the company.
Thus, at $2.61, NYSE:HUYA is in a personal buy zone.
Targets into 2028:
$3.45 (+32.2%)
$5.80 (+122.2%)