USDJPY: Pullback From SupportI believe that 📈USDJPY could bounce up from the highlighted intraday support.
I see 2 bullish breakout confirmations:
bullish breakouts of a neckline of a cup and handle pattern and a resistance line of a falling wedge pattern.
Goal - 144.67
Trend Lines

Sideways ChannelLooks like today we have bounced off the midpoint of this channel. Yesterday we dropped, today we rise!
Overall, this looks like a very neutral position. Potential for a short gain here up to previous highs with a bounce back down to lows.
No one can predict how long we will stay in this channel, but the breakout or breakdown will be very bold and very loud in one direction.
As a trend trader, I am looking to a breakup potential right now. If I had to be in a position, it would be long.

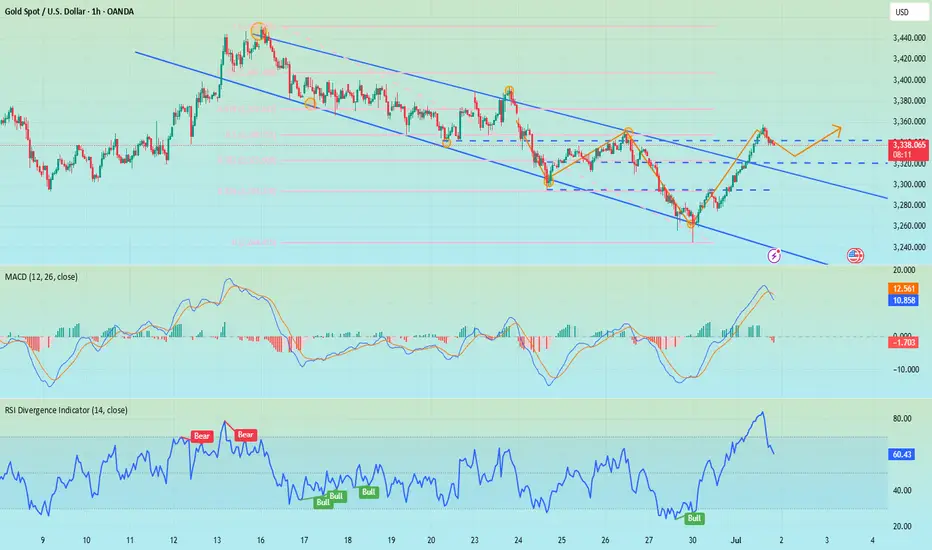
GOLD (XAUUSD): Classic Trend-Following Pattern⚠️Gold closed on Tuesday, forming a bullish flag pattern on an hourly chart, indicating a market correction following a strong upward wave.
A breakout above the resistance line with a candle close will likely signal a continuation of the trend, with a high probability of the price rising to at least a new higher high.
However, keep in mind that the price may respect the trend line multiple times and corrections could be prolonged, which is why we depend on a reliable breakout as a trigger.

BTC/USDT Technical Analysis, 2025-07-01 19:30 UTCA bullish trade opportunity was identified after price action formed a Piercing Line candlestick pattern, signaling a potential reversal from recent lows.
🔹 Technical Overview:
Entry Price: 105,869.86 USDT
Take Profit (TP): 106,939.86 USDT
Stop Loss (SL): 104,669.86 USDT
200 EMA: 106,320.49 USDT (Price is trading below — potential dip-buy opportunity)
Pattern Detected: Piercing Line (bullish reversal)
🔹 Volume Context:
Recent candles showed moderate volume with signs of buyer interest increasing.
OBV trend has turned slightly positive, supporting a short-term bullish case.
🔹 Order Flow:
Price action is showing signs of recovery from a local support zone.
Some imbalance in the order book tilted toward buyers, with supportive bid liquidity observed.
This setup combines trend deviation, bullish price action, and support reaction, creating a favorable risk-to-reward scenario. Trade is now active and being monitored toward the defined TP level, with strict stop-loss protection in place.

The idea is clear, gold falls as expected!The gold market is just as I predicted. I have repeatedly warned everyone not to chase the 3350-3355 line. The technical side needs to step back. Now, it just proves the idea I gave. After gold hit the highest line of 3358, it stepped back to the 3337 line and started to fluctuate. Our 3355 short order plan successfully touched 3340 to stop profit and exit. From the current gold trend, it should fluctuate like this before closing. After the opening, we will step back and go long as planned. Focus on the 3330-3335 line below. If it does not break, we can consider going long.
From the current gold trend analysis, pay attention to the 3360-3370 line of pressure on the top, and the short-term support on the bottom is around 3330-3335. Focus on the key support at 3315-3325. Relying on this range as a whole, maintain the main tone of low-long participation unchanged, wait for the pullback to confirm the support and then intervene when the opportunity arises. In the middle position, keep watching and do less, chase orders cautiously, and wait for the entry opportunity after the key points are in place.
Gold operation suggestion: go long around 3315-3325, target 3340-3350.

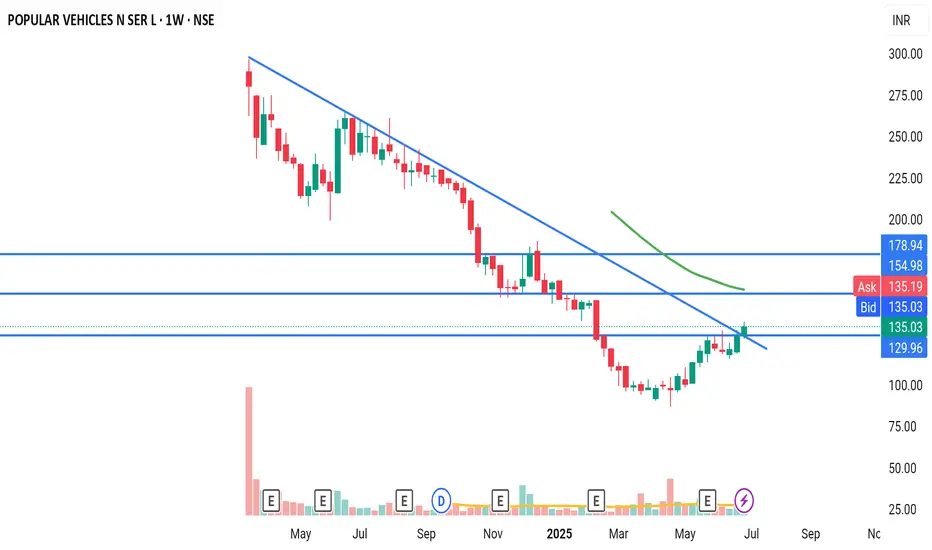
PVSLStrong upmove expected from CMP. Breakout of Cup and Handle pattern in daily timeframe, crossed trendline in daily and weekly timeframe.
PIVXUSDT Holding Key Support Within Falling WedgePIVXUSDT continues its descent within a falling wedge structure, currently stabilizing above a key support zone. Price is now poised to retest the Immediate Internal Resistance Level.
A breakout above this level could trigger a reversal, while rejection may lead to a new low toward the strong accumulation zone a potential high-probability buy area. Targets toward the projected final upside are highlighted on the chart.
Monitor closely for confirmation at the resistance level to define the next move recommended.

Trading The 3 Step Rocket Booster StrategyTrading within a certain time frame has shown me that its better to set a time stop limit.
This time stop limit tells you when to stop trading your entry.
-
Now does this work? am not sure but i will try anything
that will produce results.
-
Right now am focusing on short term trading strategies.The main aim is to enter on 4 hour time frames.
-
Am hoping that this will increase my trading skills.Either way my focuss is on learning how to trade better setups.
-
Key Point:Dont stop journal-ling your trades on trading-view community.
-
Now on this entry am looking at a rising volume from the bottom of the market.
-
Also we are looking at the rocket booster strategy:
-
It has the following steps:
-
-The price has to be above the 50 EMA
-The price has to be above the 200 EMA
-The price has to gap up.
-
This strategy has become so popular its shocking.Because when i began teaching...
-
it it was not as popular.
-
I call it the 3-Step Rocket Booster Strategy
If you want to learn more about how to find
stocks such as NYSE:KO
-
Rocket boost this content to learn more.
-
Disclaimer:Trading is risky please learn risk management and profit taking strategies.Also do not use margin trading.And use a simulation trading account before you trade with real money.

US30 Sell analysis/ideaThis analysis is based on multiple timeframes and executed using reversal trading and trend formation. complete explanation in the video!

Gold may collapse again, don't get buried in it!In the past two trading days, gold began to rebound from a low of around 3245, and has now rebounded to around 3358, with a rebound of up to $113. Moreover, there has been no significant retracement during this rebound, indicating that gold has little intention to fall, and may even continue to rise.
But for me, gold rebounded from 3245. Even if a double bottom structure with 3275 as the secondary low was constructed on the technical level, it should not be enough for gold to rebound more than $113 in just two days as it fell below many supports in the early stage and bullish confidence suffered a serious blow. Moreover, it happened before the uncertain news of the NFP market.
So I have to consider that the market did it deliberately, and its primary purpose was to kill a large number of short chips in the market and lure more attracted long chips; secondly, the sharp rise before the NFP market may be to reserve room for the NFP market to fall in advance; in addition, I have to consider that the US dollar has fallen to a three-year low. If it continues to fall, there may be a global crisis of confidence in the US dollar, and the oversold rebound demand for the US dollar will also suppress gold.
Therefore, I still will not advocate chasing the rise of gold for the time being; on the contrary, I will actively seek opportunities to short gold in the 3350-3370 area; and once gold turns to a downward trend again, it may at least test the 3325-3315-3305 area downward in the short term.

B&G Foods | BGS | Long at $4.45B&G Foods NYSE:BGS , owner of over 50 food brands including Green Giant, Ortega, Cream of Wheat, Mrs. Dash, and Crisco, has dropped nearly 92% in price since its high in 2021. Currently trading at $4.43 and with a book value of $6.43, NYSE:BGS may have some running room in the next 1-2 years for a forward P/E of 10x (currently negative, so there is anticipated growth, though small). This is another company that would greatly benefit from lowered interest rates due to its high debt-to-equity (4x).
So, while debt and consumer spending declines may pose a threat to NYSE:BGS , I believe it is currently undervalued. If the stock drops due to poor earnings (which could drop to under $2.00), I will be entering another position unless fundamental / outlook truly change.
Thus, at $4.45, NYSE:BGS is in a personal buy zone.
Targets into 2027:
$5.25
$6.25

AUDUSD InsightHello to all our subscribers,
Please feel free to share your personal opinions in the comments. Don't forget to like and subscribe.
Key Points
- According to the U.S. Department of Labor’s Job Openings and Labor Turnover Survey (JOLTS), job openings in May increased by 374,000 from the previous month to 7.769 million, significantly exceeding market expectations of 7.3 million.
- U.S. President Trump has indicated that he has no intention of further extending the reciprocal tariff exemption set to expire on the 9th, warning that tariffs of 30% to 35% could be imposed on Japan.
- Trump's tax cut proposal has dramatically passed the Senate and is now awaiting passage in the House. President Trump aims to sign the bill into law before July 4th.
- Australia's May CPI rose 2.1% year-on-year, falling short of market expectations. Some analysts now expect the Reserve Bank of Australia (RBA) to cut interest rates in July.
Key Economic Events This Week
+ July 2: U.S. June ADP Non-Farm Employment Change
+ July 3: U.S. June Non-Farm Payrolls, U.S. June Unemployment Rate
AUDUSD Chart Analysis
The pair has been steadily rising and recently reached the 0.66000 level. In the longer term, a rise toward the 0.69000 level seems likely. However, expectations of a rate cut by the Reserve Bank of Australia have introduced new uncertainty. There is also minor resistance near the 0.67000 level, which could lead to a potential reversal if market conditions align. While maintaining a bullish outlook, we will closely monitor the price action around the 0.67000 level.


I hold on to my short position and wait patiently.Currently, gold continues to rebound to around 3358, and there has been no decent retracement during the rebound, so during the trading period, apart from chasing the rise, there are almost no opportunities to go long on gold; so is the steady rise in gold during the day brewing a bigger rally?
I think there are three reasons for the continued rise of gold:
1. The continued weakness of the US dollar provides support for the strong rise of gold;
2. The trapped long chips have recently shown self-rescue behavior, and strong buying funds have driven gold up;
3. The market intends to eliminate and kill a large number of shorts in recent times;
Based on the above reasons, I think it is not a wise decision to chase gold at present; on the contrary, I still prefer to short gold in the short term, and I still hold a short position now; the following are the reasons to support my insistence on shorting gold:
1. The US dollar has a technical rebound demand after a sharp drop, which will limit the rebound space of gold and suppress gold;
2. After the recent trapped long chips successfully rescue themselves, they may cash out in large quantities, thereby stimulating gold to fall again;
3. While killing the shorts, the market has also lured a large number of long funds to a certain extent. Based on the above reasons, I currently still hold short positions near 3345 and 3355, and hope that gold can retreat to the 3335-3325 area.

Gold is in the Bearish DirectionHello Traders
In This Chart GOLD HOURLY Forex Forecast By FOREX PLANET
today Gold analysis 👆
🟢This Chart includes_ (GOLD market update)
🟢What is The Next Opportunity on GOLD Market
🟢how to Enter to the Valid Entry With Assurance Profit
This CHART is For Trader's that Want to Improve Their Technical Analysis Skills and Their Trading By Understanding How To Analyze The Market Using Multiple Timeframes and Understanding The Bigger Picture on the Charts

Short gold, it may retreat again after reaching 3340-3350Although the rebound in gold has exceeded my expectations to a certain extent, it is obviously not a good time to chase the rise in gold. The gold rebound mainly benefits from Trump's repeated requests for the Federal Reserve to cut interest rates, which has led to the continued weakness of the US dollar. In fact, we can clearly see that the gold rebound is not supported by trading volume, and the rebound without volume may face the risk of collapse again at any time. So I don't advocate chasing long gold at present.
Currently, gold has rebounded to around 3339, almost recovering most of the losses in the previous downward wave (the starting point of the previous wave was 3350), but gold is still under pressure in the 3340-3350-3355 area. In the absence of volume support, gold may fall again after touching this resistance area.
Therefore, shorting gold is still the first choice for short-term trading at present; at least make sure not to chase high!
You can consider shorting gold with the 3340-3350-3355 area as resistance, and look at the target: 3320-3310-3300

PLTR: Decoding the Current PullbackPLTR: Decoding the Current Pullback
Current Price Action & Trend:
The asset has experienced a significant uptrend from its late March low of approximately 65.88 (marked as 1 on the Fibonacci tool) up to a peak of 148.44 (marked as 0) in early July. Currently, the price is undergoing a pullback from this recent high, trading around 129. An ascending trendline or channel acts as dynamic support on several occasions during the uptrend.
Key Support Levels & Zones:
"Ideal Area 120" & Ascending Trendline Confluence:
For PLTR an "Ideal Area is 120." This zone is notable as it aligns directly with the ascending blue trendline. This area is served as a point of interest or consolidation during the uptrend, suggesting it could act as a significant support level upon a pullback.
Fibonacci Retracement Levels:
A Fibonacci Retracement tool has been applied from the swing low (65.88) to the swing high (148.44) of the preceding impulse wave.
The 0.5 Fibonacci retracement level is identified at 107.16. This level often acts as a significant support or resistance point.
The 0.618 Fibonacci retracement level, commonly referred to as the "Golden Ratio," is located at 97.42. This level coincides with a broader orange horizontal zone labeled "Fib Golden zone & Strong Level 100." This confluence suggests a particularly strong area of potential support around the psychological 100-mark, bolstered by the Fibonacci ratio. The yellow ellipses indicate prior interactions with this broader zone.
Potential Scenarios (Illustrated by Dotted Lines):
Scenario 1 (Shorter Retracement): This path suggests a potential bounce from the "Ideal Area 120" and the ascending blue trendline, leading to a resumption of the upward movement towards previous highs (148.44) and potentially beyond.
Scenario 2 (Deeper Retracement): This path illustrates a possible deeper pullback, indicating that if the "Ideal Area 120" does not hold, the price might seek support at the "Fib Golden zone & Strong Level 100" (0.618 Fib level around 97.42) before a potential reversal and continuation of the broader uptrend.
Conclusion:
The current price action is undergoing a correction within a defined uptrend. Technical levels, including dynamic trendline support and static Fibonacci retracement zones, are presented as key areas for observation, offering insights into potential points of interest for future price reactions.
Disclaimer:
The information provided in this chart is for educational and informational purposes only and should not be considered as investment advice. Trading and investing involve substantial risk and are not suitable for every investor. You should carefully consider your financial situation and consult with a financial advisor before making any investment decisions. The creator of this chart does not guarantee any specific outcome or profit and is not responsible for any losses incurred as a result of using this information. Past performance is not indicative of future results. Use this information at your own risk. This chart has been created for my own improvement in Trading and Investment Analysis. Please do your own analysis before any investments.

Gold retreats as expected, how to trade in the future📰 News information:
1. Geopolitical situation
2. PMI data
3. Global Central Bank Governors Meeting
📈 Technical Analysis:
Our short orders have achieved profits. I closed the position near 3337, turning losses into profits. Interested friends can follow my previous post. In the short term, I am still optimistic that gold will retreat below 3335-3325. Today, gold rose sharply, and the rebound momentum was strong, while the short-term correction was slightly weak, so the space for a second decline in the short term will be limited. If it falls to the 3333-3323 range during the day and gets effective support, you can consider going long. The short-term upper resistance is 3360-3375.
🎯 Trading Points:
BUY 3333-3323-3315
TP 3341-3355-3360-3375
In addition to investment, life also includes poetry, distant places, and Allen. Facing the market is actually facing yourself, correcting your shortcomings, confronting your mistakes, and strictly disciplining yourself. I hope my analysis can help you🌐.
TVC:GOLD OANDA:XAUUSD FX:XAUUSD FOREXCOM:XAUUSD PEPPERSTONE:XAUUSD FXOPEN:XAUUSD
Valero Breaks the DowntrendValero Energy spent more than a year in a downtrend, but some traders may think conditions have changed.
The first pattern on today’s chart is the series of lower highs between April 2024 and May 2025. VLO pushed above that falling trendline last month and has remained there since. That may suggest its longer-term direction is turning higher.
Second is the price area between roughly $132 and $136. The oil refiner peaked there in March, April and May. But it made a low in the same zone last week and this week. Is old resistance becoming new support?
Third, prices have remained above the rising 21-day exponential moving average. They’re also above the 200-day simple moving average. Those patterns may be consistent with emerging bullishness in the short and long terms.
Check out TradingView's The Leap competition sponsored by TradeStation.
TradeStation has, for decades, advanced the trading industry, providing access to stocks, options and futures. If you're born to trade, we could be for you. See our Overview for more.
Past performance, whether actual or indicated by historical tests of strategies, is no guarantee of future performance or success. There is a possibility that you may sustain a loss equal to or greater than your entire investment regardless of which asset class you trade (equities, options or futures); therefore, you should not invest or risk money that you cannot afford to lose. Online trading is not suitable for all investors. View the document titled Characteristics and Risks of Standardized Options at www.TradeStation.com . Before trading any asset class, customers must read the relevant risk disclosure statements on www.TradeStation.com . System access and trade placement and execution may be delayed or fail due to market volatility and volume, quote delays, system and software errors, Internet traffic, outages and other factors.
Securities and futures trading is offered to self-directed customers by TradeStation Securities, Inc., a broker-dealer registered with the Securities and Exchange Commission and a futures commission merchant licensed with the Commodity Futures Trading Commission). TradeStation Securities is a member of the Financial Industry Regulatory Authority, the National Futures Association, and a number of exchanges.
TradeStation Securities, Inc. and TradeStation Technologies, Inc. are each wholly owned subsidiaries of TradeStation Group, Inc., both operating, and providing products and services, under the TradeStation brand and trademark. When applying for, or purchasing, accounts, subscriptions, products and services, it is important that you know which company you will be dealing with. Visit www.TradeStation.com for further important information explaining what this means.

XAUUSD BUY OPPORTUNITY!!Price just provided us with a buy opportunity as we saw a recent increase in buy momentum. A buy opportunity is envisaged from the current market price. Target profit is 3358.71

Gold Breakout and Potential RetraceHey Traders, in today's trading session we are monitoring XAUUSD for a buying opportunity around 3,330 zone, Gold was trading in a downtrend and successfully managed to break it out. Currently is in a correction phase in which it is approaching the retrace area at 3,330 support and resistance area.
Trade safe, Joe.

EURUSD Potential UpsidesHey Traders, in today's trading session we are monitoring EURUSD for a buying opportunity around 1.17600 zone, EURUSD is trading in an uptrend and currently is in a correction phase in which it is approaching the trend at 1.17600 support and resistance area.
Trade safe, Joe.

The Big Beautiful RXTWith the bill passing and TA indicators popping up. I see these long term channels starting to break and the entire price action start to flip to the other side.
Watch the break and retest, especially if we see a spike in volume soon.
Really hard to lose long term with this one.
