$AAPL Long SwingNASDAQ:AAPL just recently had earnings and released the new VR-headset, Apple Vision Pro.
I'm looking at swinging calls for NASDAQ:AAPL next week because the Jeanius Algo Suite (Indicator/Screener) gave me multiple buy confluences:
Fell through 2 untested lows (~$180.17), grabbing liquidity
Partially filled a Fair Value Gap
Tested an uptrend line formed on the monthly timeframe
In a long term and short term structural uptrend
The indicator shows "Combo" signals every time this combination of signals happened in the past. It also automatically painted the lines/zones
Trendlineanalysis

A Positive Divergent Signal!The candlestick pattern indicates a positive divergence since the stock is in the accumulation stage before proceeding to an uptrend movement. The upper limit triangle-like shape indicates price resistance when prices move up the result of the price action should increase in volume.
The MACD and RSI indicators confirm the candlestick pattern which indicates a divergence signal.
Let's save TTVHB in WL and watch out for significant price movement with an increase in volume above the MA20 line.
R 0.840
S 0.695

AMD Weekly Technical AnalysisAMD Weekly - No RECOMMENDATION or ADVICE Status / EDUCATIONAL only - Support, Resistance, Trend Lines, Confluence, Cluster, Parallel Channels, Modify Schiff Pitchfork, Fibonacci Extension - Hope it Helps, Good Luck
DISCLAIMER - This communication is not trading or investment advice, recommendation or solicitation to buy, sell or hold any investment product is provided for informational, educational and research purposes only. All illustrations, forecasts or hypothetical data are for illustrative purposes only. The author or persons involved in the conception, production and distribution of this material cannot be held responsible for transactions or any financial loss or damages resulting directly or indirectly from the use or application of any concepts or information contained in or derived from this material. Past performance is not indicative of future results. Any person who chooses to use this information as a basis for their trading assumes all the liability and risk for themselves.

Alphabet - Wait For The RetestHello Traders, welcome to today's analysis of Alphabet.
--------
Explanation of my video analysis:
Back in 2012 Alphabet created a beautiful triangle formation and after we saw the breakout Alphabet pumped more than +750% towards the upside. At the moment Alphabet is creating a solid resistance area at the $150 level. If we get a retest of the bullish trendline which I mentioned in the analysis, I am looking for longs and eventually new all time highs.
--------
I will only take a trade if all the rules of my strategy are satisfied.
Let me know in the comment section below if you have any questions.
Keep your long term vision.

NVIDIA Weekly Technical AnalysisNVDA weekly - No RECOMMENDATION or ADVICE Status / EDUCATIONAL only - Support, Resistance, Trend Lines, Confluence, Cluster, Channel, Pitchfork, Rectangle, Fibonacci Extension - Hope it Helps, Good Luck
DISCLAIMER - This communication is not trading or investment advice, recommendation or solicitation to buy, sell or hold any investment product is provided for informational, educational and research purposes only. All illustrations, forecasts or hypothetical data are for illustrative purposes only. The author or persons involved in the conception, production and distribution of this material cannot be held responsible for transactions or any financial loss or damages resulting directly or indirectly from the use or application of any concepts or information contained in or derived from this material. Past performance is not indicative of future results. Any person who chooses to use this information as a basis for their trading assumes all the liability and risk for themselves.

MANTA 5% BULLISH pump probability!When taking a look at MANTA. it is currently respecting all levels to the upside and is now retesting a local support after the trendline breakout.
This is bullish price action and suggest a higher move is likely in the next 24 hours. The previous high is 5% away and that would be a nice target from these levels.
Calculate Your Risk/Reward so you don't lose more than 1% of your account per trade.
Every day the charts provide new information. You have to adjust or get REKT.
Love it or hate it, hit that thumbs up and share your thoughts below!
This is not financial advice. This is for educational purposes only.

Mastering Trend Analysis in Crypto Trading: Tutorial !Unveiling the Art of Trend Analysis in Bitcoin Trading
Welcome to a comprehensive guide that will empower you with the skills to master trend analysis in Bitcoin trading. In this extensive tutorial, we'll explore every nuance of identifying trendlines, understanding structural points, and navigating the complexities of different market scenarios. Illustrated with practical examples and annotated charts, you'll gain insights into distinguishing between ranging markets and trending channels, and how significant breakouts and confirmations signal trend changes.
Deciphering Trendlines and Structural Points
1.1 Defining Trendlines:
Delve into the essence of trendlines and their crucial role in technical analysis.
Understand the significance of structural points: higher lows, higher highs, lower highs, and lower lows.
1.2 Identifying Trends in Bitcoin:
Analyze Bitcoin price charts to identify structural points that signify the emergence of upward or downward trends.
Explore examples of higher highs and higher lows in bullish trends and lower highs and lower lows in bearish trends.
Ranging Markets - When Trading Takes a Pause
2.1 Recognizing Ranging Conditions:
Differentiate between trending and ranging markets, highlighting the characteristics of sideways price action.
Emphasize the challenges and importance of patience during range-bound periods.
2.2 Analyzing Range-Bound Bitcoin:
Illustrate Bitcoin charts during ranging conditions, showcasing the absence of defined higher highs or lower lows.
Discuss strategies for navigating range-bound markets and waiting for clear trend signals.
Section 3: Trading Channels - Dynamic Play of Bulls and Bears
3.1 Understanding Channel Dynamics:
Introduce channels as a distinct form of trending, encompassing upward (ascending) and downward (descending) trends.
Explore how channels create dynamic opportunities for traders.
3.2 Decoding Channel Breakouts:
Explore Bitcoin charts in ascending and descending channels, emphasizing the significance of breakout points.
Discuss how trend changes are confirmed only after a sustained breakout and closure beyond a trendline.
Section 4: Putting Knowledge into Action - Real-Life Examples
4.1 Example 1: Trading Higher Highs in a Bullish Trend:
Dive into a specific Bitcoin chart showcasing a clear upward trend with higher highs and higher lows.
Discuss potential trading strategies aligned with the bullish trend structure.
4.2 Example 2: Navigating Lower Lows in a Bearish Downtrend:
Analyze a bearish trend scenario with lower highs and lower lows, emphasizing risk management strategies.
Discuss the psychological aspects of trading during downtrends.
4.3 Example 3: Channel Trading and Spotting Breakouts:
Examine a Bitcoin chart illustrating a channel, showcasing the dynamics of trading within the channel.
Discuss breakout scenarios and how to discern a genuine trend reversal.
Conclusion: Mastering the Art and Science of Bitcoin Trend Analysis
As you conclude this comprehensive journey through Bitcoin trend analysis, remember that expertise in this domain is a continual process. Regularly reassess your technical skills, stay attuned to market dynamics, and apply these principles with flexibility. Whether you're navigating ranging markets or identifying breakout points within channels, understanding trendlines is your compass in the vast landscape of cryptocurrency trading.
💡 Building a Solid Foundation | 📈 Trendlines Unveiled | 🔄 Navigating Ranges | 🚀 Channel Breakouts Decoded
💬 Join the conversation: Share your experiences in trend analysis, ask questions, and connect with a community dedicated to honing their Bitcoin trading skills. 🌐✨

IDFC First BankPut this Bank's Swing Trade in your Watchlist Guys!
It's Price has a Significant potential to Hit Century again ;)

Advanced Trendline Trading TechniquesCheck out these advanced trendline trading techniques for NZDJPY.
If you're seeking a counter-trend trading opportunity, watch out for a Magic Candle Confirmation (MCC) on the Bearish Trendline.
This will signal an entry point for a short trade.
Once the pair touches the next trendline, consider shifting your stop to entry and decide whether it's a satisfactory point to exit the trade.
What's your trade plan for NZDJPY? Share your thoughts!

Bajaj Finance - Next move?Bajaj Finance is a company of the prestigious Bajaj group and it currently trading at a PE value of 33.7 which is way below its Median PE of 46.9. It has a good profit growth of 35.8% CAGR over the last 5 years and it has increased its profits by approximately 11 times in the last 7 years. The stock should be held till around next March for good returns.
This analysis is just for educational purpose.
Please do your own retrospective study before investing.

Bitcoin analysisThere are two scenarios for Bitcoin in the short term :
1 - Bitcoin can start a downward movement from 47k area to the bottom of the descending channel which is around 38k-39k
2 - or stabilize its position above 47100 and move towards the top of the ascending channel which is around 50k
The most important area is 45600 which is the midline of the ascending channel if bitcoin can stabilize below the midline first scenario will be reachable

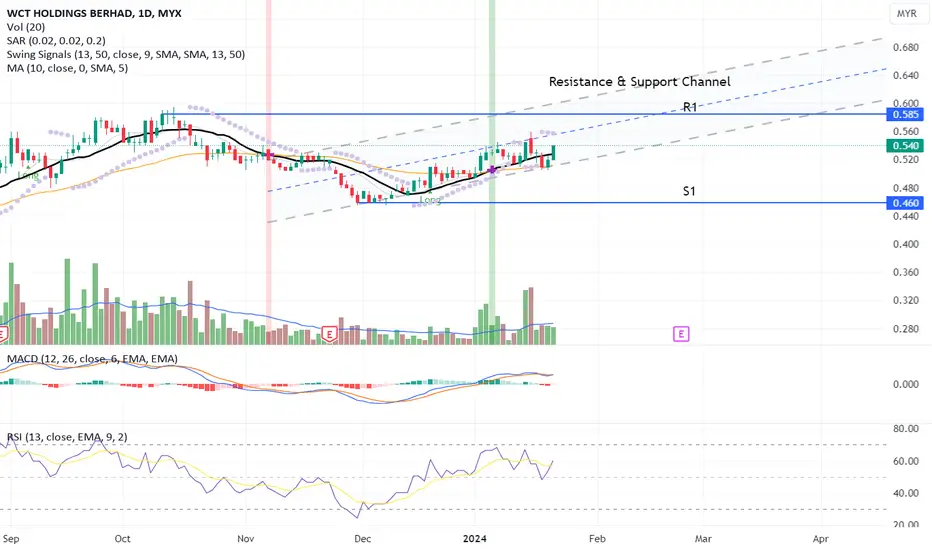
Consistent Uptrend Momentum!The candlestick indicates a price fluctuating between consistent highs and lows as indicated by the resistance and support channel whereas the channel benefits as a guideline to predict price peaks and troughs. The price is within the lower channel and provides a buying opportunity.
From the previous trades, there was no significant result in volume. Where the volume hasn't yet crossed above the MA line although price action is in place.
MACD and RSI indicate a divergence signal that is aligned with the candlestick uptrend toward the next price resistance.
Let's save WCT in WL and watch out for price action with result in volume crossed above the MA line.
R 0.585
S 0.460
Long BRFSBRF S.A. (NYSE: BRFS), a prominent company in the food production sector , has shown some interesting developments and financial activities recently. Here's a summary of what's going on with BRF S.A.:
1. Stock Performance and Financials: As of January 19, 2024, BRF SA's stock closed at 2.65 USD, which is 14.10% below its 52-week high of 3.09 USD, set on November 29, 2023. The 52-week range of the stock has been between 1.06 USD and 3.09 USD. The company's market capitalization stands at 4.44 billion USD
2. Recent Stock Movements: The company has experienced some fluctuations in its stock price. For instance, on January 17, 2024, the stock price moved over -2.29% to 2.56 USD, and on January 19, 2024, it rose above the 15-day moving average to 2.63 USD
3. Earnings and Revenue: In one of its recent financial reports, BRF S.A. reported GAAP EPS (Earnings Per Share) of -R$1.58 with a revenue of R$12.04B. However, specific details about the latest quarter's earnings weren't available in the sources reviewed
4. Analyst Perspectives: There have been mixed opinions from analysts regarding BRF S.A.'s stock. Some have pointed out the company's significant potential in the food sector, while others have shown concerns related to market volatility and other challenges.
5. Industry Trends: BRF S.A. operates in a dynamic sector where factors like consumer demand, global meat market trends, and food industry developments play a crucial role in shaping the company's performance.

SILVER FUTURES Daily Technical AnalysisSI1! Daily - No RECOMMENDATION or ADVICE Status / EDUCATIONAL only - Support, Resistance, Trend Lines, Cluster, Confluence, Rectangles, Pitchfork, Modified Schiff Pitchfork, Fibonacci Extension - Hope it Helps, Good Luck
DISCLAIMER - This communication is not trading or investment advice, recommendation or solicitation to buy, sell or hold any investment product is provided for informational, educational and research purposes only. All illustrations, forecasts or hypothetical data are for illustrative purposes only. The author or persons involved in the conception, production and distribution of this material cannot be held responsible for transactions or any financial loss or damages resulting directly or indirectly from the use or application of any concepts or information contained in or derived from this material. Past performance is not indicative of future results. Any person who chooses to use this information as a basis for their trading assumes all the liability and risk for themselves.

Anticipate Imminent Price Dip in BTC 1n 2024 B4 the real pumpI maintain a bearish outlook on both Bitcoin and altcoins. After returning to the $44k range, it appears poised to decline to the $40k to $38k range. I've been anticipating the end of the bull run for a while now, and my stance remains unchanged. Between now and February to April, a retest of the $35k range seems probable. Depending on selling pressure, the two months preceding and following the halving could lead to a dump, presenting an opportunity to buy at a lower price. If selling volume increases, hitting $38k is likely. We anticipate revisiting the $40k support level, with the potential to dip down to $38k. For those holding short positions, patience is key. Stay vigilant and avoid being lured by rumors about BTC ETF approval; it could be a setup to trap latecomers to the boom.

Alphabet - Watch The All Time HighHello Traders, welcome to today's analysis of Alphabet.
--------
Explanation of my video analysis:
In 2011 Alphabet stock broke out of a beautiful triangle continuation pattern and created a rally of more than +800%. This pump was followed by a retracement all the way back to the support trendline of 2011. Alphabet is currently creating a triangle formation and if we see a pullback to the uptrendline which I mentioned in the video analysis, I am looking for potential long setups.
--------
I will only take a trade if all the rules of my strategy are satisfied.
Let me know in the comment section below if you have any questions.
Keep your long term vision.

INTEL Daily Technical AnalysisINTC Daily - No RECOMMENDATION or ADVICE Status / EDUCATIONAL only - Support, Resistance, Trend Lines, Cluster, Confluence, Pitchfork, Fibonacci Retracement, Gap - Hope it Helps, Good Luck
DISCLAIMER - This communication is not trading or investment advice, recommendation or solicitation to buy, sell or hold any investment product is provided for informational, educational and research purposes only. All illustrations, forecasts or hypothetical data are for illustrative purposes only. The author or persons involved in the conception, production and distribution of this material cannot be held responsible for transactions or any financial loss or damages resulting directly or indirectly from the use or application of any concepts or information contained in or derived from this material. Past performance is not indicative of future results. Any person who chooses to use this information as a basis for their trading assumes all the liability and risk for themselves.

Trend Trading Strategy - Trend Continuation Master the Market Rhythm: Trend Continuation Strategy with Fibonacci Precision
Ready to ride the market waves with confidence? This video unlocks the secrets of a powerful trend continuation strategy, designed to capture momentum and maximize gains.
Here's what you'll discover:
* Identifying the Trend: Learn to spot bullish (higher highs, higher lows) and bearish (lower highs, lower lows) trends like a seasoned pro.
* Support & Resistance: Leverage key price levels where the market reverses, creating exploitable entry points.
* Timeframe Harmony: Start from the bigger picture and zoom in, pinpointing the ideal entry zone on lower timeframes.
* Fibonacci: Harness the power of the 61.8% retracement to identify high-probability trade zones within the trend's ebb and flow.

I'm Bullish. Here's WhyHi Traders,
PLTR is oversold on the 2HR, 4HR, and daily charts and has nearly completed a corrective wave. This corrective wave is denoted by the yellow ABC pattern (also known as a Zig Zag pattern) in Elliot Wave analysis. The Wave Trend indicator is extremely oversold since the signal is far below the green boundary as shown on the chart. I anticipate PLTR will close the small gap around the $14.96-$15.94 area, which is also a BULLISH demand zone and a trend support zone. I've decided to use this area as an entry zone. Once price is in this area, consider a bullish position targeting $17. If PLTR closes above $17, target $18.64 based on harmonic pattern analysis, which currently indicates a bullish Gartley. Here's my bullish case, strictly using Technical Analysis:
Harmonics
PLTR is showing three bullish harmonic patterns (Gartley, Black Swan, and Anti-Nen Star). I'd like to focus on the gartley pattern, which statistically has a 75% likelihood in reaching T1 ($18.66). In the chart below, you can also see the oversold RSI at a value of 28.74
Price Action
There is a bearish order block around the $14.75 as denoted in the chart below. Bearish traders sold PLTR back in NOV 23, but PLTR didn't decline further in price. Instead, it gapped up, which indicates Bearish traders exhausted their selling power and will likely be eager to close their positions by buying PLTR at this price point, thereby constituting a bullish demand zone.
Trends
Trend resistance is $16.98 with trend support at $14.40 as denoted by the trend lines on the chart below. The 200 period moving average (yellow line) is $14.80, which coincides with trend line support, gap analysis, and price action order blocks. I consider this strong support for now. The 9 period (purple line) 21 period (blue line) moving averages act as resistance (for now) and are $16.74 and $17.31 respectively. Both coincide with trend resistance at $16.98. The chart also shows positive divergence on the VMMACD and MACD indicators.
Trading Plan
I trade options, and while I do own several hundred shares of PLTR, I generate income by selling CALL and PUT options based on the volatility (i.e. price swings) of PLTR. Since I anticipate PLTR is nearing a LOW, I will likely sell several $14 or $15 PUTs option with a 45 DTE (Date Till Expiration) to collect premium. When PLTR reaches my upside targets, I will sell COVERED CALL options (maybe $18 or $19 strikes) to collect premium, because I know that these upside targets act as supply zones (i.e resistance) and price may decline from these areas.
Happy Trading!

The Bullish Case for TESLAOne of the biggest misconception on Tesla is that it is just an Electric Vehicle Company but that is not the case. Tesla is also a Robotics, AI and energy company. If you look at it from that lens, TESLA is undervalued and has a great future!!
TESLA recently bounced off the $212 Support level and believe this is the start of a bullish trend. Targeting the $300 Price point and we may even see $300 by the end of 2024.
For context Elon recently tweeted this on TESLA
"I am uncomfortable growing Tesla to be a leader in AI & robotics without having ~25% voting control. Enough to be influential, but not so much that I can't be overturned.
Unless that is the case, I would prefer to build products outside of Tesla. You don't seem to understand that Tesla is not one startup, but a dozen. Simply look at the delta between what Tesla does and GM. As far as stock ownership itself being enough motivation, fidelity, and other similar stakes to me, why don't they show up for work?"
In this tweet, Elon Musk expresses his desire for greater control over Tesla's direction as the company expands into AI and robotics. He believes that his current 13% stake in the company is not enough to make significant decisions in these areas.
Tesla has a great future and as long as Elon is the captain, this ship will continue to go to mars and beyond. cheers

XAU/USD Short-Term AnalysisHello friends.
Hope yore well.
Lets take a quick look at Gold :
1.we approch a mid-term valid trendline and it can be considered as a pullback to this line.
2.as you can see price bounce from this trendline with a strong engulf candlestick.
3.a short-term trendline breaks too and we saw a pullback to it as well
4.Also we can see a Bullish Divergence in oversold area
5.2030 Support level have seen with overlap with this signs
so gold will rise to the upper band of the longterm Trading range which is about 2060.
Hope this is useful for you.
Have great times.
thanks for reading

EURUSD ExpectationHello traders,
EURUSD has been inside a range since the beginning of the year. It's important to consider a few things:
- The overall structure is bullish.
- Price already took buyers and sellers by liquidating both directions.
- There is also a bigger M15 range that price is respecting.
My expectation is that price will at least mitigate the H4 supply (red zone) even if it wants to continue down. Why? Sellers from Friday are still intact after that impulsive move and they were definitely induced into the market. When/if price mitigates that H4 supply zone, it will have to make a decision. It will either continue higher and follow the Daily structure (I'll be looking for that), or it will start a pullback in order to take out the current buyers.
Slow start of the year for currency traders, nothing out of the norm, we just have to be patient :)
Good trading!

METISUSDTHello dear friends
This is one of the cryptocurrencies that I definitely consider for spot purchases (:
As long as the upward trend line is maintained and the resistance range of $101.75 is consumed, the upward trend can be expected to continue.
What do you think?
