The BTC/USD Short PlayNew high, new trend lines.
I saw a correction coming on the charts, using two trendline - 1 as my trend, the second as my safety, I set up a short for a lower level profit target.
Trendlineanalysis

CADCHF - Sell Short - Trendline and Candle stick confluences. Market is making a series of LH and LLs- Market has rejected from trend line resistance. Bearish Engulfing candle formation is a strong confluence of market bearish trend.
we can instant enter in the market, SL would be slightly above Last confirmed LH and TPs would be with R:R of 1:1 and 1:2 respectively.

AUDJPY higher bearish for expect
OANDA:AUDJPY interesting structure, trend line is breaked and we can see bearish flag also is breaked.
Currently here expecting to see higher fall.
SUP zone: 93.600
RES zone: 91.500, 90.600

BEST XAUUSD M30 BUY SETUP FOR TODAYThis 30-minute chart of Gold Spot (XAU/USD) reflects a strong bullish momentum 📈, marked by a clear Break of Structure (BOS) and Change of Character (ChoCH) signaling a market shift to the upside. Price recently broke above an equal high (EQH) and is now testing a resistance zone labeled as a “weak high”, suggesting potential for further upside toward the next key supply zone 🔴. The projection highlights two possible scenarios: either a continued bullish rally into the supply area around 3,340 🏹, or a pullback to the demand zone near 3,280 🟦 before resuming upward movement. Traders should monitor for price reaction at current levels and be prepared for either a breakout or a healthy retracement for optimal entry opportunities 🎯.

Nu Holdings (NU, 1D) — Technical AnalysisNu Holdings (NU, 1D) — Technical Analysis: Trendline Breakout, EMA/MA Confirmation, Recovery Toward Key Levels
On the daily chart, Nu Holdings has broken out of a descending trendline, signaling a potential structural reversal. The breakout was confirmed by a close above key exponential and simple moving averages (EMA 50/100/200), with the EMAs beginning to align in a bullish sequence. The price has held above the critical Fibonacci retracement level at $11.73 (0.618), which now serves as a key demand zone. Volume shows signs of increasing during upward impulses, suggesting accumulation interest. The current recovery structure indicates potential targets at $12.58 (0.5 Fibonacci), followed by $13.42 (0.382) and $14.46 (0.236). A more extended move could lead toward the previous supply zone near $16.15 if momentum persists.
From a fundamental standpoint, Nu Holdings continues to attract investor attention within the fintech sector, especially amid broader rotation back into growth and tech-driven financial platforms. The company's expanding market presence and improving financial metrics may support the current technical setup. As long as the price holds above the broken trendline and maintains strength above the key $11.73 level, the bullish scenario remains in focus with targets pointing toward the $13.42–$14.46 range and potentially higher in the medium term.

SWDY Trend Line AnalysisSWDY stock is in a downward line, but rebounded back from the support line 78.025. In case of falling it's expected to break the 1st support line 78.025 till reaching the 2nd support line 76.249. In case of rising, it's expected to breach the 1st resistance line 78.326, the 2nd resistance line 78.687, and the 3rd resistance line at 78.928, which is fundamentally highly expected due to its latest acquisition.

USDCAD Bullish Continuation PatternStill in this trade, I entered about 1.5 weeks ago based on the weekly bullish trendline. Now on the lower timeframes ( 4hr, 1hr, 30m ) we can see a nice pattern formation being formed. I believe it will continue bullish based on the weekly trendline confluence.

HelenP. I Euro may reach resistance level and break itHi folks today I'm prepared for you Euro analytics. Observing this chart, we can see how the price appears to be finding stability just above the trend line support. This zone also aligns closely with the local swing low formed after the rejection from the resistance area near 1.1270. Buyers managed to defend this key trend structure, forming a potential higher low setup within the broader bullish framework. The price is now trading below a significant resistance cluster, where both horizontal and supply pressure meet, the 1.1270 to 1.1315 zone. However, the fact that EUR is respecting the rising trend line and hasn't broken below the previous local low suggests that bullish momentum may still be intact. A corrective dip into the trend line could offer the final shakeout before a new leg upward begins. If price manages to build strength around this support and push back toward the resistance zone, a breakout becomes increasingly likely. In such a case, the market may extend toward the 1.1400 area, which I consider my current target. Given the sustained higher lows, trend support, and structure of accumulation forming below resistance, I expect EURUSD to continue pushing upward after this retest phase. If you like my analytics you may support me with your like/comment ❤️
Disclaimer: As part of ThinkMarkets’ Influencer Program, I am sponsored to share and publish their charts in my analysis.

Bitcoin - The Bottom Is In!Bitcoin ( CRYPTO:BTCUSD ) is reversing right now:
Click chart above to see the detailed analysis👆🏻
It was really just a matter of time until Bitcoin actually manages to create a potential short term and longer term bottom. With this monthly candle, bulls are taking over again and starting to buy cryptos quite heavily. The chart just tells us that this is not the end, but rather the continuation.
Levels to watch: $70.000, $300.000
Keep your long term vision,
Philip (BasicTrading)

GOLD XAU-USD CORRECTION COMPLETE REALLY TOWARD UP $3400 0PEN XAUUSD continues to trade within a clearly defined bullish channel, showing strong adherence to upward trendlines and key support levels. Recent price action confirms the ongoing strength of bullish momentum, with higher highs and higher lows reinforcing the prevailing trend. Technical indicators, including moving averages and RSI, remain aligned with buyers, while macroeconomic factors such as inflation concerns and global risk sentiment further support the upside narrative. As the precious metal steadily advances, the $3400 level emerges as a key psychological and technical target, suggesting that, barring significant shifts in market dynamics, gold may continue its trajectory towards new highs in the medium term."

USDCAD Monthly Trendline HitUSDCAD has hit the monthly bullish trendline as well as support area for confluence. I will be keeping an eye on this on the LTF to manage my position.

LYFT, 3D Daily Breakout Confirms Potential Mid-Term ReversalOn the 3-day chart of Lyft, price action is developing within a potential mid-term reversal structure. The key trigger was the breakout of the descending trendline on the daily timeframe, signaling a shift in momentum after an extended downtrend.
The asset bounced from the long-term ascending support zone around $9.66, and the structure now points to a possible expansion toward key Fibonacci retracement levels:
Upside targets based on Fibo levels:
– $14.36 (0.5)
– $15.47 (0.618)
– $17.05 (0.786)
– Extended: $24.88 (1.618)
Technical Highlights:
– Breakout confirmed on daily chart trendline
– 3D chart shows tightening triangle pattern
– Stochastic momentum turning bullish from oversold levels
– Volume profile supports accumulation, not distribution
– Resistance zone: $14.30–$17.00
– Holding above the breakout trendline keeps the bullish setup valid
Fundamental Context:
Lyft is restructuring operations, with narrowed losses, improved efficiency, and customer retention focus. The company is regaining share in the ride-hailing segment, and investors are beginning to price in operational stabilization. The improving sentiment is reflected in growing institutional interest and mid-term positioning.
This is a potential mid-term bullish scenario, activated by the daily breakout and confirmed if price holds above the trendline. A push above $15.50–$17.00 could unlock the full target at $24.88. As long as structure holds, this remains a strong trend reversal setup.

NZDJPY LONGHey everyone we looking for a long NZDJPY, we were having a uptrend for an quiet a while so this is what i see and why i will taking a buy
1) break and retest to daily support and reject few times
2) reject from a 50% Fib level
3) break our counter trend line on 4h which shows us buyer is taking over
4) shift from bearish to bullish market after break of structure on1h
5) reject Daily and 4h 50 EMA
6) engulfing bullish on 4h
Im aiming 1:2 risk to reward Ratio

Gold 8H – Probable Scenario Until the End of May 2025Briefly today!
Greetings, let’s take a look at the current situation for gold.
Technically, we can see a classic symmetrical triangle forming on the 8-hour chart, with a support zone established in the 3291–3300 range.
I'm expecting a move towards the 3440–3450 area, followed by a retest and an upward push toward the 3833 level.
Fundamentally, we take into account Trump's policy stance and the ongoing conflict between Pakistan and India.

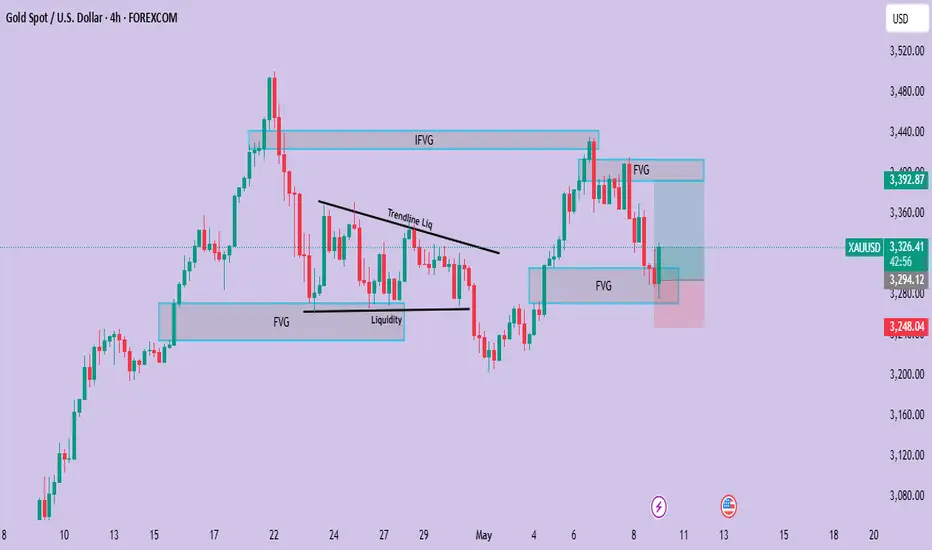
From this point, there is potential for an upward move.Gold (XAUUSD) Analysis
Recently, we’ve seen Gold consistently respecting Fair Value Gaps (FVG). Whenever a bullish FVG forms, price tends to just touch it before moving upward. Similarly, when a bearish FVG appears, the market tends to reject from that point.
Interestingly, we also observed that the market has cleared previously built liquidity right as it tapped the FVG — including both buy-side and sell-side liquidity. Currently, after dropping from a bearish FVG, price is rebounding from a bullish FVG.
From this point, there is potential for an upward move, with a target around $3375. A potential entry zone lies between $3302 and $3280. It's important to watch the market closely and, as always, do your own research (DYOR)!
Gold - All eyes on Wednesday 08 May - FED🟡 Gold Traders: Nothing Matters Until Wednesday! ⏳💤
Hey traders! 👋
This week, all eyes are on Wednesday... and everything before that? Mostly noise.
Let me break it down for you. 👇
📊 Technical Outlook
Gold is chilling above a key resistance level right now.
Trendlines suggest we won’t see any major moves before Wednesday unless big news drops. 📰
🕐 Asian session is kicking things off above resistance.
If bulls show up there, we could break Trendline 1 (Image below) and head towards the $3300 🎯 target.
📉 RSI across multiple timeframes? Pretty neutral.
If Asia trades flat or slightly bearish, gold might range between $3210–$3250.
Break below $3201, and things could get shaky... but the European session might push us back above that support.
U.S. session on Monday? Likely a sideways snoozefest 😴 (unless surprise news hits).
🎯 Trade Setup (Mon–Wed)
I’m looking to play the range between:
$3261 (Trendline 2) 🔼 and $3169 (Trendline 4) 🔽
That’s a comfy $90 window I’m aiming to trade before Wednesday's fireworks. 🚀
🔮 After Wednesday – The FED Factor 💣
Here’s the real catalyst:
Wednesday, May 7 at 2:00 PM EST – FOMC Rate Decision
If the FED cuts rates (not likely, but possible under pressure), gold could tank hard. 💥
I’m talking a potential drop to $3150 or lower 🕳️📉
That’d be a -$90+ move easy.
FED has been holding the line 💪, resisting pressure (especially from Trump back in the day), but if the economy flashes red, that rate cut might come sooner than expected.
🧠 Final Thoughts
FED paused hikes, but left the door open for 3 rate cuts this year.
Until we get more clarity, no strong bullish signals on gold.
My bias stays: Bearish unless proven otherwise. 🐻💬
Stay sharp out there, and watch those sessions. Wednesday’s the real deal! 💼📉
And last but not least, look at this and let us know what you think about please:
Some would say its impossible but as we know, gold can do everything!
-------------------------------------------------------------------------
This is just my personal market idea and not financial advice! 📢 Trading gold and other financial instruments carries risks – only invest what you can afford to lose. Always do your own analysis, use solid risk management, and trade responsibly.
Good luck and safe trading! 🚀📊

ETH - LIQUIDATION OF A FRIENDif you like the idea, please "Like" it. This is the best "Thanks!" for the author 😊 P.S. Always do your own analysis before a trade. Put a stop loss. Fix profits in installments. Withdraw profits in fiat and please yourself and your friends.

"Nifty 50 at a Crossroads: Rising Wedge Signals Breakout or Brea* A **rising wedge** pattern is clearly forming, marked by two upward sloping blue trendlines.
* Inside this wedge:
* Multiple **price swings** (higher highs and higher lows) are visible.
* Recent breakout attempts are marked with zig-zag arrows showing potential breakout direction
📈 **Bullish Signals:**
1. **Strong Uptrend:**
* A sustained rally from \~23,000 up to the current levels (\~24,500) indicates strong bullish momentum.
2. **Breakout Potential:**
* Price is attempting to break out above the rising wedge pattern.
* Immediate **bullish target zone** is around **24,596 to 24,754**, marked with a green "Target" label.
3. **Volume Surge:**
* Recent bullish candles are supported by increased volume, suggesting real interest in the breakout.
📉 **Bearish Risks:**
1. **Rising Wedge Risk:**
* Rising wedge patterns often lead to **bearish breakdowns**.
* If the support of the wedge is broken, the **first downside target** is marked at **24,369**, and **next support** at **24,291**.
2. **Volume Divergence:**
* Although there's some volume on bullish moves, the consistency is lacking compared to the strong rally before April 23.
**Key Price Levels:**
| 24,754.90 | Resistance | Upper range of rising wedge (target) |
| 24,596.40 | Resistance | First bullish target zone |
| 24,520.00 | Minor Resistance | Recent swing high |
| 24,369.45 | Support | First bearish target if wedge breaks |
| 24,291.25 | Key Support | Critical support, below wedge trendline |
| 23,786.80 | Strong Support | Previous consolidation breakout zone |
**Conclusion:**
* The Nifty is in a **tight rising wedge**, typically a **bearish** reversal pattern. However, if bulls can push past **24,520–24,596**, it may invalidate the pattern and open further upside.
* Until a confirmed breakout or breakdown occurs, traders should remain cautious and wait for **volume-backed confirmation**.

WTI TRADE IDEAhello everyone
From the previous oil movement, the entry at 58.52 moved up by 80 pips before hitting breakeven. For the upcoming open market, if the trendline and support or resistance break out as shown on the M30 chart, it could signal an opportunity to enter the market.
Ensure strong confirmation before acting, and keep an eye on shifts in market structure.
Thanks a lot for your support & best of luck
**My trading strategy is not intended to be a signal. It's a process of learning about market structure and sharpening my trading my skills also for my trade journal**

XAUUSD UPDATE : FED INTEREST RATE DECISION hello & happy weekend everyone
For coming week trade forecast. From the left side, the daily chart indicates that a breakout has occurred, and the current increase is a temporary pullback. If a rejection happens at the 0.236 daily retracement and the trendline on 1 hour chart successfully pushes the price downward, I see an opportunity to short towards the upcoming Fed interest rate decision.
And I am very grateful for the support given, especially in some of the previous trades. I hope that my trade plan can help traders identify the direction to enter the market.
good luck all
**My trading strategy is not intended to be a signal. It's a process of learning about market structure and sharpening my trading my skills also for my trade journal**
Thanks a lot for your support

EURCHF new bearish push expecting
OANDA:EURCHF FALLING WEDGE we are have, in moment its be breaked, price is also be and on trend line with FW, i am expect price will continue pushing, but looks like we will have break of trend line and bounce on sup zone 0.93950
SUP zone: 0.94000
RES zone: 0.92450, 0.92000

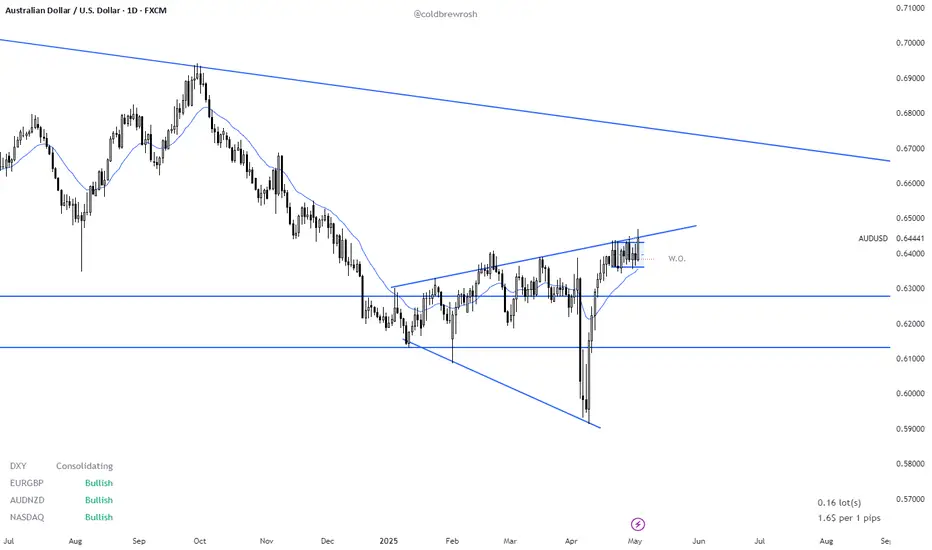
AUD/USD, Are Bull Set for a Breakout ?This analysis dates from the 3rd of May, this is in no way financial advice and should be taken into account in an objective way. Make your own opinion about it, don't take it for granted.
- AUD/USD is trading around the 0.64000 area on the daily chart, it has been consolidating around that area since April 21st following a 7 consecutive bull rally. Where it is heading to next still needs to be determined. Nevertheless, there is a clear Expanding Triangle dating since the start of 2025. (see image attached),(13th January, 03rd of Feb, 09th of April for the lower bar and 27 January, 20th Feb, 17th March, 23rd of April for the upside channel).
- This expanding triangle is similar to the one identified on NZD/USD which had an upside breakout and is now consolidating around the 0.59200.
- Whether there is an upcoming BO on Aussie Dollar is still TBT, but odds slightly favor the bulls following the strong rally in the first half of April. Nevertheless, it has been trading in a trading range since April 21st and there are no confirmed breakout yet. Needs to be closely watched in the coming days!! If bulls manage to get consecutive strong bull bars, this could set the stage for an measured move up for at a minimum a test of the 0.66000 area (downside channel from Feb 2021 to Nov 2024 on the Monthly).
- The Bear reversal case is harder to argue for, as they only managed to get one strong bear bar (04th April), with no follow through selling, The market has been trading for longer on the upper bracket of the extending triangle which means the market participant agree more on higher prices. Stay tuned for further updates !! Peace.
Micron Technology - The Chart Is Still Perfect!Micron Technology ( NASDAQ:MU ) will reverse right here:
Click chart above to see the detailed analysis👆🏻
If you actually want to explain technical analysis to somebody, just show them the chart of Micron Technology. Almost every structure makes perfect sense, with this stock respecting all major trendlines and horizontal levels and with the current support area, the bottom is now in.
Levels to watch: $70, $210
Keep your long term vision,
Philip (BasicTrading)
