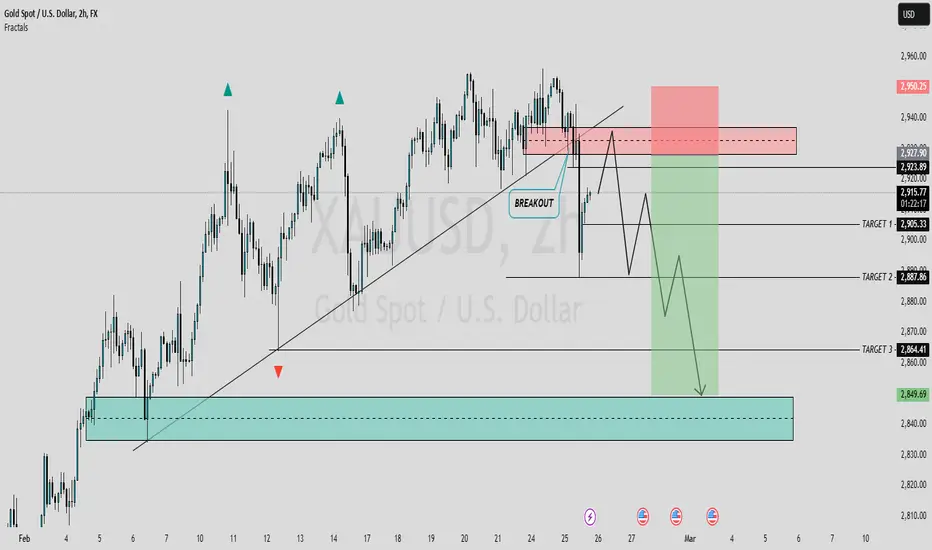
GOLD 2H OUTLOOK FOR TODAYThe expected move in the price of gold can be analyzed on a 2-hour time frame. As we know, the overall trend of gold remains bullish. However, recently, gold has broken it's trendline support and has also confirmed a Market Structure Shift (MSS). Therefore, today, I will be looking at the market from a sell-side perspective. I will wait for the price to reach my given key levels and form some bearish or reversal patterns, so I can get an ideal entry point. Confirmation is crucial in this process. Let's dive deeper into these levels and potential outcomes.
Always use stoploss for your trade.
Always use proper money management and proper R:R ratio.
This is my analysis for today.
#XAUUSD 2H Technical Analysis Expected Move.
Trend Line Break
GOLD → False breakdown and pullback before the fallFX:XAUUSD is updating lows within the framework of the changed local trend. The price is testing the liquidity zone of 2852. Possible rebound before further decline
Gold traded near two-week lows below $2,900 in Asian markets on Friday, breaking an eight-week run of gains. The metal is being pressured by a strengthening U.S. dollar amid Trump's new tariff threats and the U.S. economy.
Trump confirmed 25% tariffs on Mexican and Canadian goods from March 4 and an additional 10% on Chinese imports. Weak US GDP data (2.3% in Q4) and rising jobless claims also support the dollar.
Traders are waiting for the PCE core price index data to gauge the Fed rate outlook and the impact on gold
Resistance levels: 2869, 2877, 2885
Support levels: 2852, 2834
A false break of 2852 could trigger a pullback to the imbalance zone (2869-2877) or to the liquidity zone (2885) before a further decline. Fundamental and technical background is weak, gold may try to renew the low.
Regards R. Linda!

USDJPY → A rebound following a rising dollarFX:USDJPY is growing following the dollar. A local reversal is being formed due to US politics and economy
The price stops in the zone of 149.4 - 148.6 after a strong fall. Long-term consolidation is forming a reversal setup, the situation is also supported by the reversal and strengthening of the dollar. Against this background, the Japanese yen is losing positions.
The focus is on the resistance 150.3, if the bulls can keep the defense above this zone, then in the short to medium term the price may strengthen to the trend resistance.
Resistance levels 150.3, 150.95
Support levels: 149.4, 149.15
At the moment we have a downtrend and the potential for counter-trend correction. Everything depends on the dollar and the upcoming news. If the outcome is positive for us, the price may reach 152.3
Regards R. Linda!

UNIVERSOFSIGNALS| SUSHI: Key Levels and Market Outlook👋 Welcome to UNIVERSOFSIGNALS !
In this analysis, I want to review SUSHI for you. SushiSwap is a DeFi protocol operating in the DEX sector, with its token currently ranked 195th on CoinMarketCap and a market cap of $58 million.
📅 Weekly Timeframe
On the weekly timeframe, we can see a consolidation box between $0.534 and $1.959. Since 2022, the price has been fluctuating within this range, forming a large consolidation zone, with multiple touches to both the upper and lower boundaries of this box.
🔍 As observed, in the last bullish leg, the price broke above the box's upper boundary with a large weekly candle. However, it quickly retraced back into the range after being rejected at $2.734, resulting in a fake breakout.
🧩 Currently, the price is near the lower boundary of the range at $0.534. If this support level breaks, the price could initiate another bearish leg and move toward a new all-time low (ATL). On the other hand, if the upper boundary of the box is broken and price stabilizes above it, we could see an upward movement in SUSHI.
⚡️ The largest and most significant resistance ahead is at $20.444, which is the all-time high (ATH). Reaching this level would be extremely difficult, as it would require a significant increase in market capitalization, meaning a substantial capital inflow into the coin.
✨ Let’s now analyze the daily timeframe to gain more insight into price movement.
📅 Daily Timeframe
On the daily timeframe, as seen in the last bullish leg, the price bounced from the $0.534 support and moved upward. After breaking $0.803, strong bullish momentum entered the market. Additionally, RSI reaching the oversold zone contributed to a stronger bullish push.
🔽 Following this movement, the fake breakout at $1.855 led to the start of a corrective and bearish phase, with the price initially declining to $1.347.
📊 After breaking below $1.347 and retesting it as resistance, the price entered another bearish leg, reaching $0.803. Currently, after some range-bound movement around this level, RSI has exited the oversold zone, and the price seems to be retesting this level as resistance.
✅ If RSI re-enters the oversold zone, the price could drop further to the lower boundary of the range at $0.534, which would not be a good sign for SUSHI. As observed, buying volume has significantly decreased, and most traders in this market are sellers.
🛒 For spot buying, I recommend avoiding this coin for now and waiting for a clear bullish structure to form. At a minimum, SUSHI should start showing strength against Bitcoin.
🧲 From a USDT perspective, if the upper boundary of the range ($1.855) breaks, then $2.734 could serve as a trigger for a buying opportunity.
📝 Final Thoughts
This analysis reflects our opinions and is not financial advice.
Share your thoughts in the com

BTC Ready To Going $200K!I am Sharing Currentn Analysis Of BTC where You Can Take Idia From This Analysis And Help In To Your Trading Journey Market Coming In Their Nearest Buying Zone This is very Important Zone For BTC Here Is BTC Will Try To Fly To Upside And Test To Resistance Side.
Remember! Without Risk Management Trading is Gambling 📊.

AudJpy formed rising wedge pattern!Looking for Impulse Down.
AudJpy formed rising wedge pattern as continuation pattern and AJ should continue fall to the deep. Make sure you have your own rules on RR and follow them. This is just a trading idea to help you gain better knowledge. If you have any question ask me in comments.
Learn & Earn!
Wave Trader Pro

GOLD → Retest of risk zone 2880. A pullback is possibleFX:XAUUSD is breaking the local trend and is testing the panic and risk zone of 2880 as part of the correction. A retest of this area will increase the chances of a trend change
Gold is losing growth due to uncertainty of Trump's tariff plans and economic problems in the US. Contradictory statements from the president are supporting the dollar, while rising bond yields are holding back gold prices.
Markets are waiting for US GDP data: if the figures are lower than forecast (2.3%), gold may rise. Fed speeches are also important, but the key will be Trump's statement, which may change the market sentiment
Technically, locally we have a bearish market structure and in this case we expect the decline to continue after a small correction.
Support levels: 2878, 2888
Resistance levels: 2890, 2907
False breakdown of the above support, after such a strong fall, may form a correction. Initially, the price may head towards 0.5 Fibo, after a small pullback we may test 0.7 Fibo. But then we will have to watch the price reaction.
If the gold will go down, the focus will be on 2880.
If the movement will be difficult and the price will start to test the resistance, then in this case, against the background of high risks, we can return to the growth phase.
Regards R. Linda!

OPUSDT → There's still a chance for an alt seasonBINANCE:OPUSDT is showing positive momentum relative to what bitcoin has put up this night. The coin is in consolidation and testing trend resistance
The main reason for the lack of an altcoin season is bitcoin's huge dominance of the cryptocurrency market. The fall of BTC (open channel to 75K) and further growth after the formation of an intermediate bottom in the 75-80K zone may reduce the dominance phase, which in general will give a chance to the altcoin market, which is going through bad times.
I like OP in the fact that it is not falling in the wake of the flagship, but stands in consolidation, where we have clear boundaries for strategy formation. Focus on resistance: 1.212.
Resistance levels: 1.212
Support levels: 1.044, 0.983
Thus, a break of the resistance at 1.212 could trigger a rally and an attempt to change the trend.
It may happen after correction to 0.5 fibo, or after formation of pre-breakdown consolidation on H1-H4.
The structure of the setup will be broken if the coin starts to break 1.044-0.983.
Regards R. Linda!

GOLD → Bullish structure. Emphasis on 2955FX:XAUUSD is still in consolidation, but the flat is gradually changing into an ascending triangle structure, which further explains the bullish interest in the market.
Gold price is consolidating near the record high of $2,956. Investors took a pause before a possible continuation of gains amid renewed trade war fears over Trump's statements on tariffs and controls on exports of Nvidia chips to China.
Weak risk sentiment and a rising dollar are holding back gold, but lower bond yields and expectations of Fed policy easing are supporting prices.
Gold will remain influenced by tariff negotiations and US consumer confidence data in the coming days
Resistance levels: 2940, 2954.5
Support levels: 2930.7, 2921
Local resistance at 2940 is ahead. If the bulls are able to consolidate above this area, we should wait for the growth and the retest of 2954.5.
2954.5 is a trigger, the breakdown of which will provoke the continuation of the bull rally.
But before that the consolidation between 2954 and 2940 may be formed. I don't exclude the flat support retest before further growth.
Regards R. Linda!

GOLD → Price is in consolidation and getting ready to go to $3KFX:XAUUSD is preparing to continue its growth. Consolidation is forming against strong resistance. The dollar in the correction phase continues to update the lows....
Gold is consolidating near 2945-2955, remaining cautious due to Trump's tariff threats and waiting for US inflation data. Which technically increases the chances of continued gains.
Optimism in the markets is supported by upcoming US-Russia talks on Ukraine, new Chinese measures and the victory of conservatives in Germany.
Weak dollar and expectations of Fed rate cuts support gold, but rising risk appetite reduces its attractiveness
Resistance levels: 2946.5, 2954.5
Support levels: 2935, 2921
Technically, the focus is on 2946.5. If the bulls are able to break this level, the resistance ahead at 2954.5 will not seem so strong. In this case, the price will continue its growth to 2969 - 3K
But, before further growth, as gold is still in consolidation, the price may test the liquidity zone 2935 - 2921.
Regards R. Linda!

XAUUSD ( GOLD ) | 1H | SELL NOW Please don't forget to like 🙏🏻
SIGNAL ALERT
SELL ( GOLD > XAUUSD ) - 2952,0 - 2954,0
🟢TP1: 2950,0
🟢TP2: 2944,0
🟢TP3: 2938,0
🔴SL: 2965,9
High Risk - Yüksek Risk
RISK REWARD - 2,36

NZDUSDRSI indicates Bullish Divergence.
Trendline Break: A break above a significant downtrend line signals a shift in market sentiment from bearish to bullish. This is a key technical signal that buyers are starting to gain control.

$VZ Trade Analysis DarkPoolsLet's analyze the provided chart of Verizon Communications Inc. (VZ) on the daily timeframe and break it down systematically to understand its current trend, key levels, and potential trade setups.
1. Trend Analysis:
Moving Averages:
The stock is trading above the 8 EMA (yellow line) and 21 EMA (blue line), indicating a bullish trend.
The price recently moved above the 200 EMA (dotted purple line), further confirming momentum.
Price Action:
The stock had a strong breakout from a previous consolidation range.
A series of higher highs and higher lows suggests the uptrend is continuing.
The last few daily candles show strong bullish momentum with large-bodied candles.
2. Key Support and Resistance Levels:
Dark Pool Levels (White Dashed Lines):
BB SW: 39.50 (A significant area where large institutional orders were executed.)
BA SW: 41.25 (A more recent Dark Pool level, which is now acting as a support level.)
Pivot Levels & Resistance Areas:
R1: 40.99 (Already broken, now acting as support.)
R2: 42.58 (Next potential resistance.)
R3: 44.28 (A major target if momentum continues.)
R5: 42.84 (Another high-level resistance.)
Support Levels:
S1: 39.09
S2: 38.79
S3: 38.48
S4: 37.58 (Major support and invalidation level.)
3. Trade Plan & Strategy
A. Bullish Trade Idea (Momentum Play)
📈 Entry: If the price holds above 41.25 (Dark Pool Level) and re-tests successfully.
🎯 Profit Targets:
42.58 (R2 Pivot Level) – Short-Term Target
44.28 (R3 Pivot Level) – Extended Target
44.84 (R5 Level) – Full Bullish Breakout Target
🛑 Stop Loss:
Below 40.49 (21 EMA & previous resistance now support)
Aggressive Stop: Below 41.25 (invalidates momentum)
Conservative Stop: Below 39.50 (breaks key Dark Pool level)
B. Bearish Reversal Play (If Price Fails at Resistance)
📉 Entry: If the price rejects 42.58 and shows weakness.
🎯 Profit Targets:
41.25 (Dark Pool Level) – First Target
40.49 (21 EMA) – Extended Target
39.50 (BB SW Dark Pool Level) – Full Target
🛑 Stop Loss:
Above 42.84 (R5 Pivot Level)
4. Conclusion & Prediction
Primary Expectation: Bullish continuation if price holds above 41.25 with targets at 42.58 and 44.28.
Risk Consideration: A break below 41.25 and 39.50 would signal potential weakness.
Final Thought: Institutional buying (Dark Pool activity) at 39.50 and 41.25 suggests strong accumulation. If volume sustains, this move could push VZ towards 44+ in the coming weeks.

GOLD → Updated to the max. Growth may continueFX:XAUUSD updates its high to 2955, entering a clear zone where nothing prevents the price from continuing its rise. Economic risks and the dollar correction are still supporting the price of the metal
Investors are seeking refuge in gold amid Trump's threats to impose another tariffs as early as next month.
Markets remain under pressure due to a lack of support from China and tensions between the US and EU over peace talks with Russia without Ukraine.
Although the Fed meeting minutes have gone unreported, investors remain focused on tariff negotiations, expecting gold prices to rise further amid market uncertainty
Technically, the strong bullish trend and rally continues. Focus on key levels and local range 2955 - 2946
Resistance levels: 2955
Support levels: 2946, 2938
The price is pinned at 2955, the next trigger, the breakdown of which will provoke the continuation of growth. But before that the gold may test the support zone 2946 - 2938. The growth may continue after a false breakdown of support.
Regards R. Linda!

GOLD → ATH Retest. High chance of breakout and growth to $3KFX:XAUUSD has again approached ATH 2938 - 2942. This yours increases the chance of resistance breakout and further growth. We are getting closer and closer to $3000
The market maintains recent gains as it awaits the release of minutes from the January Fed meeting and news of Trump's tariff plans. The US President threatened to impose duties on pharmaceuticals and chips, and confirmed the imposition of tariffs on automobiles from April 2, which strengthened demand for defensive assets.
The lack of progress in peace talks between the US and Russia has also supported gold prices. However, traders are cautious ahead of the release of Fed minutes, which could cool expectations of rate cuts this year.
Technically, all eyes are on the conglomerate resistance at 2938 - 2942. A breakdown and consolidation of the price above this area will provoke further growth
Resistance levels: 2938, 2942
Support levels: 2924, 2915
Gold is in local pre-breakdown consolidation 2938 - 2924. Emphasis on these boundaries. Breakout and consolidation of the price above the resistance can provoke continuation of growth. But, before the growth the price may test the nearest support.
Regards R. Linda!

EURJPY → Consolidation before further declineEURJPY is forming a downtrend. The price is bouncing off the channel resistance and has approached strong support, the breakout of which may trigger further decline
Global EURJPY is in a neutral trend, but locally, due to economic nuances, the euro is weakening against the Japanese yen
There are two key zones on the chart - resistance at 159.112 against which a false breakdown can be formed before the price continues its decline. And support at 158.45 - support of the pre-breakdown consolidation and at the same time a strong level, the break of which will open the way to 156.29.
Resistance levels: 159.11, 160.16, 160.9
Support levels: 156.29
Technically, the situation is weak and hints that in the short term the bears could overcome the key support, which could trigger a bearish momentum
Regards R. Linda!

Gold - This Breakout Will Lead To $5.000!Gold ( TVC:GOLD ) is preparing a major breakout:
Click chart above to see the detailed analysis👆🏻
For more than one and a half decades, Gold has been respecting the structure of a rising channel pattern with one exception. Back in 2010 we saw a bullish breakout followed by a parabolic rally and as we are speaking, Gold is starting to break out of the channel once again.
Levels to watch: $2.900, $5.000
Keep your long term vision,
Philip (BasicTrading)

CMSB - Breakout Down Trendline ?CMSB - CURRENT PRICE : RM1.10
CMSB had broken down trendline on high trading volume - indicating strong buying interest.
This is possible beginning of trend changing from downtrend to uptrend. Furthermore, the reading in RSI crosses above 50 added more bullish outlook for this stock.
Technically i would buy on this breakout point as it suggest an attractive RISK to REWARD ratio.
ENTRY PRICE : RM1.10
TARGET : RM1.20 , RM1.29 , RM1.42
STOP LOSS : RM1.00
Notes : There is a catalyst for this stock. Investors may refer to TheEdge website (date 19 FEB 2025) - CMSB books highest quarterly net profit in more than two years, declares three sen dividend.

GOLD → Price is confirming the flat. Emphasis on 2905FX:XAUUSD within the 2% correction that happened on Valentine's Day confirmed that one should not fall in love with the market. Technically the market is still bullish, the price is inside the range of 2880 - 2940
Investors are waiting for the meeting between Trump and Putin, which may influence the Russian-Ukrainian conflict and reduce geopolitical risks.
Additional support for gold is provided by expectations of Fed rate cuts after weak US retail sales data. At the same time, the markets are watching the escalation of the tariff confrontation between the US and the EU. High volatility is possible in the coming days due to holidays in the USA and speeches of the Fed representatives
The key figure is the ascending support, relative to which a false breakdown and the range of 2880 - 2940 is formed. If the price holds in the buying zone, under the bullish support, we can still see the growth.
Resistance levels: 2904.7, 2922.6
Support levels: 2893, 2880
A pre-breakdown consolidation is forming around 2904.7. If the resistance is broken and the bulls can keep the defense above this zone, the gold may continue its strengthening. I do not exclude a retest of the support at 2893 - 2880 before further growth.
Regards R. Linda!

USDCHF → Struggle for the 0.900 zone. Trend change?FX:USDCHF earlier broke the uptrend when the fundamental background changed and the dollar went into correction. A set-up appears on the chart, which can strengthen the maneuver
Fundamentally, the situation is complicated because of the tariff war, which was organized by Trump, and European countries are reciprocating. Economic risks are on the rise. In addition, after Trump and Powell's hints about possible rate cuts, the dollar went into correction, which has a favorable impact on forex.
Technically, the 0.9000 level plays an important role as it is quite a strong zone. If the bears are able to keep the price below this mark, in the selling zone, it will be a confirmation of the trend change and the price will be able to head down.
Resistance levels: 0.9000, 0.9045, 0.9065
Support levels: 0.89157
I do not exclude the fact that the price may return to the range and test 0.5 Fibo, but the technical and fundamental background hints at a possible decline. Emphasis on 0.900.
Regards R. Linda!

Overall Market Structure XAUUSD1. Overall Market Structure
The market is currently in a strong bullish trend, forming higher highs and higher lows.
A retracement is occurring around the $2900 - $2927 zone, which could be a Liquidity Grab before the next move.
2. Key Support & Resistance Levels
Resistance Zones:
$2927 - $2942 (Key Fibonacci 0.236 - 0.0 level), which has already triggered a reaction from sellers.
Support Zones:
$2870 - $2890 (Fibonacci 0.786) – A critical area where buyers may step in.
$2779 (Support from the previous week) – If a deeper correction occurs, this could act as a liquidity area for long positions.
3. Liquidity & Key RTM Zones
Liquidity was grabbed above $2942, indicating potential sell-side orders.
A retracement towards $2890 - $2902 (important FLIP zone) could determine the next direction.
Smart Money might manipulate price around these levels to trap retail traders before a strong move.
4. Possible Scenarios for Next Week
Bullish Scenario:
If price holds above $2890 - $2902, we could see a push towards $2942 - $2960.
A breakout above $2942 could extend the bullish rally to $3000 and beyond.
Bearish (Deeper Retracement) Scenario:
If $2890 support fails, the price could drop to $2779 - $2760, where buyers might step in.
5. Conclusion & Trading Strategy
📌 If $2890 - $2902 holds as support, expect further upside momentum.
📌 If this support breaks, a deeper retracement to $2779 - $2760 is possible.
📌 Watch for liquidity grabs and confirmation signals before entering a trade.
❗ Recommendation: Monitor price reaction at $2890 before making trading decisions. If buyers defend this level, long positions could be favorable.

China stocks ready to go? #DeepSeek another reason..This is a chart of the benchmark index for Hong Kong - HK50
It's up on Monday, while Nvidia is down 10+%
If funds are flowing out of Nvidia - China (home of DeepSeek) could be one place they end up.
The Hang Seng is a perfect example of how long a trend can take to reverse.
How many times would traders have tried to go long this index only to see it slump right back towards the bottom?
Now while this trend reversal might be delayed further - and might fail altogether - we think there is enough evidence to suggest a reversal is happening.
The price is above a rising weekly 30 week SMA
A long term trendline has broken
Crucially - the price made a double bottom pattern around 15,000
DAILY CHART
On the daily chart we see the strong surge in buying interest from September has given way to a long multi-month correction.
We are looking for a breakout above the down trendline to demonstrate the correction has finished and a new up-leg is beginning.
The final confirmation would come from a break of resistance (not drawn) from the November and December highs at 21,350.
Should the price turn lower and make a new fractal low under 19,650 then we’ll have to wait a bit longer for the Hang Seng trend reversal.
But - as always - that’s just how the team and I are seeing things, what do you think?
Share your ideas with us - OR - send us a request!

XAUUSD - Roadmap for 3003! Read ChartHello Traders!
As we know gold is trading in two parallel Channel internal and external channel and in bullish trend we are watching gold's impulsive wave breaking every time to upper trendline of external channel and retesting only internal channel's down trendline.
we seen a corrective move from 2943.329 to 2864.450 and suddenly gold again hit its ATH and this impulsive move will end at 3003 then we can expect trend reversal with any confirmation.
Support Levels: 2916,2919,2922
Resistance : 2943.300
For Now i am bullish till 3003 with stop loss at lower support
