NZDJPY → Pre-breakdown consolidation. Readiness for a declineFX:NZDJPY is under pressure from a global downtrend. Locally, a flat (range) and pre-breakdown consolidation relative to support are forming on the chart...
After a false breakdown of support on May 16, the price failed to reverse and grow. Instead, the currency pair entered a consolidation phase, during which it continues to test support. Each subsequent retest of 85.25-85.30 only increases the chances of a breakout with the aim of continuing the decline. Another important nuance is the elimination (short squeeze) of local resistance at 85.95.
Pressure on the price is also being exerted by the falling dollar index, which is strengthening the Japanese yen, which is generally reflected in the price of NZDJPY...
Support levels: 85.300, 85.25, 84.195
Resistance levels: 85.7, 85.95
The continuation of the current consolidation and the compression of the price towards support only increases the chances of a breakdown of the 85.30 support level. A break and consolidation of the price below 85.25 could trigger a further decline.
Best regards, R. Linda!
Trend Line Break

Gold - This is still clearly not over!Gold - TVC:GOLD - just needs a moment to breathe:
(click chart above to see the in depth analysis👆🏻)
It is just incredible how Gold has been rallying lately. Just over the past 1.5 years, Gold is up another +80% and is creating new all time highs every month. Since these strong rallies continue a lot longer than most people think, Gold still has significant upside potential.
Levels to watch: $3.500, $4.000
Keep your long term vision!
Philip (BasicTrading)

CHANNAL PATTERN - KAJARIACERTechnical Analysis:
Current Price: ₹1,003.9
Target: ₹4,000. This is a very ambitious long-term target, implying a substantial increase.
"History Repeat Based": Identified a historical pattern that, if repeated, could lead to such a significant price move.
Time Frame: 1 Year to 3 Year (indicates a long-term investment horizon for the target).
Trendline Support and Parallel Channel Pattern: These are bullish technical indicators. Trendline support suggests that the stock is finding buyers at a certain level, preventing further declines. A parallel channel typically indicates a sustained trend within defined upper and lower boundaries; a breakout from such a channel can signify an acceleration of the trend.
Fundamental Analysis :
Market Cap: ₹15,984 Cr.
Current Price: ₹1,004
Stock P/E: 46.8 (Higher than the Industry P/E, indicating a premium valuation)
Key Fundamental Observations:
Valuation Premium: Kajaria Ceramics trades at a P/E of 46.8, which is higher than the industry P/E of 40.2. It is also significantly above its intrinsic value and Graham Number. This suggests the market is pricing in substantial future growth or recognizing its brand strength/market position.
Declining Profitability: The negative profit growth of -17.9% and the decline in EPS from the preceding year (₹26.5 down to ₹18.5) and also from the previous quarter (₹4.88 down to ₹2.67) are significant concerns. This indicates a recent slowdown or reversal in earnings.
Strong Financial Health: Very low Debt to Equity (0.10) is a positive sign of strong balance sheet management. ROCE (16.8%) and ROE (12.8%) are decent, but could be better given the high valuation.
Shareholding Pattern:
Promoters: Stable around 47.49% as of Mar 2025.
FIIs: Have decreased their stake from 23.38% (Mar 2017) to 15.79% (Mar 2025), with some fluctuations.
DIIs: Have consistently increased their stake from 5.76% (Mar 2017) to 27.68% (Mar 2025). This strong DII buying is a positive sign.
Public: Decreased from 23.47% (Mar 2017) to 9.06% (Mar 2025).
No. of Shareholders: Increased from 37,855 (Mar 2017) to 89,567 (Mar 2025), indicating increasing retail participation.
Balance Sheet:
Consistent Growth: Total Assets have steadily increased from ₹1,176 Cr (Mar 2014) to ₹3,756 Cr (Mar 2025). Total Liabilities have also grown but seem managed.
Reserves: Growing steadily from ₹514 Cr (Mar 2014) to ₹2,728 Cr (Mar 2025), indicating reinvested profits.
Borrowings: Have fluctuated but remained relatively low compared to overall size, reaching ₹274 Cr in Mar 2025.
Corporate Action & Latest News:
Recent news would primarily focus on the company's latest quarterly results (which, as per your data, show a decline in EPS and profit growth).
Any announcements regarding capacity expansion, new product launches, or market share gains would be relevant.
Given its position in the building materials sector, news on real estate demand, construction activity, and government infrastructure spending would impact its outlook.
Overall Assessment:
Technical analysis of Trendline Support and Parallel Channel Pattern suggests a bullish outlook for Kajaria Ceramics. However, the fundamental picture shows some conflicting signals:
Positive: Strong balance sheet with low debt, increasing DII participation, growing shareholder base, and a history of growth in assets/reserves.
Negative: High valuation (P/E above industry, above intrinsic value), and importantly, a significant negative trend in profit growth and EPS (both year-on-year and sequentially in the latest quarter).
Target of ₹4000 (1-3 years): This is an extremely ambitious target, requiring a nearly 4x increase from the current price. While "history repeat" can be a valid technical argument, it would require a significant turnaround in the company's profitability to fundamentally support such a valuation in the long term, especially given the current negative profit growth.
Conclusion:
While the technical patterns you've identified could indicate short to medium-term upward movement, the long-term target of ₹4000 seems very aggressive given the recent fundamental trends of declining profit and EPS. For such a target to be plausible, Kajaria Ceramics would need to demonstrate a strong and sustained turnaround in its earnings performance in the coming quarters/years.
Considerations:
Confirm Technical's: Ensure the trendline support and parallel channel patterns are clearly established and holding on the chart.
Monitor Fundamentals Closely: Pay very close attention to upcoming quarterly results. A reversal of the negative profit growth trend is essential to support higher valuations.
Risk vs. Reward: Evaluate the risk involved, especially with a stock trading at a premium valuation while showing declining profitability.

Trendline Breakout - ZyduswellTechnical Analysis:
Current Price: ₹1970
Trendline Breakout Pattern: This is a strong bullish technical signal, indicating that the stock has potentially moved past a resistance level and is poised for an upward move. Confirmation would ideally come with increased trading volume.
Target 1: ₹2100
Target 2: ₹2500
Target 3: ₹3000
Time Frame:
1st & 2nd targets: 1 to 3 months
3rd target: 6 months to 1 year
Potential Upside from Current Price (₹1970):
Target 1 (₹2100): ~6.6% upside
Target 2 (₹2500): ~26.9% upside
Target 3 (₹3000): ~52.3% upside
Fundamental Analysis :
Market Cap: ₹12,541 Cr.
Stock P/E: 36.8 (Higher than the Industry P/E, indicating a premium valuation)
Face Value: ₹10.0
Industry P/E: 30.9
Key Fundamental Observations:
Valuation: The P/E of 36.8 is higher than the industry P/E of 30.9, implying that the market is already factoring in future growth. The current price is also well above its Intrinsic Value and Graham Number.
Profitability: The profit growth of 22.3% is robust and a positive sign.
Earnings Consistency: The EPS of ₹54.5 for the "last year" matching the current EPS, and the "EPS preceding year" being ₹41.9, suggests healthy year-on-year growth. The latest quarter's EPS (₹27.0) is very strong, indicating a significant recent boost in earnings compared to the previous quarter (₹1.01). This strong quarterly performance is likely driving recent optimism.
Financial Health: Low Debt to Equity (0.03) indicates very strong financial health.
Corporate Action (Based on recent public information, not in the image):
Stock Split: Zydus Wellness announced a stock split in a 1:5 ratio (face value ₹10 to ₹2). This is typically done to enhance liquidity and make shares more accessible. This is subject to shareholder approval at the upcoming AGM (scheduled for July 30, 2025).
Dividend: The board has recommended a final dividend of ₹6 per equity share of ₹10 face value for FY25, subject to shareholder approval.
Latest News (as of May 21, 2025):
The primary recent news for Zydus Wellness revolves around its strong Q4 FY25 financial results, where it reported a significant increase in net profit and revenue from operations. The impressive jump in EPS for the latest quarter (₹27.0 from ₹1.01 previous quarter) is a key highlight.
The announcement of the stock split and dividend recommendation also contributes positively to recent news flow and investor sentiment.
There's also news about the company unveiling a refreshed corporate brand identity, signaling strategic moves in its market positioning.
Conclusion:
The technical Trendline Breakout for Zydus Wellness appears to be strongly supported by its recent robust financial performance, particularly the impressive EPS jump in the latest quarter and a healthy profit growth of 22.3%. The company's low debt is also a significant positive.
While the stock is trading at a premium P/E (36.8 vs industry 30.9) and above its intrinsic value, the strong recent growth and positive corporate actions (stock split, dividend) could justify this valuation for investors anticipating continued strong performance.
The targets of ₹2100 / ₹2500 within 1-3 months and ₹3000 within 6 months to 1 year seem plausible if the fundamental growth momentum continues and the technical breakout holds with good volume.

GOLD → Breaking of the downward trend structure...FX:XAUUSD is breaking out of the downward price channel and heading towards the zone of interest at 3346. A false breakout of resistance could trigger a correction before growth continues.
Gold is rising for the third day in a row and trading above $3,300 amid a weakening dollar and heightened geopolitical tensions. Investors are seeking refuge due to concerns about US fiscal policy, trade disputes with China, and a possible Israeli strike on Iran. Gold is also supported by expectations of a Fed rate cut and weak prospects for the dollar.
Technically, the price is heading towards the order block and resistance at 3345-3360. Since the opening of the session, the price has exhausted all its potential, and a retest of the key level may end in a false breakout and correction. However, based on the fundamental background, gold's growth may continue after the correction...
Resistance levels: 3346, 3360, 3409
Support levels: 3288, 3265, 3245
Gold has returned to the buy zone, but the fundamental background is unstable, and any weakening of economic risks could send gold back south. At the moment, the focus is on 3346-3360, with a false breakout likely to trigger a correction.
Best regards, R. Linda!

GOLD → Short squeeze before a drop to 3150?FX:XAUUSD is consolidating. The market needs a driver, but due to the unstable fundamental background, traders have switched to a wait-and-see mode. Consolidation could turn into strong movement at any moment. But in which direction?
Gold under pressure: the market is waiting for signals from the Fed and negotiations. The dollar is putting pressure on the market amid expectations of trade negotiations with India, South Korea, and Japan, as well as statements from the Fed.Earlier, the metal was supported by the weak dollar after Moody's downgraded the US credit rating, but growing interest in risky assets and hopes for peace between Russia and Ukraine reduced demand for gold. Key factors — negotiations and comments from the Fed — will continue to influence the dynamics of the dollar and gold.
Technically, the price is in a downtrend and within consolidation. A breakout from consolidation could be accompanied by strong momentum, but I believe that there will be no countertrend movement and that a retest of resistance could end in a decline...
Resistance levels: 3265.5, channel resistance
Support levels: 3206, 3153
The most likely scenario within the bearish trend is a short squeeze and a downward breakdown from the triangle (the fundamental background and economic risks are slowly but surely declining, and gold may lose value). A false breakout of 3250-3265 could trigger a continuation of the trend towards 3150-3120.
Best regards, R. Linda!

GOLD → Retest of trend resistance before declineFX:XAUUSD is recovering amid uncertainty, but there is a fairly strong resistance zone ahead that could hold back growth and trigger a decline...
Since the opening of the session, the price has recovered slightly after a week-long decline. Growth is being held back by two-sided risks: on the one hand, pressure on the dollar and Moody's downgrade of the US credit rating are supporting the metal, while on the other hand, high bond yields and possible US trade agreements are limiting growth.
Investors are awaiting new statements from the Fed and are monitoring US negotiations with key partners. Amid concerns about fiscal stability and weak economic data, gold may remain in positive territory, but positive trade news could turn it down again.
Resistance levels: 3257, 3265
Support levels: 3206, 3153
A false breakout of the specified resistance will confirm the inability to continue growth. Consolidation after a false breakout of 3257 - 3265 below 3257 could trigger a reversal and a fall to areas of interest...
Best regards, R. Linda!

USDJPY → Support retest. Is the trend continuing?FX:USDJPY is storming key support within the local downtrend. Pressure is intensifying the dollar's decline...
The dollar index is beginning to fall, which is also reflected in the currency pair.
Selling pressure is intensifying. A local downtrend is forming, with an attempt to break through key support at 144.82, below which the path to 143.4 - 142 opens up. Consolidation of the price below 144.82 could intensify the sell-off.
Resistance levels: 145.34, 146.07
Support levels: 144.82, 143.44, 142.35
Global and local trends are downward, and the fall of the dollar can only provide additional resistance, which will intensify the sell-off. A break of key support and consolidation of prices below 144.82 will trigger further sell-offs.
Best regards, R. Linda!

BITCOIN → Consolidation in a triangle amid a BULLISH TRENDBINANCE:BTCUSDT is consolidating. A symmetrical triangle is forming against the backdrop of a bullish trend. Given the current technical nuances, we can bet that this consolidation is forming with the aim of continuing growth...
Fundamental nuances have gradually improved over the past few weeks, and the cryptocurrency market has revived slightly. Technically, I like the market structure on D1. After strong growth, the price is not going to fall, consolidation is forming. The market is bullish, after 2-3 weeks of consolidation, a bullish distribution is forming. The cycle has repeated itself twice. On D1, you can see how long tails are forming downward within the consolidation, indicating that whales are buying up all attempts to fall, keeping the market away from risk zones. Accordingly, at the moment, I would say that consolidation may continue for some time, and I do not rule out an attempt to retest the triangle support before growth, or entry into a deeper zone to retest the distant liquidity zones of 101400 and 100700 before continuing growth.
Resistance levels: 103.6, 104.4, 105.0
Support levels: 102.5, 101.4, 100.6
A decline can be considered if the price breaks the triangle support and sticks to 101400, forming a pre-breakdown consolidation (if there is no upward rebound).
However, at the moment, intraday trading can be considered, i.e., from the consolidation boundaries. A signal to exit the consolidation upwards and continue growth will be consolidation between 103.5 and 105.0 and compression towards the upper boundary.
Best regards, R. Linda!

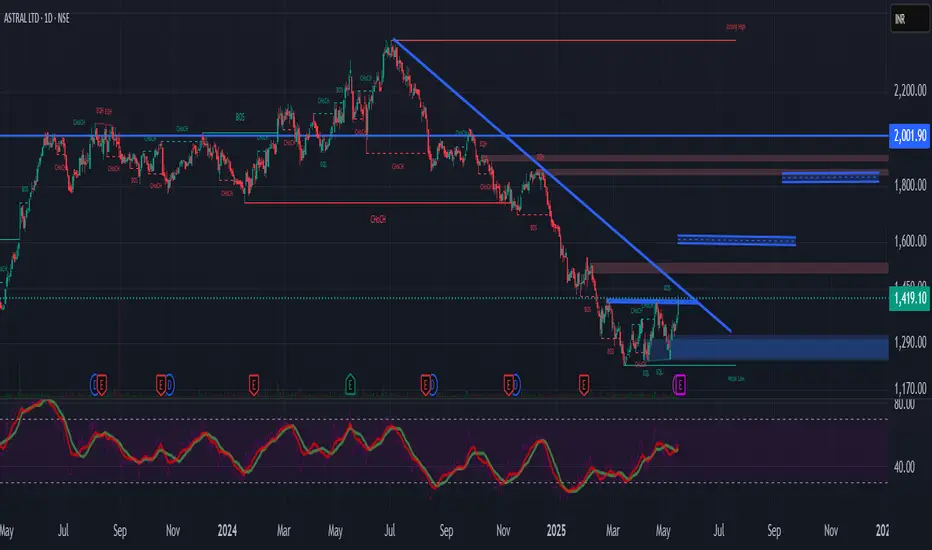
Cup & Handle Pattern Breakout - ASTRALTechnical Analysis:
Current Price: ₹1419 (as per the image)
Target 1: ₹1600 (based on small Cup & Handle breakout, potential 200 point return)
Target 2: ₹1850 (after Super Trendline breakout)
Timeframe: 1 to 3 months (for targets to be achieved)
Integrated Analysis:
Bullish Technical Setup: You've identified a potential small Cup & Handle breakout, which, if confirmed with strong volume, could lead to the initial target of ₹1600. The subsequent Super Trendline breakout would further strengthen the bullish case and support the higher target of ₹1850.
High P/E: Astral trades at a significantly higher P/E (73.1) compared to the industry average (26.5). This suggests that the market has high growth expectations for the company.
Mixed EPS: While the latest quarter's EPS (₹4.25) is slightly higher than the previous quarter (₹4.09), the overall Profit Growth is negative (-7.52%). This indicates that while the company is profitable, its profitability has declined year-over-year.
Positive EPS Trend: The EPS of ₹19.6 is higher than the EPS preceding year of ₹17.0, and the EPS last year, which is ₹20.3.
Key Factors to Monitor:
Breakout Confirmation: As always, strong volume is crucial to confirm the validity of both the Cup & Handle and the Super Trendline breakouts.
Sustainability of Growth: The company needs to demonstrate that it can return to a positive profit growth trajectory to justify its high P/E ratio.
Future Earnings: Upcoming quarterly results will be critical to see if the company can maintain or improve its EPS.
Industry Dynamics: Any positive developments in the pipes and fittings sector could benefit Astral.
Conclusion:
The technical setup suggests a strong bullish potential for Astral, with targets of ₹1600 and ₹1850. However, the high P/E ratio and negative profit growth are important considerations. The market is likely pricing in future growth, and the company's ability to deliver on these expectations will determine whether it can reach these targets
Cup & Handle pattern and Trendline Breakout - DELHIVERYTechnical Analysis:
Current Price: ₹351.25 (Note: Live prices can fluctuate. As of the market close today, Delhivery closed around ₹350.60 on the NSE).
Target: Your target of ₹410 suggests a potential upside.
Trendline Breakout: Breaking above a significant downtrend line can indicate a shift in momentum towards an uptrend.
Cup & Handle Pattern Breakout Confirmation: The confirmation of a breakout from a Cup & Handle pattern is a bullish continuation signal, suggesting a potential move higher.
Time Frame: A 1 to 3-month timeframe is reasonable for these patterns to play out if the breakouts are sustained.
Confirming the Breakouts:
Volume: It's crucial to assess if both the trendline and Cup & Handle breakouts were accompanied by a noticeable increase in trading volume. Strong volume adds conviction to the validity of the breakouts.
Sustainability: Monitor if the price holds above the breakout levels in the coming trading sessions.
Potential Upside:
Target (₹410): Represents a potential upside of approximately 16.7% from the ₹351.25 level (or around 17.0% from the ₹350.60 closing price).
Quarterly and Yearly Results & EPS Comparison:
Based on the information available up to the latest reported quarter (December 2024) and the previous fiscal year (FY24):
Latest Quarter Result (December 2024 - Q3FY25): Delhivery reported a consolidated net profit of ₹11.7 crore, compared to a loss of ₹102.9 crore in the same quarter last year. Revenue from operations increased by 19.8% YoY to ₹2,020.7 crore. This marked their second consecutive profitable quarter.
Yearly Result (FY24): For the full fiscal year ending March 2024, Delhivery reported a net loss of ₹1,007.4 crore on a revenue of ₹7,863.7 crore.
EPS Comparison:
Quarterly EPS (December 2024): ₹0.02 (positive), compared to ₹-1.41 in December 2023.
Yearly EPS (FY24): ₹-13.80.
We will need the results for the quarter ending March 2025 (Q4FY25) and the full fiscal year ending March 2025 (FY25) for the most up-to-date comparison. These are expected in the coming weeks. The recent profitability is a significant positive development.
P/E Comparison:
Given that Delhivery has only recently turned profitable, a traditional P/E ratio might not be the most meaningful metric right now. Investors will likely be focusing on the sustainability of their profitability and future growth prospects. As they continue to report profits, a P/E ratio will become more relevant for valuation comparison with peers in the logistics and e-commerce enablement space.
Corporate Action:
As of the latest information, there haven't been any recent significant corporate actions like dividends or stock splits announced by Delhivery. Investors should keep an eye on any future announcements from the company.
Latest News (as of May 19, 2025):
Recent news around Delhivery has been largely positive, focusing on:
Return to Profitability: The consecutive profitable quarters (September and December 2024) have been a major highlight, indicating a turnaround in their financial performance.
Focus on Efficiency and Cost Optimization: The company's efforts to improve operational efficiency and optimize costs are being recognized as key drivers for their profitability.
Growth in Key Business Segments: Reports often highlight the growth in their express parcel and supply chain services.
Analyst Upgrades: Following the positive results, some analysts have upgraded their ratings and price targets for Delhivery.
Partnerships and Expansions: Any news regarding new partnerships or expansion of their network and services is usually viewed positively.
Key Factors to Monitor:
Breakout Sustainability: Watch if the price holds above the breakout levels with good volume.
Upcoming Q4 & FY25 Results: These will be crucial to confirm the sustainability of their profitability and provide further direction for the stock. Look for the announcement dates.
Operational Efficiency: Continue to monitor the company's progress in improving efficiency and reducing costs.
Competition and Industry Trends: Keep an eye on the overall logistics and e-commerce landscape in India.
In conclusion, the potential Trendline and Cup & Handle breakouts on Delhivery, coupled with the recent return to profitability, suggest a bullish outlook with your target of ₹410 within a 1 to 3-month timeframe. However, it's important to monitor the sustainability of the breakouts, closely watch the upcoming full-year results, and consider the overall market sentiment and industry dynamics.

XAU/USD 4H Chart Analysis – Wave 5 Setup in PlayHey traders! Just wanted to share this clean Elliott Wave setup I’m tracking on Gold (XAU/USD).
We’ve just completed what looks like a textbook Wave (4) correction, finding support right at the lower boundary of this long-term ascending channel. Price also respected the 38.2% Fibonacci retracement perfectly, lining up around the $3,090 level. That level is acting as a key demand zone right now.
🌀 According to the wave count:
Wave (3) topped out near $3,500
Wave (4) retraced sharply into the channel base
We are now potentially at the launch point for Wave (5) — the final impulse leg
💹 Wave (5) Projection:
Targeting the upper channel boundary, which aligns closely with $3,740–$3,750
This area also completes the measured move and matches key structural confluence
📈 Technical Confluence Supporting the Bullish Bias:
RSI bounced cleanly from oversold territory
Bullish EMA crossover (20/50) is happening right near the bounce zone
We’re also seeing a break of the corrective trend line, suggesting momentum is shifting back in favor of the bulls
📍 Key Levels to Watch:
$3,149: minor pullback area / possible retest
$3,283: Fib 23.6% resistance — needs to be cleared for confirmation
$3,500: Major resistance & previous high — breakout zone
$3,747: Wave 5 target
⚠️ Invalidation Zone:
If price breaks below $3,090, and especially $3,041, I’ll be reassessing the wave count. That would suggest a deeper Wave 4 or a breakdown in bullish structure.
📌 Conclusion:
I’m watching this setup closely. Gold looks poised for a strong upside leg if current levels hold. The structure is clean, momentum is turning, and we’ve got multiple confirmations in place. I’ll be scaling in with proper risk management and looking to ride this potential Wave 5 to new highs.
Drop your thoughts below — are you long on Gold? Let’s talk setups 👇
@WrightWayInvestments
@WrightWayInvestments
@WrightWayInvestments

EUR/USD Wave 5 Setup – The Calm Before the SurgeWe're tracking a potential Wave (5) extension on EUR/USD after a clean completion of Wave (4), which bounced right from the golden zone between the 0.382–0.5 fib levels.
🔍 Structure & Context:
Wave (4) bottomed at 1.1065, aligning with key fib confluence and RSI oversold bounce.
Price is now showing early signs of bullish momentum, currently trading just under 1.1200, above the 0.382 retracement.
If this count holds, we could be entering the early phase of a bullish impulse leg toward 1.1572 and possibly 1.1755 for Wave (5).
🧩 Technical Confluences:
✅ Fib retracement support (0.382–0.5) held strong
✅ Price reclaiming 20/50 EMAs; 200 EMA still overhead but flattening
✅ RSI recovering above 47, showing room for upside
✅ Minor resistance at 1.1272 → watch for breakout confirmation
🎯 Key Levels:
Entry Zone: 1.1150–1.1190
Wave 5 Target:
⚡ TP1: 1.1388 (0.618 ext)
⚡ TP2: 1.1572 (wave projection)
⚡ TP3: 1.1755 (extended target)
Invalidation: Break and close below 1.1045
📌 Plan: Looking for bullish continuation confirmation above 1.1225 with strong momentum. Tight risk with upside reward aligning beautifully with the wave structure 📈
💬 Let me know your thoughts on this count—bullish or premature?
📊 Drop a like if you're trading EUR/USD & follow for more wave-based setups!
@WrightWayInvestments
@WrightWayInvestments
@WrightWayInvestments

DHANI SERVICES MAY GIVE BREAKOUT SOONDhani Services is an Indian consumer business that operates through its app, Dhani. It provides a range of services, including digital healthcare, financial services, e-commerce, UPI payments, stock trading, and bill payments. The company was originally founded as Indiabulls Ventures Limited in 1995 but was later renamed Dhani Services Limited in October 2020.
SHORT TERM MAY TOUCH 69 TO 72 MARK.

DOGE → Retest of the panic zone. One step away from a downtrendBINANCE:DOGEUSDT.P is facing selling pressure. After distribution (pump), the price enters a correction phase (dump) and storms the panic zone, a breakout of which could intensify an uncontrolled decline.
DOGEUSDT squandered all the potential accumulated in late April and early May. The distribution ended in the 0.2600 zone, after which the coin entered a correction phase. At the moment, the coin is testing the panic zone of 0.21400
All attention is on the base of the triangle at 0.21400. This is the panic zone. When the support breaks, buyers will be liquidated, and sellers may increase sales, which could trigger a bearish momentum.
Resistance levels: 0.222, 0.2307
Support levels: 0.2145, 0.2135
The main idea is a continuation of the decline. The trigger is a breakdown of support at 0.2135 and consolidation of the price below this zone, only in this case will the price continue to fall.
!!! The structure will be broken if the price reverses and consolidates above 0.222 and confirms the bullish sentiment with price consolidation above 0.23, in which case we will again consider growth.
Best regards, R. Linda!

Trendline Breakout and Cup & handle breakout Confirmation - NBCCTechnical Analysis:
Current Price: ₹111.08 (Note: As of the market close on Friday, May 16, 2025, NBCC closed around ₹110.85 on the NSE).
Target: Your target of ₹140 suggests a significant potential upside.
Trendline Breakout: Breaking above a significant downtrend line indicates a potential shift in momentum to the upside.
Cup & Handle Pattern Breakout Confirmation: The confirmation of a breakout from a Cup & Handle pattern is a strong bullish signal, suggesting a likely continuation of an upward trend.
Time Frame: A 1 to 3-month timeframe is reasonable for these patterns to play out, assuming the breakouts are sustained.
Confirming the Breakouts:
Volume: It's crucial to have seen a noticeable increase in trading volume during both the trendline and the Cup & Handle breakouts. Strong volume adds significant validity to these signals.
Sustainability: The price should hold above the breakout levels in the coming trading sessions.
Potential Upside:
Target (₹140): Represents a potential upside of approximately 26% from the ₹111.08 level (or around 26.3% from the ₹110.85 closing price).
Quarterly and Yearly Results & EPS Comparison:
Based on the information available up to the latest reported quarter (December 2024) and the previous fiscal year (FY24):
Latest Quarter Result (December 2024): NBCC reported a consolidated net profit of ₹113.45 Crore, a significant increase of 60.81% compared to the same quarter last year (December 2023). Total income also increased by 17.25% to ₹2456.54 Crore.
Yearly Result (FY2024): For the full fiscal year ending March 2024, NBCC's total revenue stood at ₹7835.59 Crore, a growth of 10.75% compared to FY23. The profit after tax for FY24 was ₹277.66 Crore, a growth of 10.54% YoY.
EPS Comparison:
Quarterly EPS (December 2024): ₹0.63, compared to ₹0.39 in December 2023.
Yearly EPS (FY2024): ₹1.54, compared to ₹1.39 in FY23.
We will need the results for the quarter ending March 2025 (Q4FY25) and the full fiscal year ending March 2025 (FY25) for the most up-to-date comparison. These are expected in the coming weeks.
P/E Comparison:
Based on the closing price of ₹110.85 and the FY24 EPS of ₹1.54, the current P/E ratio is approximately 71.98.
According to some sources, as of May 17, 2025, the P/E ratio is around 59.8. The construction and infrastructure sector can have a wide range of P/E ratios depending on growth prospects and company specifics. While seemingly high, it could be justified if the market anticipates strong future earnings growth, as suggested by the recent quarterly results. We'll get a clearer picture with the FY25 EPS.
Corporate Action:
Dividend: For FY24, NBCC declared a final dividend of ₹0.14 per share. Investors will be looking for any dividend announcement that typically accompanies the full-year results for FY25.
Order Book: NBCC has been consistently securing new orders, which is a positive sign for future revenue and profitability. Keep an eye on any new order wins announcements.
Latest News (as of May 17, 2025):
Recent news around NBCC has been generally positive, focusing on:
Strong Q3FY25 Results (Dec 2024): The significant jump in profit was a key highlight, boosting investor confidence.
Order Wins: NBCC continues to secure new projects across various sectors, including infrastructure and real estate. These new orders provide revenue visibility for the coming quarters.
Focus on Execution: The market is often looking at NBCC's ability to efficiently execute its large order book. Any positive updates on project progress are usually well-received.
Government Initiatives: Being a government-owned entity, NBCC's performance is also linked to government spending on infrastructure and housing. Positive policy announcements in these areas can be beneficial.
Key Factors to Monitor:
Breakout Sustainability: Ensure the price holds above the breakout levels with sustained volume.
Upcoming Q4 & FY25 Results: These will be crucial in determining if the recent profit growth trend continues and will impact the P/E valuation. Look for the announcement dates.
New Order Wins: Any further significant order wins will act as positive catalysts.
Execution Progress: Updates on the progress of major projects in their order book will be important.
Market Sentiment: Overall market sentiment and the performance of the infrastructure and construction sectors will play a role.

Cup & Handle and the Trendline Breakouts - HUDCOTechnical Analysis:
Current Price: ₹233.86 (Note: As of the market close on Friday, May 16, 2025, HUDCO closed around ₹234.50 on the NSE).
Stop Loss: A closing basis stop loss at ₹214 provides a good level of risk management.
Targets: Your targets of ₹265 and ₹335 indicate significant potential upside.
Cup & Handle Pattern Breakout: This bullish continuation pattern suggests a likely move higher after a period of consolidation.
Trendline Breakout: Breaking above a significant downtrend line adds further confirmation of a potential shift in momentum to the upside.
Time Frame: A 1 to 3-month timeframe is reasonable for these patterns to play out, assuming the breakouts are sustained.
Confirming the Breakouts:
Volume: Ideally, both the Cup & Handle and the trendline breakouts should be accompanied by a noticeable increase in trading volume. This indicates strong buying interest and adds validity to the signals.
Sustainability: The price should hold above the breakout levels in the coming trading sessions. Any significant retracement below these levels could weaken the bullish case.
Potential Upside:
Target 1 (₹265): Represents an approximate 13.3% upside from the ₹233.86 level (or around 13.0% from the ₹234.50 closing price).
Target 2 (₹335): Represents a more significant potential upside of approximately 43.2% from the ₹233.86 level (or around 42.8% from the ₹234.50 closing price).
Quarterly and Yearly Results & EPS Comparison:
Based on the information available up to the latest reported quarter (December 2024) and the previous fiscal year (FY24):
Latest Quarter Result (December 2024): HUDCO reported a strong 18.84% increase in net profit YoY and a 13.38% increase in total income YoY.
Yearly Result (FY2024): HUDCO showed solid growth in both revenue (11.53%) and profit after tax (19.53%) compared to FY23.
EPS Comparison:
Quarterly EPS (December 2024): ₹3.51 (vs. ₹2.95 in Dec 2023).
Yearly EPS (FY2024): While various sources might have slightly different calculations based on adjustments, the yearly EPS for FY24 was around ₹13.22 (based on previous reports). Some sources also indicate a FY24 EPS of ₹10.57. We'll need the official FY25 full-year results for a precise year-on-year comparison. These are expected in the coming weeks.
P/E Comparison:
Based on the closing price of ₹234.50 and an estimated FY24 EPS of ₹13.22, the current P/E ratio is approximately 17.74.
Comparing this to the industry P/E for Housing Finance (which can fluctuate but is generally in the range of 15-30), HUDCO's P/E seems reasonable and not excessively high. We'll have a clearer picture of the valuation once the FY25 EPS is released.
Corporate Action:
Dividend: HUDCO has a history of paying dividends. For FY24, they declared a total dividend of ₹1.50 per share. Investors will be watching for any dividend announcement that typically accompanies the full-year results for FY25.
Key Factors to Monitor:
Breakout Confirmation: Strong volume on the breakouts is crucial.
Upcoming Q4 & FY25 Results: The financial performance in the latest quarter and the full fiscal year will be a significant driver for the stock price. Look for the announcement dates.
Government Policies: As a government-backed entity involved in housing and urban development, HUDCO's prospects are linked to government policies and spending in these sectors.
Market Sentiment: Overall market sentiment and the performance of the financial services and housing finance sectors will play a role.

GOLD → The fight for 3,200 continuesFX:XAUUSD has recovered after a bearish distribution. The price has returned to the range but continues to test the fundamental threshold of 3200.
The fundamental background has been gradually improving recently, which is putting pressure on the gold market, increasing the profit-taking ratio and the level of sales. After the resolution of the tariff war, all attention has shifted to the negotiations between Russia and Ukraine, and de-escalation could also reduce economic risks. As well as the escalation of the conflict in the Middle East...
Technically, the price is returning to the range after a deep false breakout but is facing strong resistance and pressure from sellers. Further developments depend on the 3200 level, which is of fundamental importance.
Resistance levels: 3225, 3236, 3257
Support levels: 3204 - 3200, 3194
The battle for the 3200 area continues, with bulls likely to try to keep the price above 3200, in which case the market may test the 0.5-0.7 Fibonacci zone. However, given the recent improvement in fundamentals, the price may return from these zones of interest to 3200 with the aim of continuing the assault to break through and continue the downtrend.
Best regards, R. Linda!

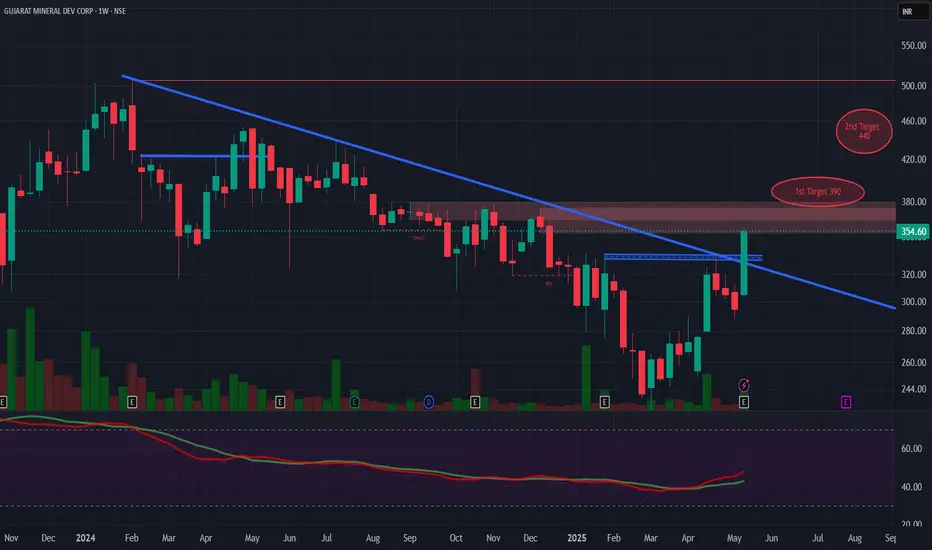
Cup & Handle and Trendline Breakout - GMDC LTDTechnical Analysis:
Current Price: ₹354 (Note: Live prices can fluctuate. As of the latest information available, GMDCLTD closed around ₹349.95 on May 16, 2025).
Targets: Your targets of ₹390 and ₹440 suggest a potential significant upside.
Cup & Handle Pattern Breakout: This is a bullish continuation pattern, and a breakout suggests a potential move higher.
Trendline Breakout: Breaking above a significant trendline also indicates potential bullish momentum.
Time Frame: A 1 to 3-month timeframe is a reasonable expectation for these patterns to play out, assuming the breakouts are sustained.
Confirming the Breakouts:
Volume: It's crucial to assess if the breakouts were accompanied by a noticeable increase in trading volume. Strong volume adds conviction to the validity of the breakouts.
Sustainability: Monitor if the price holds above the breakout levels in the coming trading sessions.
Potential Upside:
Target 1 (₹390): Represents an approximate 10.29% upside from the ₹354 level (or around 11.44% from the ₹349.95 closing price).
Target 2 (₹440): Represents a more significant potential upside of around 24.29% from ₹354 (or about 25.73% from ₹349.95).
Quarterly and Yearly Results & EPS Comparison:
Based on the available information (primarily data up to December 2024):
Latest Quarter Result (December 2024): GMDCLTD reported a rise of 26.39% in consolidated net profit. Sales also increased by 15.80% to ₹653.42 crore.
EPS (TTM - Trailing Twelve Months): The EPS for the trailing twelve months is around ₹20.97 (as per some sources).
To provide a more precise comparison of quarterly and yearly EPS, we would need the specific figures for the most recent quarters and the full financial year ending March 2025, which the company is expected to announce.
Key Factors to Monitor:
Breakout Confirmation: Watch for sustained price action above the breakout levels with good volume.
Upcoming Results: Keep an eye on the full-year results and any further quarterly results announcements, as these can significantly impact the stock price. The board meeting to consider these was held on May 15, 2025.
Sector Performance: The performance of the mining and minerals sector can also influence GMDCLTD.
Technical Indicators: Using other technical indicators like RSI and MACD can help confirm the bullish momentum.

AUD/USD 4H | Wave 2 Pullback in MotionAUD/USD is currently completing a corrective Wave (2) within a larger impulsive structure. After the peak of Wave (1) at 0.65145, price has been in a healthy retracement phase, now nearing key fib confluence zones.
🟣 EMA Confluence:
Price is reacting near the 100 & 200 EMA (0.6373–0.6394), which has acted as dynamic support throughout this structure.
We are currently holding above the 0.382 level, with the golden zone (0.618–0.705) sitting just below.
🔄 Bullish Continuation Scenario:
If the pair holds above 0.6285 and we see bullish confirmation candles, we may begin the next leg higher — Wave (3) — targeting 0.66250–0.66766 as initial projection zones.
📊 RSI:
The RSI is hovering just below the 50 level, showing temporary bearish pressure, but has room to recover if structure holds.
🧠 Plan:
📍 Watching 0.6285–0.6214 for final support
📍 Wave (3) target zone: 0.66500+
📍 Invalidation: Clean break and close below 0.6015
🔔 Wave (2) entries are where the patient traders shine. Eyes on structure, and let price do the heavy lifting.
@WrightWayInvestments
@WrightWayInvestments
@WrightWayInvestments

GOLD → Correction ahead of news. Will the decline resume?FX:XAUUSD has been buying back all the losses from the Asian and Pacific sessions since the opening of the European session, but this looks more like a catapult being loaded...
GOLD broke through the global consolidation base of 3200, which only confirmed the bearish market structure. Investors are waiting for PPI and retail sales data in the US, as well as Fed Chair Powell's speech.
Expectations of fewer Fed rate cuts and optimism surrounding trade talks with China and South Korea continue to weigh on gold. However, weak macro data and a growing US budget deficit could revive interest in this safe-haven asset.
GOLD is in a correction phase and is heading towards the zone of interest: the liquidity zone and previously broken support of global consolidation.
Resistance levels: 3187-3190, 3200
Support levels: 3123, 3100
Gold may test the indicated resistance, but based on the nature of the market, this situation may end in a false breakout and a fall. Target 3123 - 3100.
However, unpredictable data may temporarily change the market, which could lead to momentum towards 3220-3230.
Best regards, R. Linda!

HFCLHFCL showing trendline breakout with higher high pattern. Market participation has also increased since few sessions. Probability of new momentum rally is quite higher. It has also booked highest weekly volume since last 7-8 months.
