XAUUSD falls on easing geopolitical tensionsXAUUSD falls on easing geopolitical tensions
Gold fell below 3,380.00 on August 11 as reduced geopolitical tensions weakened its safe-haven appeal, following President Trump’s announcement of an August 15 meeting with Putin in Alaska to discuss ending the Ukraine war, potentially avoiding new U.S. sanctions on Russia. Losses may be capped by ongoing trade concerns, expected Fed rate cuts, and uncertainty over U.S. tariffs on gold bars after a recent agency ruling.
Technically, XAUUSD failed to hold an intermediate 3,380.00 level and develop a bullish momentum towards 3,440.00, which means the start of the sideways market in the asset. Next possible target is 3,000.00 level.
Trendpattern

XAU/USD Buy Setup 1H Analysis Trendline breakout.Instrument: Gold Spot / USD
Timeframe: 1H (1 Hour)
Chart Tools Used:
Ichimoku Cloud
Trendline breakout
Target projection (highlighted in blue arrow and price levels)
Volume not shown directly but momentum is clear from breakout
---
💹 Buy Setup Analysis
✳ Current Price: $3,362.895
🔼 Entry (Buy): Around $3,363.590 (as marked on the chart)
🎯 Targets:
Target Number Price Level Approx Gain % Move
1st Target $3,393.481 ~$30 ~0.89%
2nd Target $3,433.864 ~$70 ~2.06%
🔻 Stop-Loss (Suggested): Below Ichimoku Cloud, ideally near $3,315.860 or $3,322.672
---
🧠 Strategy Logic
The chart shows a clean bullish breakout of the trendline and Ichimoku cloud.
Strong upward momentum candle confirms the breakout.
Targets are based on measured move and previous resistance zones.
Volume and sentiment look bullish, aligning with the breakout.
A pullback to the breakout zone (~$3,340–$3,350) would be healthy for re-entry.
---
📝 Summary of Buy Setup
Parameter Value
Entry $3,363.590
Target 1 $3,393.481
Target 2 $3,433.864
Stop-Loss $3,322.672–$3,315.860 (zone below cloud)
Risk-Reward ~2:1 to 3:1 based on SL/TP choice

USD/JPY 4H –analysis Buy setupUSD/JPY (U.S. Dollar / Japanese Yen)
Timeframe: 4-Hour (4H)
Trend: Bullish Trendline Support – Price is respecting a strong ascending trendline.
Indicators: Ichimoku Cloud is visible; current price is above the cloud = bullish bias.
Current Price: Around 147.95.
---
✅ Buy Entry:
Entry Zone: Between 147.90 – 148.10
(As price is bouncing from the trendline support and Ichimoku cloud.)
🎯 Buy Targets:
1. Target 1: 148.99 (Previous structure resistance)
2. Target 2: 150.50 (Next resistance level)
3. Target 3 (Swing): 152.00+ (If momentum continues)
🛑 Stop Loss:
Below trendline + Ichimoku support = 146.80 (safe zone)
---
🔖 Chart Title Suggestion:
"USD/JPY 4H – Trendline Rebound with Bullish Momentum Targeting 150+"

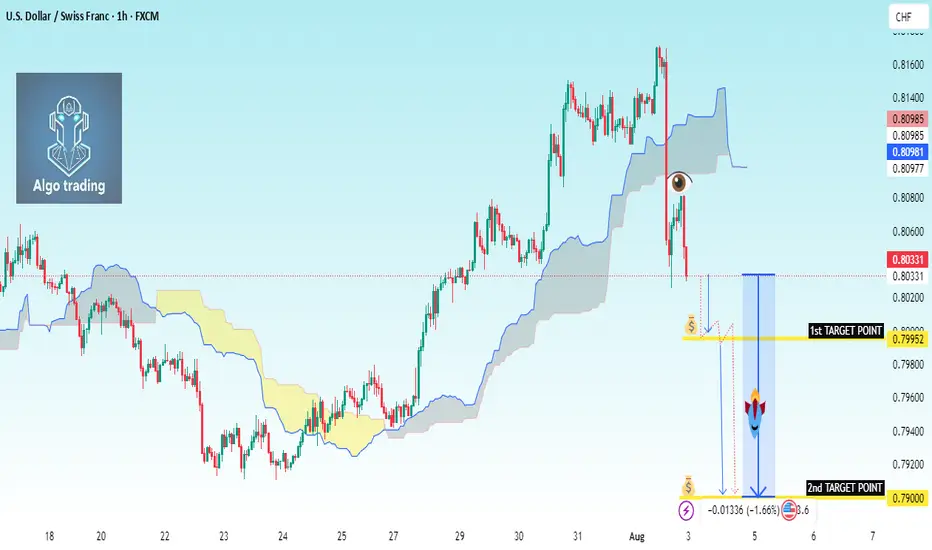
Sell Setup – USD/CHF (1H Timeframe)Chart Summary (1H – USD/CHF)
The pair was bullish, then got sharply rejected near 0.8100.
Price is now inside the Ichimoku Cloud, which means indecision.
Bearish signs:
Price failing to push back above cloud
Chikou Span (lagging line) is heading below candles
Flat Kijun-sen + bearish twist forming in the cloud
---
🔻 Sell Setup (Only Sell Focus)
📍 Sell Entry
Entry price: 0.7990
Reason: Break below Ichimoku cloud base and recent structure support
Confirmation of bearish move starting
🛑 Stop Loss
SL: 0.8055
Above the Kijun-sen and recent minor high
Protects against false breakdowns
🎯 Take Profit
TP1: 0.7950 – First nearby support
TP2: 0.7900 – Strong previous support area
---
📊 Trade Plan Summary
Component Price
Sell Entry 0.7990
Stop Loss 0.8055
Take Profit 1 0.7950
Take Profit 2 0.7900
---
✅ Entry Confirmation Checklist
Before entering the trade, confirm these:
❗ 1H candle closes below 0.7990
📉 Bearish candle shape (strong body, not a doji)
🟡 Chikou Span below price
☁ Cloud is red (future kumo bearish twisd
AUDUSD: Bearish Continuation from broken supportThe current setup is a clean example of a trend continuation play. Price recently broke decisively below a structure zone, this break and retest now flips the narrative, what once was a buy zone is now an opportunity for short entries.
Following the aggressive move down, price now began pulling back into that broken zone. The move appears corrective rather than impulsive, characterized by a slower, more rounded structure typical of pullback leg. This is classic behavior in continuation setups: fast drop, slow retrace, and then potential for the next leg lower.
The projected move targets a retest of the swing low at 0.63800. That level is significant, it's a level where prior demand reacted strongly and now it serves as the next probable magnet for price.
What makes this continuation trade high probability is the sharpness of the prior bearish impulse as it signals intent. The market seems to be in a controlled bearish sequence, where sellers dominate momentum and retracements offer fresh entries for trend followers.
The structure and zone alignment all point in the same direction continuation lower, not reversal.
Let me know in the comments what you think
Disclosure: I am part of Trade Nation's Influencer program and receive a monthly fee for using their TradingView charts in my analysis.

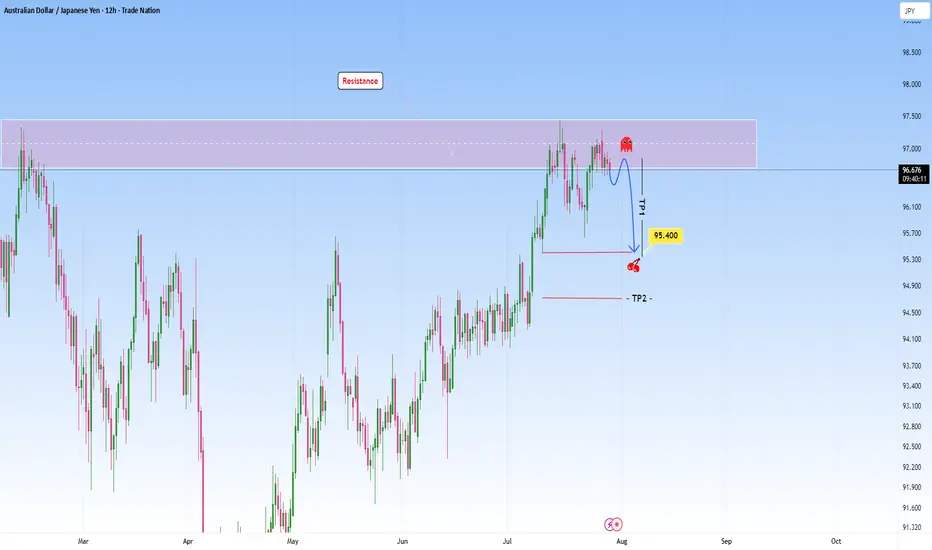
AUDJPY at Resistance: Could we see a reversal here?The market on this pair shows us a classic scenario where price presses into a resistance zone after a sustained bullish move. Price action approaching this zone appears hesitant, with smaller candles and wicks showing signs of exhaustion, meaning the possibility that buying momentum is weakening. There is a clear intention in this structure and I am anticipating a reversal here.
My first target (TP1) at 95.400 is placed just above a previous structure low and it’s a logical level for a partial exit, as price may pause or react there. The second target (TP2), placed even lower, hints at a full mean reversion idea targeting the origin of the previous bullish leg.
The setup requires patience, waiting for confirmation perhaps in the form of a strong bearish rejection before committing to the short. Overall, it’s a disciplined setup that mirrors the kind of analysis I like to gravitate toward: structured, simple and driven by high probability reversal zones.
Disclosure: I am part of Trade Nation's Influencer program and receive a monthly fee for using their TradingView charts in my analysis.
IPH 40% move coming?IPH has recently emerged from a descending wedge pattern, supported by bullish divergences in both the RSI and OBV, along with several divergences observed in shorter time frames. A pullback to the $5 level is anticipated, as the stock appears weaker on these smaller time frames. If IPH can maintain its position above the recent low of $4.40, it will indicate a structural shift, establishing higher highs and higher lows. My initial target is in the $6.50 range, followed by a potential move just above $7, representing a 40% increase. Good luck and happy trading 🍀

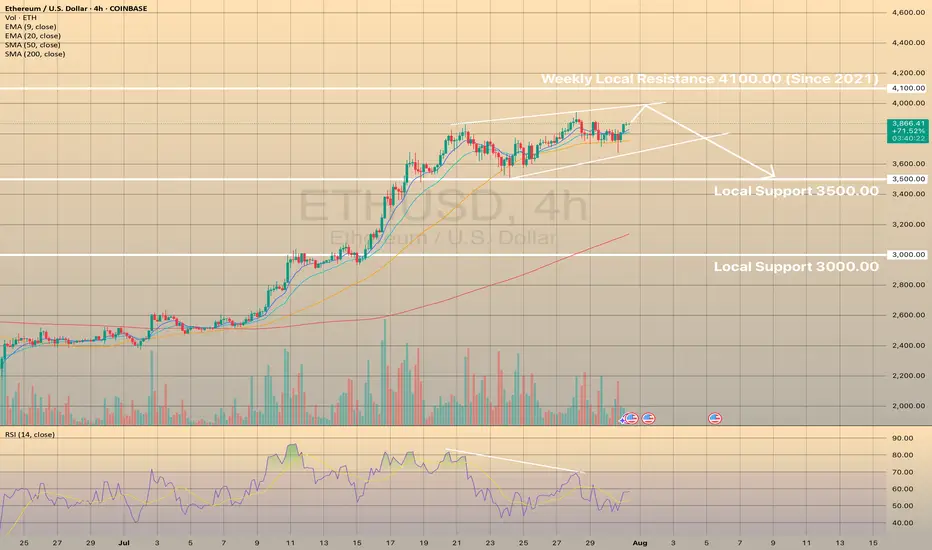
ETHUSD MAY FORM THE BEARISH WEDGE. THE PRICE IS GETTING READY TOETHUSD MAY FORM THE BEARISH WEDGE. THE PRICE IS GETTING READY TO DROP.
ETHUSD has been moving bullish since July 8. However since July 21 the price started to form the bearish wedge with bearish divergence on RSI on 4-h timeframe.
A bearish wedge is a bearish reversal pattern in an uptrend, where the price forms higher highs and higher lows within converging upward trendlines, signaling weakening bullish momentum and a potential downward reversal. To trade, identify the wedge with declining volume and confirm with RSI or divergence. Sell or short on a breakdown below the lower trendline with a volume spike. Set a stop-loss above the recent high or upper trendline. Target the wedge’s height projected downward from the breakdown or the next support level with a 1:2 risk-reward ratio.
We expect that the price will establish another bullish momentum and the price will go towards upper border of the wedge, slightly below the 4,100.00 resistance level and will decline towards 3,500.00 support level afterwards.
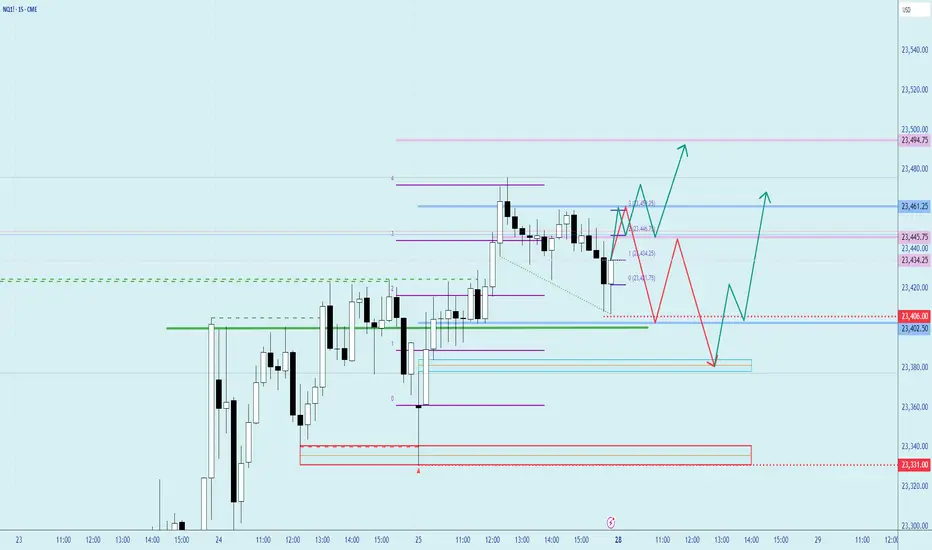
Bias is still Bullish However its month end Overall bias is still strong bullish, do note that its coming to end of month, either we pull back a bit or continues higher till end of month then pullback. Losing 23350 and 23300, probabilities of moving lower will higher since we had short squeeze move last Friday. Max Pain is 23020 can be use as a guide off futures movement.
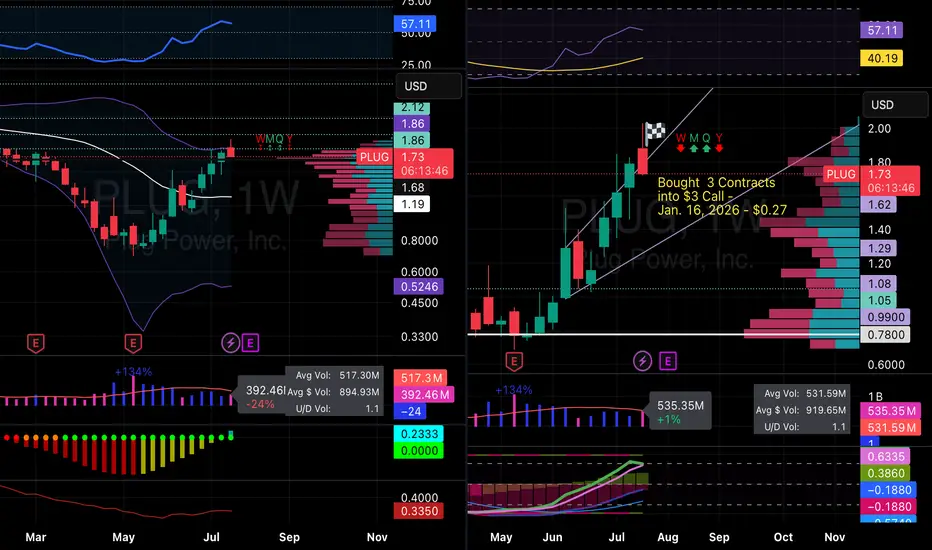
Plugged InIn looking at the money flow for NASDAQ:PLUG , I see the EMAs 8 day and 21 day crossing into a new uptrend. The RSI is still below the overbought territory. The weekly is down with volume pouring in to get ready for the next leg. Sellers are slowing with the MACD. Looking ahead the money in the past has flowed into PLUG in the winter, therefore winter contracts look well priced and primed for the future growth based upon today's information. Let's see where it goes.
Remember do your own due diligence and research. Past performance doesn't equal future performance.
EURNZD Continuation setup following recent bearish momentumThe market has recently pushed down with momentum.
Price attempted a timid "echo bounce" back into the broken support but was rejected, confirming this area now serves as area for bearish re-entries.
From what I can tell, we're entering the next leg of what I call the “Gravity Spiral Phase”, where sellers take over after taking a clear zone. Each wave down is not just a move, but a continuation of momentum migration into new bearish move.
Target: 1.93500
This level marks the next gravity anchor, a zone where price memory may attempt to stabilize, but only temporarily.

ADAUSDT - Buy or Regret!As clear and simple as the chart is… the target is just as clear and reliable.
ADA is showing strong bullish structure on the 3-day chart — breaking above the red trendline with a successful retest, and also breaking above the 100 EMA.
The blue trendline represents a strong hidden resistance level that many traders are overlooking.
The upside move is likely to end around the 0.786 Fibonacci level, which intersects with this blue trendline — in the $1.50–$1.70 range.
A strong project. A fundamentally sound coin that respects technical analysis.
A logical and high-probability target.
Best regards Ceciliones🎯

BAJAJ HOUSING FINANCE LTD GOOD TIME TO PICK IT Bajaj Housing Finance Ltd. (BHFL) is a prominent non-banking financial company (NBFC) in India, specializing in housing-related finance. It's a subsidiary of Bajaj Finance Ltd., and has been classified as an Upper-Layer NBFC by the RBI under its Scale-Based Regulations.
📊 Latest Financial Highlights (Q1 FY26 Preview)
- Assets Under Management (AUM): 1.2 lakh crore, up 24% YoY and 5% QoQ
- Loan Assets: 1.05 lakh crore, up 24.2% YoY
- Disbursements: 14,640 crore, up 22% YoY
- Net Profit (PAT): Expected to rise 19–21% YoY to 574–584 crore
- Net Interest Income (NII): Estimated to grow 24–28% YoY to 827–851 crore
- Net Interest Margin (NIM): Projected at ~3.2%, slightly compressed due to rate cuts
The company is well-positioned to benefit from the rising demand for housing loans, as more people seek to buy homes. With a focus on technology and customer service, BHFL is likely to enhance its operational efficiency, attracting more clients and growing its market share. As a result, the stock price of BHFL could rise, with steady growth by its expanding loan portfolio and strong brand recognition. In 2026, its share price target would be 253, as per our analysis.
SHORT TERM VIEW
entry - 119.50-123
stop loss - 117.60
target - 135-140

One last squeeze and NAS100 could explode into the next rallyThe NAS100 is currently coiling within a tight consolidation range, showing signs of tension building up. After a strong push upward, price has been moving sideways in a narrowing structure. This build-up around the high, a compression of buyers and sellers in a low-volatility squeeze could be an indication that we could use. This kind of price action typically signals that buyers are gaining control, squeezing out sellers with each dip.
The lack of deep pullbacks combined with increasingly shallow sell-offs shows fading bearish momentum. Which is often typical during a buildup phase before a breakout. If buyers can push price above with a strong close, it could trigger breakout momentum and lead to a continuation of the larger bullish trend.
Ideally, if price reacts positively and forms bullish confirmation, it would set up a solid continuation entry, with upside potential toward the next target of 23.400.
Until then, bulls are watching closely for signs of commitment. The breakout is yet to be confirmed, but the squeeze is on, and the pressure is building.
What will happen next?
Just sharing my thoughts for the charts, this isn’t financial advice. Always confirm your setups and manage your risk properly.
Disclosure: I am part of Trade Nation's Influencer program and receive a monthly fee for using their TradingView charts in my analysis.

$SNAP -- accumulation $8 into $9. big move brewing into earningsHello, extensive chart here: Daily and Weekly. Looking at this name I like the setup here. The Daily and Weekly chart shows strength in this area, $8 to $9 with heavy accumulation and support. The Weekly chart shows about 13 weeks of this bottoming area with tons of buying from previous years as well. NYSE:SNAP has earnings July 25th and I will be looking to enter $10 calls with a date of 8/15. The premiums could spike just into earnings since it is a popular name to play around that time and it has plenty of daily volume. The SMA and EMA on the weekly honestly is my target -- it is a big sell zone. We are in the liquidity area and have been. Will be starting a position on these contracts this coming week. This name should see $10 with relative strength but my first target is mid $12 before earnings. I would like to shed some contracts into the earnings date and see if we can make an extra buck or two on profited contracts so when earnings comes it can be a risk free stress free play.
WSL.

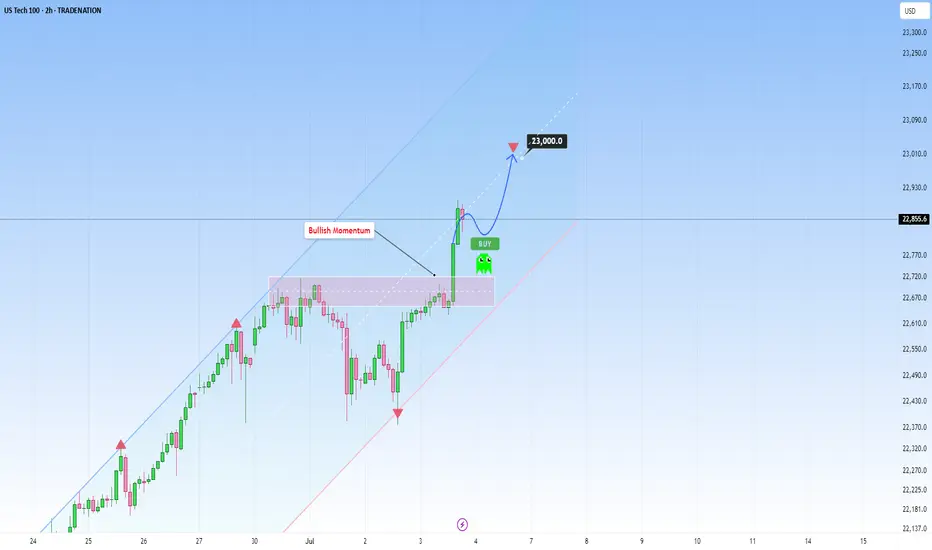
US100 rises sharply, with further upside target of 23,000At this stage, US100 continues to ride a dominant ascending channel structure, maintaining a consistent bullish structure supported by strong fundamentals as well as technical positioning.
The current price action reflects a high-confidence trend environment, underpinned by steady economic resilience in the U.S. tech sector and growing investor optimism surrounding AI-driven growth and corporate earnings. This alignment between structure and sentiment reinforces the strength of the current trend.
What’s especially encouraging is how the price has remained in the upper half of the ascending channel. Every corrective move has been shallow and absorbed quickly as well. This kind of behavior is exactly what you want to see in a strong trend.
From a structural perspective, the recent break of the prior swing high confirmed a bullish break of structure (BOS), reinforcing the broader uptrend. That’s a meaningful move, not just technically, but also psychologically, as it validates that bullish momentum remains intact and market participants are still positioning for higher levels.
No signs of weakness are showing up yet. If anything, the structure is intact and there’s no evidence of a shift in momentum. This makes it a good opportunity for traders who are "late to the party" to consider entering, as the trend still looks strong and continuation is likely.
As for upside targets, the 23,000 level is a natural extension. It aligns with the middle of the channel and fits within the current rate of expansion. If we don’t see any warning signs (like impulsive bearish candles), this target remains both technically justified and psychologically relevant.
Just sharing my thoughts on support and resistance, this isn’t financial advice. Always confirm your setups and manage your risk properly.
Disclosure: I am part of Trade Nation's Influencer program and receive a monthly fee for using their TradingView charts in my analysis.
War is a Racket | DFEN | Long at $28.00The war machine keeps turning. Profits will reign. Direxion Aerospace and Defense 3x AMEX:DFEN never fully recovered from pandemic lows, but world peace is (unfortunately) far from reach. The uptrend in the chart has commenced. Personal entry point at $28.00.
Target #1 = $37.00
Target #2 = $50.00
Target #3 = $64.00

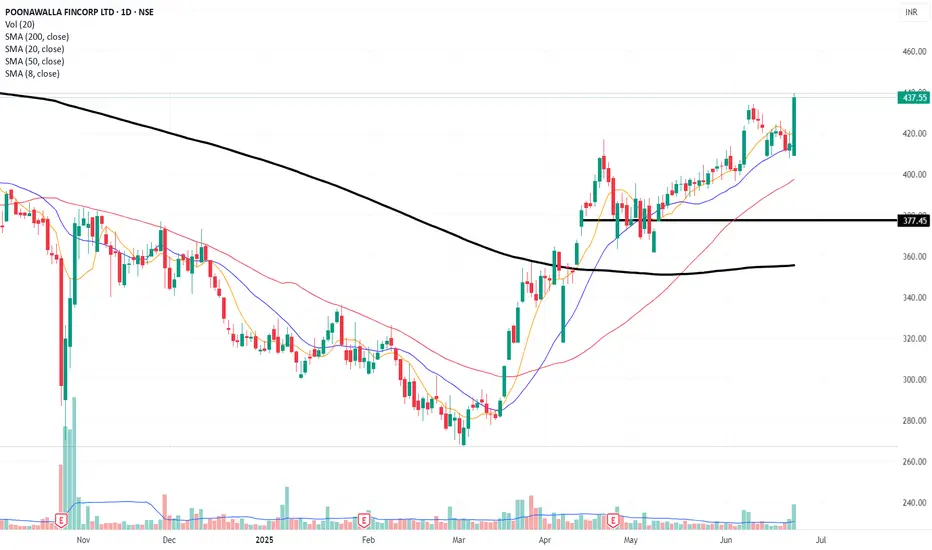
Poonawalla Fincorp Shows Strong Momentum: A Potential Buy Opport
Poonawalla Fincorp has demonstrated notable strength in its price movement over the past few weeks. After a brief retracement to its 20-day moving average (DMA), the stock has resumed its upward trajectory, accompanied by high trading volumes. This resurgence signals significant buying interest, indicating a potential opportunity for investors.
Given the stock's positive momentum, it is advisable to closely monitor Poonawalla Fincorp. A strategic entry point could be considered, with a stop-loss around ₹405. For potential gains, the stock has a target range of ₹475 to ₹500, offering a favorable risk-to-reward scenario.
Gold Outlook: 3 Critical Zones That Could Shape the Next Move▋Observation & Meanings:
▪Price has broken out of the Broadening Wedge to the upside — a strong move led by bulls.
▪It then pulled back after reaching the 100% projection of the previous upswing, which also marked the likely extent of the retracement.
▪A break below the minor low (a) suggests short-term downward pressure.
▪However, the overall uptrend structure remains intact as long as the main low (A) holds.
▋What’s next?
Trading a retracement is always tricky — by nature, it means going against the prevailing trend.
▪ Question 1 : Is there anything to do when price falls below the minor low (a)?
Often, the best move is to stay patient and let the market reveal its intentions, some setups may offer opportunities:
▫The main prior low could act as a key short-term support, as it aligns with the 100% retracement of the previous upswing.
▫For aggressive traders, a quick short toward that level may be an option.
▪ Question 2 : When will a new trend begin?
▫Bearish scenario: A confirmed break below the main prior low could signal the start of a more sustainable downtrend.
▫Bullish scenario: Aside from Aside from (1) a direct breakout above the previous high (B), signs of strength may also come from:
(2) A clear lower high or
(3) A consolidation range, followed by a strong upside break.
In this case :
- The prior high (by definition) marks resistance.
- However, there’s also a tight congestion area before that high, which may act as the real barrier — potentially even more significant due to its cluster of price action.
▫Once early trend signals appear, the next step is to assess if the structure supports a lasting trend.
▋The 3 big zones:
▪ Uptrend Zone
The market is likely regaining upward momentum when one of the following occurs:
1. Price spikes above the previous swing high at point B.
2. Price breaks the tight congestion area to the upside.
3. A new consolidation range forms and breaks to the upside.
▪ Downtrend Zone
A clean break below the main prior low (A) would likely confirm bearish control and may open room for further downside.
▪ Ambiguous Zone
If price fails to meet the conditions for either an uptrend or a downtrend, it’s likely to remain in a drifting, indecisive state.
▋Mental Notes:
▪Don’t predict the price, trade the price. Have a plan, but not blindly follow.
▪The market will always find ways to surprise. Stay open and follow the flow.
▋Not Financial Advice
The information contained in this article is not intended as, and should not be understood as financial advice. You should take independent financial advice from a professional who is aware of the facts and circumstances of your individual situation.

USDJPY H4 AnalysisUSDJPY Showing a Bearish Flag. If it breaks this zone above, Most probably can fly up to 148.668 and higher to 150.538. If no, Can rally between 143.981 or even lower to 142.410. Trading Analysis from 23-06-25 to 27-06-25. Take your risk under control and wait for market to break support or resistance on smaller time frame. Best of luck everyone and happy trading.🤗

USTECH H4 AnalysisUSTECH Showing a bullish Flag. If it breaks this zone above, Most probably can fly up to 22,106.35 and higher TO 23,200. If no, Can rally between 20,800, 20,400 or even lower. Trading Analysis from 23-06-25 to 27-06-25. Take your risk under control and wait for market to break support or resistance on smaller time frame. Best of luck everyone and happy trading.🤗

US30 H4 AnalysisUS30 Showing a bullish Flag to 42,762. If it breaks this zone, Most probably can fly upto 44,000 and higher. Trading Analysis from 23-06-25 to 27-06-25. Take your risk under control and wait for market to break support or resistance on smaller time frame. Best of luck everyone and happy trading.🤗

EURUSD – Follow-Up UpdateEURUSD traded above the 1.1573 level on Thursday, marking a second break to the upside following the earlier trend-changing pattern — a potential sign of bullish continuation.
However, on the 1H/M15 chart, we've observed a minor ABC corrective decline (pullback). We’re now watching for a break below 1.1511, which could signal the start of a short-term bearish move.
🎯 Short-Term Target:
The next key level is 1.1214, a weekly structural support zone and the low of the previous trend-changing pattern.
📌 Key Zones to Watch:
Bearish confirmation: Break below 1.1511
Medium-term target: 1.1214
Stay alert to price action around these levels.
Trade safe, and have a blessed weekend.
