ATG forming a right shoulder?Is this a textbook H&S pattern being formed? 643 is break out/neck line and 912 is the target. Looks like it and reversal will be know by September to November 2025.
This is not a solicitation to trade in ATG shares.
Trendreversal

Breakout on Vodafone?Looks like a Head and shoulders reversal, plus breakout this week. Too early to say though as it still needs confirmation. Could still be a fake-out?
This is not a solicitation to trade in Vodafone shares.

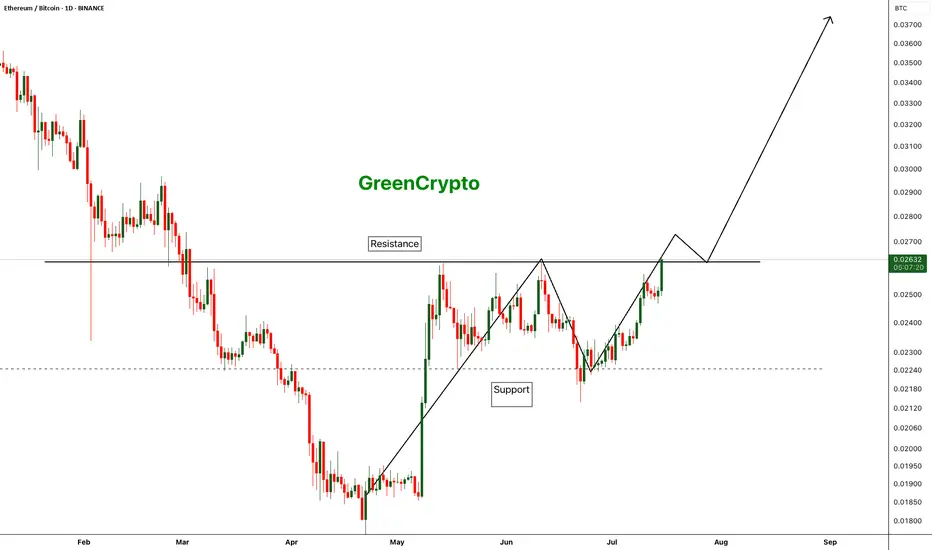
ETH/BTC - Finally Trend is reversing - After a long time we are finally seeing a change in the trend of ETH/BTC pair.
- Compared to BTC, ETH was underperforming for last couple of years and we are seeing some strength in ETH
- If this trend continue we can finally see some new ATH on ETH
Entry: 0.02633
StopLoss: 0.02125
TP1: 0.02825
TP2: 0.03168
TP3: 0.03592
Don't forget to keep stop loss. Stay tuned for more updates
Cheers
GreenCrypto
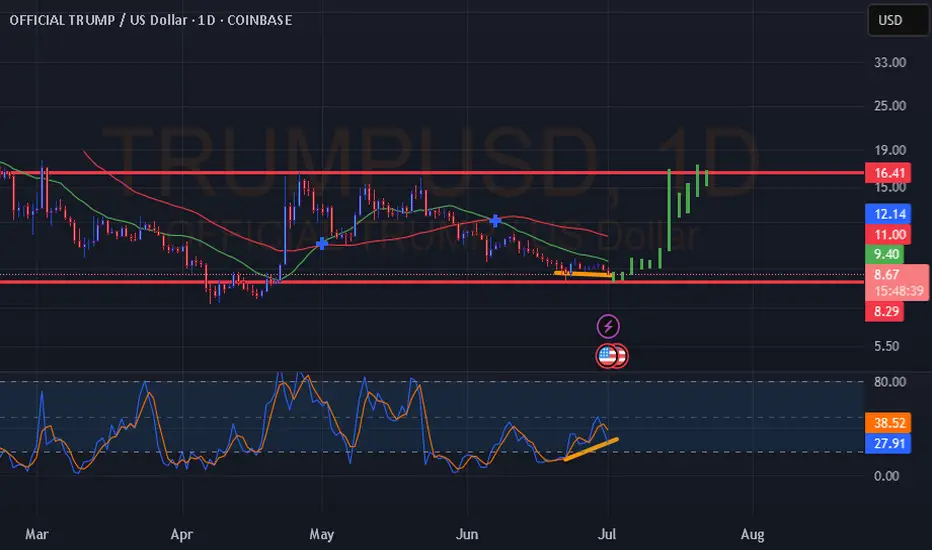
TRUMP USD Bullish DivergenceHi Everyone. TRUMP showing some strength here. Could be an overall price reversal starting off as indicated. Not financial advice. Good luck.
Volume Spread Analysis - Understanding Traps & ConfirmationDespite the fact that the so-called “Big Players” in the game of ups and downs we call the market have the power to manipulate it in ways some cannot even imagine, what they ultimately seek is a healthy market. I’ve mentioned in previous posts that the market behaves like a living organism — and like any organism, it must be healthy in order to grow.
In simple terms, the traps institutional players set are there because they need cash flow — liquidity — to achieve that growth. But why do they need to use traps at all? The answer lies in the numbers: one institutional player is equivalent to hundreds, if not thousands, of uninformed or poorly trained retail traders. So, to sustain growth, they are not just inclined but sometimes forced to create traps.
Now imagine this: in a market with enormous capital, one big player is equivalent to 100 retail traders. If 25% of those traders were skilled — truly good at the game — think of how much more cash flow would occur, and how much healthier and more stable that growth could be.
But don’t be fooled — while big players may benefit from a small portion of skilled retail participants, it’s not their actual goal. Still, it wouldn't hurt them either, as long as liquidity and volatility are preserved. In fact, a higher percentage of skilled players could deepen liquidity and reduce the need for extreme manipulation.
However, if too many retail traders become skilled, the game tightens. Profit margins shrink. The edge that institutions hold becomes harder to maintain. And in such a scenario, consistent profitability becomes more difficult — for everyone.
As I’ve emphasized in previous ideas, there is a way to understand institutional traps — and one of the keys is learning how to interpret the Relative Strength Index (RSI) properly. However, since RSI is by nature an oscillator, its signals require confirmation. And what better tool to use for confirmation than Volume — specifically through the lens of Volume Spread Analysis (VSA)?
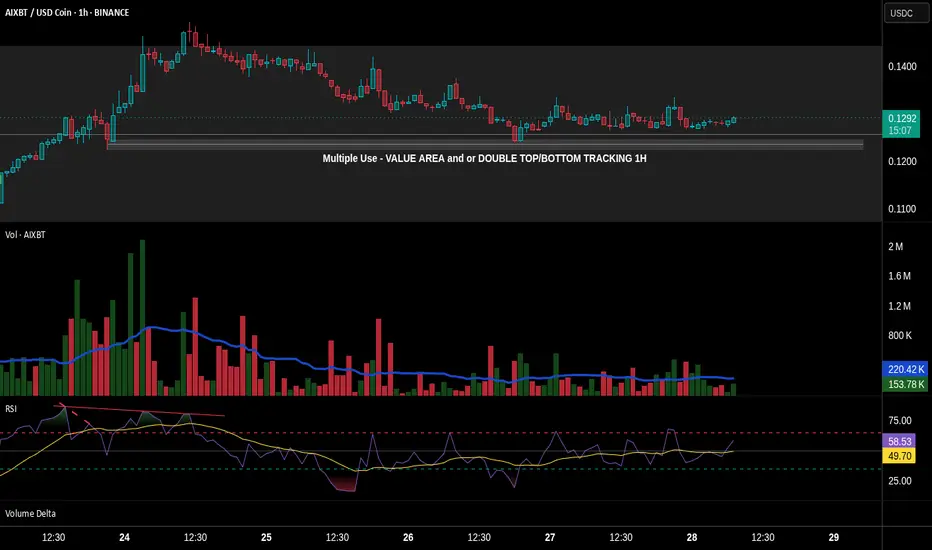
In this post, we’ll partially explore how these traps are revealed, using basic tools available on TradingView. We'll also uncover a potential trap in the chart of AIXBT/USD Coin from Binance, using the 1-hour time-frame.
🔹 1. Pre-Top Volume Cluster
Let’s begin at the very top of the chart. Just before this top, we can spot a bullish volume cluster — four consecutive volume spikes with rising price. In VSA, such a cluster often suggests that the current trend is reaching exhaustion.
⚠️ Important Note: Not all clusters mark a reversal. Even if we see one or two bearish candlesticks after-ward — even if they are engulfing — that alone does not confirm the reversal. The real signs are already present in the volume indicator.
As I’ve said in the past, in previously posted ideas: Big Players always leave footprints. Learning to read those footprints is the language every serious retail trader must eventually understand. And one of the clearest footprints is what we’ll discuss next.
🔻 2. The Buying Climax
A Buying Climax is a tell-tale sign of professional distribution — it appears (in our case) as a large bullish volume spike accompanied by a bearish candlestick, signaling the potential end of a rally.
In our AIXBT/USD Coin chart, we observe two buying climaxes:
• The first comes at the end of the bullish volume cluster, followed by a bearish candle.
• The second follows right after, repeating the same bearish confirmation.
🧠 Even though price was making a new Higher High — these repeated climaxes on increasing volume suggest supply is entering the market, and the uptrend is likely unsustainable.
✅ Conclusion
This is just one piece of the larger puzzle, but even basic tools like RSI and Volume, when read in the context of structure and intent, can reveal traps set by institutional hands. The more we train ourselves to see these signs, the closer we get to trading in harmony with the market’s true rhythm — not against it.
Now let’s take a look at another signal that hints at a possible reversal. But before we continue, keep in mind: what I’m about to describe doesn’t always play out in the simplified way I’ll mention here. The market behaves differently at any given moment — so this kind of analysis always requires a careful and adaptive approach.
This time, I’m referring to a smaller bearish cluster, made up of three volume spikes, each of them clearly above the 20-period Moving Average — and appearing just before the bullish cluster I highlighted earlier.
• The fact that the first spike in this bearish group breaks above the MA is a strong signal that bearish pressure is stepping in.
• The fact that all three spikes remain above the MA adds weight to that signal.
However — and this is crucial — just like I mentioned before, this alone doesn't confirm a reversal. It still requires confirmation.
Even though this smaller bearish cluster forms a new low, and even though it aligns with a bearish RSI divergence marked with a dashed trend line, it’s not a signal to enter a trade. Why? Because volume confirmation is missing. And that's exactly why RSI alone isn't enough. It can point to weakness — but not confirm the turn.
True confirmation only comes with the next bullish volume spike, which:
• a) breaks above the MA,
• b) is higher than the first bearish spike in the previous cluster,
• c) appears with an engulfing candlestick, and
• d) is supported by an RSI plot that follows the move.
This collective behavior — the interaction between price, volume, and momentum — is not random. It’s one of the many harmonies that exist in the market’s structure. And learning to recognize these harmonies is key to understanding when the market is genuine — and when it's trying to trap you.
🔚 Conclusion
All of this leads me to one conclusion — based not just on theory, but on direct experience.
We’ve all seen the countless videos across platforms where retail traders explain things like RSI divergences as if they’re guaranteed signals. But the truth is: not all of these videos are made by successful traders — and blindly following them can be dangerous.
Early in my trading journey, I made that exact mistake. I followed those “educational” videos without question, and nearly blew my account in the process.
Can you imagine what would happen if someone entered a trade solely based on the divergence we discussed — without waiting for confirmation?
If you’ve followed this chart example to its end, you already know the answer.
Worse, this kind of psychological frustration often leads to even bigger mistakes — especially if you haven’t applied one of the simplest protective tools: the Stop Loss. And sadly, many traders skip it.
So let this be a reminder:
A divergence is not a signal. Confirmation is everything.
Let’s now take things a step deeper — by partially revealing something that remains known only to a small circle of elite traders.
Something that’s rarely discussed in public — yet sits hidden in plain sight.
Many traders know that Volume Spread Analysis (VSA) is based on the teachings of Richard Wyckoff and expanded through Tom Williams in Master the Markets. And yes — the most of VSA’s power comes from those principles.
But that’s only part of the story. What did these two big names revealing in secret code using multiple paragraphs and terminologies, but purposely do not reveal it in simple words in a few lines. And they are doing the right thing. Because if I said to myself that if everyone knew that then the market might crashed, then for sure they had that thought as well
What truly sets VSA apart, and what gives it its real power, is that it operates in two distinct languages.
🧩 The Hidden Language of VSA — What Most Don’t See
Let’s now go a step deeper — by partially revealing something known only to a few traders who’ve spent enough time observing the market beyond surface-level signals.
Something that’s often overlooked, yet has always been in plain sight.
We all know that VSA stands for Volume Spread Analysis.
And we commonly refer to “spread” as the distance between the open and the close of a candlestick. This is what many traders fixate on — the relationship between price movement and volume.
But that’s only part of the story.
What did names like Wyckoff and Tom Williams really reveal?
They spoke in code — long paragraphs, obscure terminology, layered ideas — never quite saying "this is the hidden key" in a few plain words.
And they were right to do so.
Because I’ve thought the same thing myself:
If everyone knew this… if it was simplified and passed around like a hack… the market could collapse into chaos.
If I’ve had that thought, I’m certain they did too.
So instead, they left trails. Patterns. Puzzles.
They left the second language in the open — but made sure only those with patience, discipline, and time in the charts would ever truly hear it.
There are things the open and close can’t tell you, but...
That… is part of what I meant earlier when I said VSA speaks in two languages.
Some of you already sense what I’m pointing toward.
For the rest — keep watching.
You’ll know it when you see it.
And once you do, you’ll never unsee it again.
Let’s begin with what most traders already know.
We say "spread" in VSA to refer to the range between the open and the close of a candlestick. This spread, in relation to volume, tells us whether a candle shows strength or weakness.
• A wide spread on high volume may signal professional activity.
• A narrow spread on high volume could suggest absorption or hidden effort.
This is the first language — the most commonly taught, and the most widely shared.
But what about the second?
Here's where things get interesting.
Let’s revisit our AIXBT/USD Coin chart, and specifically the large engulfing candlestick that forms around 18:30, just after the very top.
Now ask yourself:
• 🔍 Where did this candle open?
• 📍 What previous zone did it revisit or retest? What’s the story behind on that retest?
• Have you noticed the macro scale Hidden bearish divergence between RSI & PA?
What you're seeing is not just a rejection.
It’s a trigger zone — a price level left behind earlier by institutional activity.
This candle, with its precise open, combined with the volume behavior, is no coincidence. It's not just a rejection — it's a setup, part of a pre-engineered trap. By stealing what Tom Williams said: Big players are simply saying to uninformed traders – “thank you for your money”.
The interaction of price levels over time, the zones formed by previous activity, and how volume behavior aligns with those zones to signal intent.
Most traders never see this and even fewer can interpret it.
Why This Matters
That engulfing candlestick is not just a visual cue — it's a multiple level footprint.
It confirms everything we discussed earlier about how the market is manipulated — often in ways most traders can’t even begin to imagine. Two opposite forces within a zone. One prevails while the other reveals a future!
So now, let this sink in:
To truly master VSA, one must learn to read both languages.
The visible structure, and the hidden context.
One without the other is incomplete.
Now you know why Confirmation is so crucial.
That’s all for now. I hope that all the above paragraphs were able to give you a hint of how things work! And remember: Everything I write is just a small glimpse of the whole that needs to be considered.
Until next time — stay safe, trade wisely, and never stop learning.
Good move is expected soonhi fellas,
The Weekly trend of cochin shipyard is solid and bullish.
At daily timeframe there is a swing whose target can be till the weekly resistance level as mentioned in the chart.
The risk : reward ratio is 1:3.87
Enter after the daily candle closes above 2243.70
SL and target is mentioned in the chart.

Gold (XAUUSD) – Lower TF Wave (B) Top in Place? Higher TF Conflu⚠️ Price has now completed what appears to be a clean 5-wave advance into the key supply zone — potentially completing wave ((C)) of (B) on the lower timeframe.
• Wave ((ii)) = expanding flat
• Wave ((iv)) = expanding triangle
• Final ((v)) push into supply with RSI/MACD divergence
A breakdown below 3435 could confirm the reversal into wave (C). Downside fib targets align around 3400, 3350, and 3280.
A marginal high can’t be ruled out, but structure is now favouring bears short term.

ABFRL at Best Support !!This is the Weekly Chart Of ABFRL .
ABFRL having good Law of Polarity at 70 range.
ABFRL having EMA support at 72 range
If this level is sustain , we may see higher price in ABFRL ||
Based on time-wise analysis, our initial expected return is 40–42%, which the stock consistently forms beyond the Law of Polarity (LOP).
Thank You !!

Equity Research Flash – Hexaware Technologies Ltd.CMP: ₹722.35 | Bullish Momentum Post Trend Reversal
HEXT shows a bullish breakout from a falling trendline, with RSI near 60 and strong volume uptick. The price reclaimed the 0.5 Fibonacci level, eyeing next targets at ₹749.85 (0.618) and ₹793.35 (0.786). Fundamentally strong with robust revenue growth, improving ROCE (26.4%), and low debt. A move above ₹750 could trigger further upside. Accumulate on dips with SL at ₹688.
Recommendation: Positive | Buy on Dips Near ₹700
For Education Purpose only

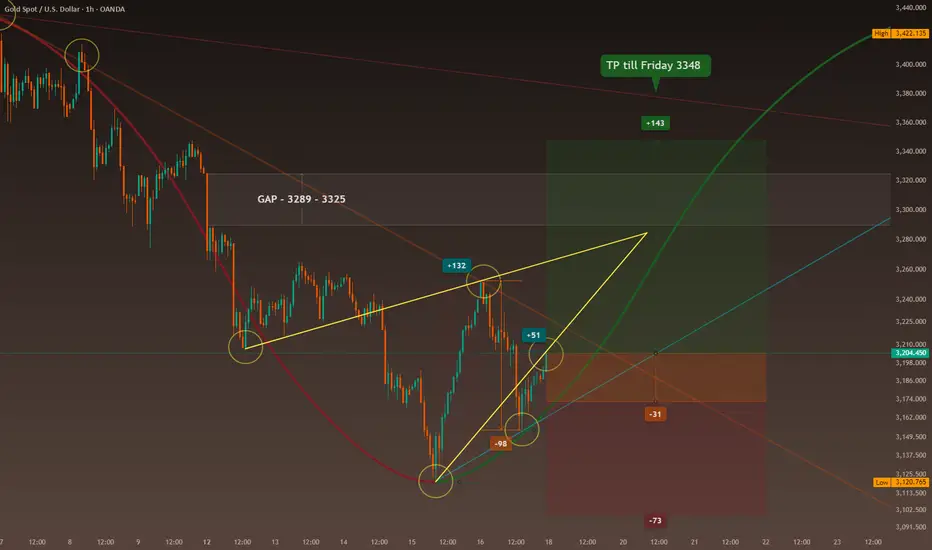
Smells Like a Trend ReversalWeekly Recap – Gold Market
Monday, May 12, 2025
The week began with a sharp GAP during the Asian session (starting around 1:00 AM London / 8:00 PM New York on Sunday) :
Gold dropped abruptly by $60, from $3,325 to $3,266.
The catalyst was a temporary easing of trade tensions between the U.S. and China, following weekend negotiations that led to a 90-day tariff pause.
During the European session (starting at 8:00 AM London / 3:00 AM New York) , the downtrend continued, pushing the price further down to $3,207.
Tuesday–Wednesday, May 13–14
Between these two sessions, the price consolidated within a narrow range of $3,265 to $3,202 (63 $ range).
Despite better-than-expected U.S. inflation data, there was no significant breakout—the market remained indecisive.
Wednesday, May 14 – European Session
The price continued its descent, falling from $3,243 to $3,168—a $75 drop—indicating persistent downward pressure despite macroeconomic stability.
Thursday, May 15
The Asian session (1:00 AM London / 8:00 PM New York) began quietly, with a range between $3,168 and $3,192.
Then a sharp drop to $3,123 followed (down $71), triggered by new statements from President Trump, who announced potential trade deals with India, Japan, and South Korea.
In the European session (8:00 AM London / 3:00 AM New York) , a strong reversal occurred.
After failed peace negotiations between Russia and Ukraine in Istanbul, and due to growing geopolitical uncertainty plus a weakening dollar, gold surged by $132, from $3,120 to $3,252.
Friday, May 16
The Asian session opened slightly bearish, with gold dipping from $3,252 to $3,218.
However, bullish momentum returned during the European and U.S. sessions, continuing Thursday’s upward trend and adding $51 by day’s end.
📰 Geopolitical News Landscape
India / Pakistan
Since the Kashmir terror attack on May 9, 2025, tensions have escalated again.
Cross-border airstrikes and border closures have resumed. A fragile ceasefire, brokered by the U.S., is under pressure.
Disputes over water rights further strain relations.
➡️ Short-term outlook: high tension remains.
Gaza Conflict
On May 9, Israel launched Operation Gideon’s Chariot against Hamas, aiming to dismantle the group and rescue hostages.
Over 300 deaths have been reported. A leaked plan suggests Gaza will be divided into three heavily controlled zones.
The humanitarian situation is catastrophic (over 53,000 deaths since 2023).
Peace talks are underway in Doha, but the situation remains dire.
➡️ No relief in sight.
Russia / Ukraine
Direct talks were held in Istanbul for the first time in three years.
While a prisoner exchange (1,000 each side) took place, no substantial progress was achieved.
Russia demands Ukrainian troop withdrawals from contested areas—Kyiv refuses.
Simultaneously, Russian attacks intensified, including drone strikes on Sumy.
➡️ A ceasefire remains unlikely in the near term.
U.S.–China Trade War
A 90-day tariff pause was announced the weekend before May 12:
U.S. tariffs cut from 145% to 30%
Chinese tariffs reduced from 125% to 10%
Markets reacted positively at first—especially in retail and shipping sectors.
➡️ However, unresolved structural issues (e.g., tech transfers, export controls) keep tensions fragile.
No comprehensive deal is in sight.
⚖️ Trump vs. Powell
Tensions escalate between President Trump and Fed Chair Jerome Powell:
- Trump demands aggressive rate cuts
- Powell warns of inflation risks
- The Fed holds the interest rate steady at 4.25–4.5%
- A 10% staff reduction is planned at the Fed for “efficiency”
➡️ The growing political interference is increasing market instability.
📉 U.S. Inflation – April 2025
The official inflation rate dropped to 2.3%, the lowest since February 2021.
However, consumer inflation expectations soared to 7.3%, the highest since 1981.
The University of Michigan Consumer Sentiment Index fell to 50.8—a historic low.
➡️ A clear gap between perception and data is emerging.
📊 Technical Analysis – Short-Term
Since May 12, an open GAP exists between $3,289 and $3,325 (36 $ range)
A V-shaped reversal formed from the low on May 15 ($3,120) to the Friday close ($3,204)
Symmetrical triangle formation suggests a convergence around $3,284 (possible by Tuesday)
➡️ Current trading range: $3,172 to $3,285 (113 $ range)
💡 Outlook for Monday, May 19
Time-Zone-Based Expectations:
Asia session (starting 1:00 AM London / 8:00 PM New York Sunday):
👉 Potential retest of $3,154
Europe session (8:00 AM London / 3:00 AM New York):
👉 Bullish outlook toward $3,234
U.S. session (2:30 PM London / 9:30 AM New York):
👉 Possible continuation of bullish move — open-ended potential
📌 Trade Setup – Monday 8:00 AM (London) / 3:00 AM (New York)
If price is below $3,154 → I stay flat and wait for clear signals
If price is above $3,172 → I consider a long position, unless conflicting news emerges
🎯 Weekly Target
My goal for the week is $3,348, provided the U.S. Dollar Index (DXY) holds near the 100-point level.
🧠 Conclusion
I am increasingly convinced that news-driven trading delivers the best results—if one can properly interpret the signals.
🔢 Fibonacci Levels
1h chart: low $3,131 → high $3,500 (April 22)
Levels: 0.315, 0.382, 0.5
1h chart: low $3,131 → high $3,435 (May 6)
Levels: 0.315, 0.382, 0.5
1h chart: low $3,131 → high $3,252 (May 16)
Levels: 0.315, 0.382, 0.5
-------------------------------------------------------------------------
This is just my personal market idea and not financial advice! 📢 Trading gold and other financial instruments carries risks – only invest what you can afford to lose. Always do your own analysis, use solid risk management, and trade responsibly.
Good luck and safe trading! 🚀📊
BTCUSD Rectangle Pattern Breakout + Bearish Retest & Target🧩 Chart Overview
This chart captures a well-defined rectangle continuation pattern forming within a rising channel on the 1-hour timeframe. This setup is a classic combination of horizontal and diagonal price structure interaction, offering valuable insights into potential market behavior and trade opportunities.
🧱 Structure Breakdown
Rectangle Pattern: Price action was trapped in a sideways consolidation phase between the resistance zone (~104,800 - 105,400) and the support zone (~101,200 - 101,800).
This rectangle followed a strong bullish rally, which often implies a continuation pattern. However, the lack of follow-through from bulls near the resistance led to repeated failures to break out, suggesting weakening momentum.
Rising Channel: Within this rectangle, price respected a rising trendline support and resistance structure, forming a parallel ascending channel.
Bearish Breakout: The significant event occurred when BTC broke down below both the horizontal support of the rectangle and the lower boundary of the rising channel, triggering a structural shift from bullish to bearish.
🔁 Retesting Phase – What’s Happening Now
After the breakdown:
Price pulled back toward the prior support zone, which is now acting as resistance (a classic example of the support-turns-resistance principle).
This is commonly referred to as a retest, which validates the breakout and offers a lower-risk entry point for traders looking to short.
The retest area (around 101,500 - 102,000) is crucial. If price fails to reclaim this level and prints bearish confirmation (e.g., rejection wick, bearish engulfing candle), it increases the probability of downward continuation.
🎯 Trade Setup (Short Bias)
Entry Zone: 101,500 – 102,000 (on retest rejection confirmation)
Stop Loss: Above 103,000 (above prior highs and invalidation point)
Target 1 (TP1): 99,347 – key psychological and horizontal support level from prior structure
Target 2 (TP2): 97,277 – measured move of the rectangle height projected downward, aligning with previous demand area
This setup offers an attractive risk-to-reward ratio, assuming proper trade management and confirmation-based entry.
📊 Additional Technical Confluences
Bearish Momentum: The aggressive breakdown candle shows strong seller interest and increased volatility.
Volume: If confirmed with high selling volume during the breakdown and low buying volume during the retest, the move gains more credibility.
Trend Reversal Signals: The break of the channel and the rectangle support indicates potential trend reversal from short-term bullish to bearish.
RSI & Momentum Indicators (optional): Traders may use tools like RSI or MACD to confirm momentum shifts during retest.
📉 Psychological and Price-Level Significance
101,500 was a strong intraday support zone throughout the consolidation phase. Once broken, it flips polarity and acts as resistance.
The round-number level of 100,000 is always a psychological magnet for BTC. It often acts as a bounce or breakout zone, so traders should watch price behavior near this area closely.
Deeper demand may emerge around 97,000 – 96,500, which can serve as an extended target or reaccumulation zone depending on broader market conditions.
⚠️ Risk Management & Final Thoughts
This setup is high-probability only if the retest confirms rejection. Avoid early entries or assumptions before confirmation.
Always use proper stop-loss placement to avoid whipsaws or fake-outs.
Manage position sizing based on account size and risk tolerance.
News events or macro data can override technicals, so be aware of upcoming economic releases or sentiment shifts.
🧵 Conclusion
Bitcoin is showing clear signs of short-term weakness following the breakdown of a long-standing consolidation range within a rising channel. The ongoing retest provides an ideal area for short positioning, with clearly defined invalidation and profit targets.
✅ If bears defend the retest zone, expect downside continuation toward 99.3K and possibly 97.2K.

Supply Zone Rejection & BOS Confirm Downtrend ContinuationAfter a clean shift in structure marked by a CHoCH and subsequent BOS, price retraced into a clear supply zone—offering a high-probability short setup. Here's how the setup unfolded:
🧠 Trade Rationale
Break of Structure (BOS): Price broke below a key higher low, confirming a bearish structure.
Change of Character (CHoCH): Signaled the end of bullish momentum earlier in the sequence.
Supply Zone: Price retraced into a well-defined supply area (aligned with imbalance and prior support turned resistance).
Entry: Short taken as price tapped into the supply and failed to make a new high—further confirmed by a lower timeframe CHoCH.
Target: Aiming for the next BOS level below, aligning with clean equal lows/liquidity draw.
🔍 Key Concepts Highlighted
Structure-based trading with CHoCH and BOS labeling.
Supply zone entries based on price action confirmation.
Risk-to-reward driven decision-making (tight SL above supply, TP near next demand).
💬 What do you think? Do you wait for confirmation within supply, or enter at touch?
Let’s discuss—drop your thoughts and feedback!

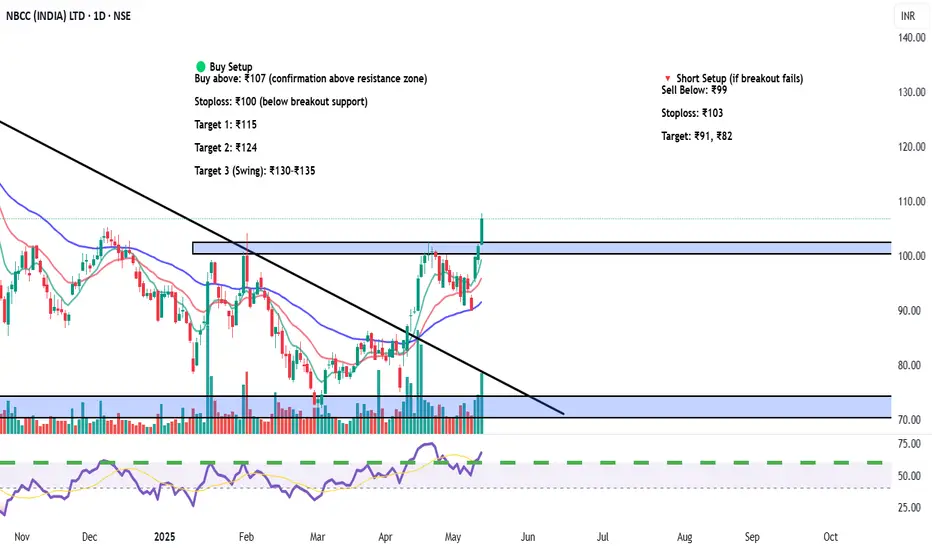
NBCC (India) Ltd (NSE: NBCC) – Breakout Trade Setup🧾 Equity Research Summary – NBCC (India) Ltd.
Sector: Construction & Infrastructure – Government PSU
Technical Setup: Trendline breakout + Base retest + Volume surge
Support Zone: ₹68–₹75
Breakout Zone: ₹100–₹103
Upside Potential: Strong move expected due to order book + infra push
Catalyst:
Government infrastructure spending
Order wins from CPWD, NBCC contracts, redevelopment projects
📅 Timeframe: Short-to-Medium Term (2–4 weeks)
📊 Risk-Reward: 1:2.5
🟢 Buy Setup
Buy above: ₹107 (confirmation above resistance zone)
Stoploss: ₹100 (below breakout support)
Target 1: ₹115
Target 2: ₹124
Target 3 (Swing): ₹130–₹135
🔻 Short Setup (if breakout fails)
Sell Below: ₹99
Stoploss: ₹103
Target: ₹91, ₹82
For Education Purposes Only
Bull Trap – The Real Drop May Just Be Starting! (Crash Ahead?)The market appears to be gaining bullish momentum, giving the impression that the bear market is over—but what if it’s just getting started?
On this CRYPTOCAP:TOTAL chart, the current price action seems to mirror the 2021–2022 bear market cycle: a rally to new highs, a sharp drop, a deceptive recovery (bull trap), followed by a deeper correction and eventual accumulation.
If this pattern plays out again, we could be in the bull trap phase—right before a significant and unexpected drop.
What do you think?
Will history repeat itself, or are we heading to new highs?
Drop your thoughts in the comments!
Please support this idea with a LIKE👍 if you find it useful🥳
Happy Trading💰🥳🤗

BTC/USD Forming Bullish Falling Wedge – Potential Target📐 2. Technical Pattern – Falling Wedge
A falling wedge forms when the price consolidates between two converging downward-sloping trendlines. It suggests diminishing selling pressure and a likely reversal.
Key Characteristics in This Chart:
Upper Resistance Trendline: Formed by connecting the series of lower highs.
Lower Support Trendline: Formed by connecting the lower lows.
The price respects both boundaries, confirming wedge structure.
Volume generally decreases during the wedge (implied but not shown).
✅ Bullish Implication: Once price breaks above the upper resistance, it often triggers a sharp upward move due to the squeeze of supply and the build-up of demand.
🧱 3. Support and Resistance Zones
🔻 Resistance Zone:
Area: ~100,000 to ~108,000 USD
Marked as a wide horizontal band (beige-shaded area).
Previous price peaks and consolidations suggest this zone is strong supply.
Breakout above this zone could trigger momentum towards the higher target.
🔹 Support Zone:
Area: ~72,000 to ~75,000 USD
Historical reaction level where buyers previously stepped in.
Coincides with the lower wedge boundary and recent bounce points.
Repeated tests strengthen this as a reliable accumulation zone.
🎯 4. Trade Setup Strategy
💼 Entry Strategy:
Trigger: A confirmed breakout above the wedge’s upper trendline (black diagonal line).
Confirmation: A strong bullish daily close above the trendline, ideally with volume spike.
The current price (~77,130) is near the lower boundary—offering a potential early entry or low-risk setup with a tight stop.
📌 Stop-Loss Placement:
Level: 70,916 USD
Below the wedge’s lower support and beneath the broader support zone.
Ensures exit if the pattern fails or bears regain control.
🧭 Target Projection:
Target Price: 114,562 USD
Based on the height of the wedge projected from the breakout point, a standard wedge breakout measurement.
Aligns with historical highs and psychological resistance.
🧮 Risk-Reward Ratio: Assuming entry around 77,130:
Risk (Stop-Loss): ~6,200 points
Reward (Target): ~37,432 points
R:R Ratio ≈ 1:6 – Highly favorable
⚙️ 5. Market Psychology & Price Action Insight
The falling wedge pattern suggests exhaustion of sellers.
Buyers are defending the support zone aggressively—creating higher lows within the wedge.
Each bounce is slightly more aggressive, indicating growing bullish sentiment.
A breakout from the wedge could act as a catalyst for rapid price acceleration as sidelined bulls enter and shorts cover.
📊 6. Summary of the Setup
Component Detail
Pattern Falling Wedge (Bullish)
Timeframe 1-Day Chart
Entry Point Breakout above upper trendline
Stop Loss 70,916 USD
Target 114,562 USD
Support Zone 72,000–75,000 USD
Resistance Zone 100,000–108,000 USD
Risk/Reward Approx. 1:6
Bias Bullish
📌 Final Thoughts
This setup provides a technically sound opportunity with clear invalidation (stop loss) and a well-defined profit target. The risk-to-reward ratio is attractive, and the price structure suggests a bullish reversal is likely, pending a confirmed breakout.

EUR/GBP Analysis Double Bottom Breakout Toward TargetOverview of the Chart
This chart displays a EUR/GBP daily timeframe setup, highlighting a Double Bottom Pattern, a well-known bullish reversal formation. The pattern consists of two consecutive lows at a similar price level, followed by a breakout above a key resistance zone. This setup suggests a potential trend reversal from bearish to bullish.
Technical Analysis Breakdown
1. Double Bottom Formation (Reversal Signal)
Bottom 1: The first low was established after a prolonged downtrend, where the price found support and bounced higher.
Bottom 2: Price revisited the same support area but failed to break lower, indicating that sellers are losing strength and buyers are stepping in.
A double bottom pattern signals that the asset is forming a strong base and is likely to move higher after breaking the neckline (resistance level).
2. Support and Resistance Levels
Support Level (~0.8322):
This level acted as a demand zone, preventing further downside.
It marks the price area where buyers accumulated positions, leading to a reversal.
Resistance Level (~0.8500):
This level previously acted as a supply zone, where sellers controlled the price.
A breakout above this level is crucial to confirm the bullish trend continuation.
3. Breakout Confirmation & Retest Expectation
The price successfully broke above the resistance zone, confirming a bullish reversal.
A potential retest of the broken resistance (now turned support) could occur before further upside movement.
Traders often wait for this retest to confirm that the breakout is genuine before entering a position.
4. Price Target Projection
Based on the measured move strategy, the expected target is calculated by measuring the height of the double bottom pattern and projecting it above the breakout zone.
Target Price: 0.8742, aligning with historical resistance levels.
5. Stop Loss Placement
Stop loss at ~0.8322 (below the double bottom support).
This ensures risk is managed in case of an invalid breakout or a false move.
Trading Plan & Execution Strategy
📌 Entry Strategy:
✅ Breakout Entry: Buy after the breakout above resistance.
✅ Retest Entry: Wait for a pullback to the previous resistance (now support) before entering.
📌 Risk Management:
🔹 Stop Loss: Placed below the recent support at 0.8322 to limit downside risk.
🔹 Take Profit: First target at 0.8742 based on the double bottom structure.
📌 Market Outlook:
A successful breakout and bullish momentum could push prices toward the target.
If the price fails to hold above the breakout zone, a deeper retracement could occur before continuing higher.
Conclusion
The EUR/GBP pair has formed a bullish double bottom reversal pattern, signaling a potential uptrend continuation. The key levels to watch include 0.8500 (resistance turned support) and 0.8742 (target projection). Traders should monitor price action around the breakout zone for confirmation and consider risk management strategies before entering a position.

XAUUSD Head & Shoulders Breakdown – Bearish Target Ahead?This chart represents a detailed technical analysis of Gold Spot (XAU/USD) on the 1-hour timeframe with a structured trade setup based on a Head and Shoulders (H&S) reversal pattern. Below is an in-depth explanation of the chart components, price action, and trade strategy.
1️⃣ Key Chart Patterns and Analysis
A. Head and Shoulders Pattern (Bearish Reversal)
This is a well-known bearish reversal pattern that signals a potential trend change from bullish to bearish. It consists of three peaks:
Left Shoulder: A rise followed by a temporary pullback.
Head: The highest peak in the pattern, showing strong buying pressure before reversal.
Right Shoulder: A smaller rise compared to the head, indicating weakening bullish momentum.
B. Neckline (Support Level) and Breakdown Confirmation
The neckline (horizontal support level) is drawn across the lowest points between the shoulders.
A break below the neckline confirms the reversal, triggering a bearish move.
The chart suggests price is at the neckline zone, preparing for a breakdown.
2️⃣ Trendline and Support/Resistance Analysis
A. Uptrend Trendline Break
The price was following a strong ascending trendline (dotted black line).
A trendline breakout has occurred, indicating potential trend reversal.
This supports the bearish bias further.
B. Resistance and Support Levels
Resistance Level: Marked at the top of the Head region, which aligns with previous price rejection zones.
Support Levels:
First support (TP1 - 3,053.269): This is the first potential take profit level.
Second support (TP2 - 3,030.556): The next target if price continues downward.
3️⃣ Trade Setup & Risk Management
A. Entry Point (Short Position)
Sell (Short) after the neckline breakout, ensuring bearish momentum is confirmed.
B. Take Profit (TP) Targets
TP1: 3,053.269 (Initial support target).
TP2: 3,030.556 (Stronger support zone, deeper profit target).
C. Stop Loss Placement
Stop Loss: 3,150.726 (Above the resistance zone).
This is a logical stop-loss placement, allowing price fluctuations without prematurely stopping the trade.
4️⃣ Overall Market Sentiment & Trade Bias
Bearish Bias: Due to the formation of the Head and Shoulders pattern, trendline breakout, and weakening bullish momentum.
Confirmation Needed: A strong bearish close below the neckline increases probability of downward continuation.
5️⃣ Final Thought – A High-Probability Trade Setup
If neckline breaks, the trade is valid with potential for a 3%+ downside move.
If price holds above the neckline, the pattern may fail, leading to reconsidering trade execution.
This structured risk-managed approach ensures a strategic entry, controlled risk, and maximized profit potential. 📉🔥 Let me know if you need further refinements! 🚀

Double Bullish Divergence Flashing on $SPY and $QQQWe’re spotting a double bullish divergence across two major indices: the S&P 500 ( AMEX:SPY ) and the NASDAQ 100 ( NASDAQ:QQQ ).
On both daily charts:
Price is making lower lows, signaling continued downward pressure.
Meanwhile, the RSI is forming higher lows, revealing a potential loss of bearish momentum.
This kind of setup often precedes a trend reversal or strong relief bounce, especially when observed across multiple indices at once. The fact that both AMEX:SPY and NASDAQ:QQQ are flashing the same signal gives added confluence and strength to this potential move.
Divergence = a potential bullish signal
Watch for confirmation: break of previous highs or strong bullish candles.
Caution: divergences don’t always play out — wait for confirmation before going long.
Are we looking at the bottom forming? 👀
Stay alert. A shift in sentiment could be underway.

EUR/GBP Bullish Breakout from Falling Wedge – Buy Setup!Introduction
This EUR/GBP 4-hour chart analysis presents a high-probability bullish trading setup based on a falling wedge breakout. A falling wedge is a reliable bullish reversal pattern, signaling that selling pressure is fading, and buyers are regaining control. The price has now broken out of the wedge, confirming potential upside momentum.
This setup provides a well-defined entry, stop-loss, and target level, allowing traders to capitalize on the bullish breakout while maintaining a proper risk management strategy.
1. Chart Pattern: Falling Wedge (Bullish Reversal)
The primary pattern on the chart is a falling wedge, which is a bullish reversal pattern that forms after a downtrend. It is characterized by converging downward-sloping trendlines, indicating that sellers are gradually losing momentum.
🔹 Key Characteristics of the Falling Wedge Pattern:
Lower highs & lower lows within a narrowing price range.
Decreasing selling pressure, indicating a potential shift in trend.
A bullish breakout above the upper trendline confirms a reversal.
Typically followed by a strong price surge, aiming for previous resistance levels.
The price action confirms this pattern as it broke above the wedge's upper boundary, signaling the start of a bullish trend.
2. Key Technical Levels & Market Structure
🔹 Resistance Level (Target) – 0.84183
This level marks a previous strong resistance zone, where the price faced rejection multiple times.
It serves as the primary profit-taking area for this setup.
A successful breakout and close above this level could lead to further upside movement.
🔹 Support Level – 0.83154
This is the major demand zone where price previously bounced.
Strong buying pressure emerged at this level, leading to the recent breakout.
It serves as an important level to define risk and set stop-loss orders.
🔹 Stop-Loss Placement – Below 0.83154
A stop-loss is placed slightly below the support zone, ensuring a logical exit if the market reverses.
This prevents unnecessary losses while allowing room for normal price fluctuations.
🔹 Entry Point Consideration
Ideal entry: Around 0.83700, just after the breakout confirmation.
Confirmation: A strong bullish candle closing above the wedge.
3. Trade Execution Plan: Long Setup
📌 Trade Idea – Bullish Setup
📈 Buy Entry: 0.83600 – 0.83700 (After wedge breakout)
🎯 Target: 0.84183 (Major resistance level)
❌ Stop-Loss: 0.83154 (Below support level)
🔄 Risk-to-Reward Ratio (RRR): ~1:1
📊 Risk Management Strategy
Trade with discipline: Never risk more than 1-2% of your capital per trade.
Adjust position size: Based on risk tolerance and account balance.
Use trailing stops: To secure profits if price continues upward.
4. Market Sentiment & Price Action Analysis
Prior Uptrend: The price previously had a strong bullish rally, indicating overall bullish strength.
Corrective Move: The market entered a falling wedge correction, allowing for a healthy pullback before resuming the trend.
Breakout Confirmation: The breakout above the wedge's upper trendline confirms bullish momentum.
📊 Factors Supporting a Bullish Move:
✅ Breakout confirmation above the wedge pattern.
✅ Higher buying volume supporting the move.
✅ Support level holds strong, preventing further downside.
5. Trading Psychology & Risk Considerations
⚠️ Key Considerations Before Entering the Trade:
✔ Wait for confirmation – Ensure a strong breakout candle before entering.
✔ Avoid chasing the price – Enter at a reasonable pullback level post-breakout.
✔ Monitor economic events – Watch for news that could impact EUR/GBP volatility.
✔ Follow a strict risk-reward ratio – Stick to your predefined stop-loss and target.
6. Conclusion – Bullish Outlook
This falling wedge breakout on EUR/GBP suggests a bullish reversal, offering a high-probability long trade setup. The price is expected to move towards the 0.84183 resistance level, with 0.83154 as the key stop-loss level.
✅ Bias: Bullish
🎯 Target: 0.84183
❌ Stop Loss: 0.83154
📊 Risk-to-Reward: ~1:1
📌 TradingView Idea Title & Description
Title:
🚀 EUR/GBP Falling Wedge Breakout – Bullish Move Incoming!
Description:
📈 Bullish breakout confirmed! EUR/GBP has broken out of a falling wedge, signaling a trend reversal. A long position above 0.83600 targets the 0.84183 resistance level with a stop-loss at 0.83154. Watch for strong bullish momentum! 📊💹
💡 Risk Management: Stick to your stop-loss, and don’t chase price action. Manage your trade wisely! 🔥

JPY/USD 4H Chart Analysis – Head & Shoulders Breakdown & BearishThis detailed technical analysis covers a Head & Shoulders pattern formation on the 4-hour chart of JPY/USD, highlighting a potential bearish reversal setup. The pattern suggests a shift from an uptrend to a downtrend, supported by a trendline breakdown and key resistance & support levels.
1️⃣ Understanding the Chart Pattern: Head & Shoulders (H&S)
📉 What is the Head & Shoulders Pattern?
The Head & Shoulders (H&S) is a classic bearish reversal pattern that appears after a prolonged uptrend, signaling a shift in market sentiment from bullish to bearish. It consists of three main parts:
Left Shoulder: A peak followed by a retracement.
Head: A higher peak, indicating the last strong bullish attempt.
Right Shoulder: A lower peak, failing to reach the height of the head, showing weakening momentum.
Neckline: A crucial support level that connects the lows of the shoulders. A confirmed break below this neckline is the trigger for a bearish continuation.
📊 Breakdown of the Pattern in This Chart
Left Shoulder (First Peak): The price made a high and then pulled back.
Head (Higher Peak): The market made another higher high but failed to sustain it, indicating exhaustion.
Right Shoulder (Lower Peak): A weaker attempt to push higher, but price failed to break previous highs, confirming the loss of bullish strength.
Neckline Breakout: The dotted trendline shows the ascending support that was eventually broken, confirming bearish momentum.
2️⃣ Key Technical Levels & Market Structure
Understanding the important levels in the market is crucial for setting up an effective trade.
🟧 Resistance Zone (Supply Area)
The resistance level, marked in a beige box, is located around 0.006800.
Price was rejected multiple times from this zone, confirming strong selling pressure.
The head of the pattern was formed in this region before a sharp drop.
🔵 Support Level (Neckline & Demand Area)
The neckline of the Head & Shoulders pattern was acting as support before being broken.
This level was tested multiple times before the final breakdown.
Once broken, it turned into a resistance level, meaning price may pull back to this area before continuing downward.
📉 Trendline Breakout (Bearish Confirmation)
A dashed trendline was previously supporting the uptrend but was broken, confirming the bearish shift in market structure.
This signals a trend reversal and a possible extended move lower.
3️⃣ Trading Strategy & Execution
A well-planned entry, stop loss, and take-profit strategy is essential for managing risk effectively.
📌 Entry Strategy (Short Setup)
Ideal Entry: Look for price to pull back to the neckline (previous support turned resistance).
Confirmation: Watch for bearish candlestick patterns such as:
Bearish engulfing
Pin bar rejection
Shooting star
Lower highs forming near the neckline
A rejection in this zone confirms seller dominance and a high-probability short setup.
📌 Stop Loss Placement
The Stop Loss is placed above the right shoulder at 0.006725.
This ensures protection from false breakouts or unexpected bullish moves.
📌 Profit Target Projection
Take-Profit Target: The projected move suggests a target at 0.006493.
This aligns with previous structural support, increasing its significance.
The measured move for Head & Shoulders suggests that price could fall further after confirmation.
Risk-Reward Ratio
The Risk (Stop Loss): Around 50 pips.
The Reward (Profit Target): Around 180 pips.
This results in a Risk-Reward Ratio of approximately 1:3, making it an attractive trade.
4️⃣ Market Sentiment & Expected Price Movement
📉 Bearish Scenario (Most Likely)
Price retests the neckline but fails to break above it.
Sellers step in, rejecting the resistance level, leading to further downside.
Price targets the next major support at 0.006493, completing the Head & Shoulders move.
📈 Bullish Scenario (Alternative)
If price reclaims the neckline and moves back above 0.006725, the pattern is invalidated.
This could lead to a bullish continuation back toward previous highs.
In this case, traders should cut losses early and avoid forcing a short trade.
5️⃣ Risk Management & Best Practices
1️⃣ Position Sizing:
Risk only 1-2% of your account per trade to maintain long-term profitability.
2️⃣ Confirmation Before Entry:
Wait for price to reject the neckline resistance before entering short.
Avoid entering too early without clear bearish signs.
3️⃣ Monitor News & Fundamentals:
Major economic events, interest rate decisions, or central bank announcements could impact JPY/USD price action.
🔎 Final Conclusion: Bearish Outlook on JPY/USD
The Head & Shoulders breakdown signals a trend reversal from bullish to bearish.
The neckline breakout confirms seller control over the market.
The best short entry is on a pullback to previous support (now resistance).
Target at 0.006493, with a Stop Loss at 0.006725 ensures controlled risk.
📢 Trading Bias: Bearish 📉
💡 Watch for a retest & rejection before entering short.

Trend Reversal in Play?After a strong bearish channel that lasted several weeks, the market has finally broken out of the resistance level — a key technical signal. This breakout was followed by higher lows and higher highs, suggesting a possible shift in momentum. 📈
Volume has also increased noticeably around the breakout zone, which can signal stronger conviction from buyers. The question now is: Are we entering a new uptrend?
As long as the price holds above the broken resistance (now acting as support), bulls could take control. Traders should keep an eye on key support zones and potential continuation patterns to confirm the trend reversal.
👉 What do you think — new rally or a bull trap?

USD/JPY Bullish Reversal (Inverse Head & Shoulders)📌 Pattern: Inverse Head & Shoulders
📌 Analysis: The chart showcases an inverse head and shoulders pattern, a classic bullish reversal formation. The price has successfully broken out of the downward trendline, indicating potential upside movement.
🔹 Left Shoulder: Formed during the previous retracement.
🔹 Head: The lowest point of the pattern, marking strong support.
🔹 Right Shoulder: Completed with a breakout above resistance.
📈 Trading Plan:
✅ Entry (Buy): After a confirmed breakout and possible retest.
🎯 Target: 153.988 - 154.672 (2.74% potential gain).
🔻 Support: 149.883 - 148.837 (Stops should be placed accordingly).
📊 Conclusion:
If the price maintains above the breakout level, we may see a strong rally toward the resistance target. Watch for volume confirmation and pullback retests before entering a trade.

EUR/GBP Chart Analysis – Double Bottom Reversal & Breakout Setup1. Market Structure & Context
The EUR/GBP daily chart presents a well-defined double bottom reversal pattern, indicating a potential trend shift from a prolonged downtrend to an uptrend.
The pair has been in a bearish phase, as reflected by the descending trendline.
However, price action suggests a possible trend reversal, as buyers are stepping in near a key demand zone.
A successful neckline breakout would confirm the bullish reversal, potentially leading to significant upside movement.
2. Key Chart Patterns & Technical Levels
A. Double Bottom Formation (Bullish Reversal Pattern)
The double bottom is a powerful reversal pattern, often signaling the end of a downtrend. It consists of two similar low points, forming a "W" shape.
Bottom 1: The first low was established around 0.8200 - 0.8250, where buyers initially stepped in to push prices higher.
Bottom 2: Price retested this demand zone, but sellers failed to push it lower, confirming a strong support level.
Bullish Significance: The inability of sellers to break below the support zone suggests the exhaustion of selling pressure and increasing buy-side interest.
B. Neckline Resistance & Potential Breakout Zone
The neckline resistance is drawn around 0.8450 - 0.8500, a key level where previous price rallies were rejected.
A breakout above this zone, ideally with strong bullish volume, would validate the double bottom pattern and trigger a bullish breakout trade.
C. Descending Trendline Breakout Attempt
The long-term downtrend resistance (trendline) has been holding since mid-2024.
Price is currently testing this trendline; a clear breakout and retest would add further confidence to the bullish bias.
3. Trade Setup & Execution Plan
A. Entry Strategy
There are two possible entry strategies, depending on risk appetite:
Aggressive Entry: Buy immediately upon a breakout above 0.8500, anticipating a strong rally.
Conservative Entry: Wait for a breakout + retest of the neckline before entering, ensuring confirmation.
B. Stop Loss & Risk Management
Stop Loss (SL): Placed below the recent swing low at 0.82029.
This level acts as the last line of defense for bulls; if price drops below it, the bullish thesis is invalidated.
C. Take Profit (TP) Targets
TP1: 0.86122 (first resistance zone, a previous swing high).
TP2: 0.87284 (higher resistance level, next supply zone).
These levels serve as potential profit-taking areas where sellers may re-enter the market.
4. Additional Technical Confluences Supporting Bullish Bias
✔ Key Support Zone Holding Strong – The price has bounced twice from the demand zone (0.8200 - 0.8250), confirming strong buyer interest.
✔ Volume Confirmation Needed – A breakout with high volume increases the probability of sustained bullish momentum.
✔ RSI & Momentum Indicators – If RSI crosses above 50, it would further confirm bullish momentum, supporting the breakout trade.
✔ Favorable Risk-to-Reward Ratio (RRR) – A well-defined stop loss & take profit strategy ensures an optimal trade setup.
5. Summary & Final Trading Plan
Current Market Bias: Bullish if neckline breaks (Double Bottom Confirmation).
Entry Confirmation: Look for a breakout above 0.8500 with strong volume.
Profit Targets:
TP1: 0.8612
TP2: 0.8728
Stop-Loss Level: Below 0.8202 to protect against fake breakouts.
🚀 Final Tip for Traders:
Monitor price action & volume closely. A breakout without volume may lead to a false move. Confirmation with bullish momentum is essential for a high-probability trade setup.
