LONG position on USDCHFThe formation looks inviting, waiting to see how it plays out. The pair seems to have printed an inverted head and shoulder formation indicating trend reversal and its happening at a key level.
Trendreversal

NIFTY will be volatileIn morning session it will come to 16557
It will bounce from theere and next level will be 16680
From there sharp selling is expected
Trade carefully as tommarrow is weekly expiry.
Market will be highly volatile. Trade with stoploss.

AUDCAD - Inverted Ascending TriangleA buying opportunity can be a possible trading setup as long as the candle didn't break and close below the trendline of this Inverted Ascending Triangle.
If the current candle close as a long shadow(having the lower shadow 3times higher than the candle body I will engage on an immediate buy.

NZDCHF - LongNZDCHF looks to continue its bullish long-term trend after a few weeks of bearish momentum.
Price recently broke above the descending channel and the 4h EMA, suggesting a trend reversal. If price holds at the ascending channel support (around 0.6435), and fib level 78.6%, we could see bullish momentum really kick in, up to the 0.6545 level.
Entry checklist:
- rejection at ascending channel support and previous resistance around 0.6435
- rejection at 78.6% fib level
- bullish confluence among MACD and RVI

BNBBTC UPDATEBig falling wedge on the daily timeframe for BNB, a breakout of this descending trendline will reverse the short term bearish trend.

Trend reversal for $OTLY stockHello,
looks like we are going for a trend change here on $otly stock .
4H candle still needs to close.
If we can get a higher high here try to buy on the pull back

NEO/USDT Big Pump and testing 1st resistance at 45$NEO just pumped and tests the first of three big resistance lines around 45$.
Daily on the left hand side:
- The RSI moved over 70 and is now near overbought area. We expect some kind of consolidation before we move upwards again.
- The downwards trend seems broken after hovering above the lower yellow line.
- We see a volume increase during the last days.
4h on the right hand side:
- There is a golden cross involving the 50 and 200MA indicated by the yellow camera.
- We spot a strong volume spike indicated by the green spiky ball.
We expect some consolidation now which also could be very short term.
In the long term we shoot for 120$ again.
Basic rules:
- Never buy the top/ATH
- Take profit as long as you can (also partial profit is profit)
- Use Stop/loss for leveraged positions
- If you are not experienced, don't leverage in the first place
Enjoy the ride and don't be too greedy.
If you like the content, please like, comment and give this channel a follow.
We would love it if you could share your thoughts in the comments.
Discussions are very welcome here.
Always do your own research and keep in mind that my charts and comments cannot be considered financial advice.
Cheers
ps.
Chart explanation:
Main lines:
- Green lines are tested support lines.
- Orange lines are resistance lines or, if we are above, possible support lines which were not tested yet.
- Cyan line is for volume trendline.
- White lines are Fibonacci retracement levels
Helplines:
- Purple lines are trendlines we take a look at.
- Blue, green, white and pink lines are 200MA, 100MA, 50MA and 20MA.
- Yellow lines are for visual help only.
Boxes:
- Either entry zone or support zone. Check the description.

Trend reversal? At the moment we are in a very important place, the force of the current movement is coming to a stop because we are at a resistance point and traders see this as a double top, therefore there will be a lot of shorts coming and the only reasonable thing is that if we are to go down from this point first we will move to the upside to collect some of those stop loss, only then we can move to the downside.

LIT/USDT Parabolic recovery on its way. Explosive?Litentry finally starts to recover from it's harsh decline during May and June.
We see a volume increase which is indicated in the daily chart with a cyan line.
The RSI on the daily shows a trend reversal analogue to the price action.
LIT now did face some resistance around 3.8$ but this is expected to be temporary.
The 4h chart shows a golden cross with the 50MA and 200MA involved.
A first target can be set around 6$ with the second around 14$.
Basic rules:
- Never buy the top/ATH
- Take profit as long as you can (also partial profit is profit)
- Use Stop/loss for leveraged positions
- If you are not experienced, don't leverage in the first place
Enjoy the ride and don't be too greedy.
If you like the content, please like, comment and give this channel a follow.
We would love it if you could share your thoughts in the comments.
Discussions are very welcome here.
Always do your own research and keep in mind that my charts and comments cannot be considered financial advice.
Cheers
ps.
Chart explanation:
Main lines:
- Green lines are tested support lines.
- Orange lines are resistance lines or, if we are above, possible support lines which were not tested yet.
- Cyan line is for volume trendline.
- White lines are Fibonacci retracement levels
Helplines:
- Purple lines are trendlines we take a look at.
- Blue, green, white and pink lines are 200MA, 100MA, 50MA and 20MA.
- Yellow lines are for visual help only.
Boxes:
- Either entry zone or support zone. Check the description.

DOT/USDT Bounce at 10.5$ leads to trend reversal?Polkadot crashed hard during April and did not recover since.
However, during July we did see a bounce at 10.5$ and DOT did break the series of lower highs for the daily RSI.
Volume increased as well which is an additional sign.
Now DOT moves into the 15-16$ range where we look for an upper breakout in price considering the downtrend.
Once we turned the 15$ into support we take the trend reversal of DOT as confirmed.
On the 4h chart we can expect to see a golden cross soon.
Basic rules:
- Never buy the top/ATH
- Take profit as long as you can (also partial profit is profit)
- Use Stop/loss for leveraged positions
- If you are not experienced, don't leverage in the first place
Enjoy the ride and don't be too greedy.
If you like the content, please like, comment and give this channel a follow.
We would love it if you could share your thoughts in the comments.
Discussions are very welcome here.
Always do your own research and keep in mind that my charts and comments cannot be considered financial advice.
Cheers
ps.
Chart explanation:
Main lines:
- Green lines are tested support lines.
- Orange lines are resistance lines or, if we are above, possible support lines which were not tested yet.
- Cyan line is for volume trendline.
- White lines are Fibonacci retracement levels
Helplines:
- Purple lines are trendlines we take a look at.
- Blue, green, white and pink lines are 200MA, 100MA, 50MA and 20MA.
- Yellow lines are for visual help only.
Boxes:
- Either entry zone or support zone. Check the description.

Dont forget the overall tendency.Seeing big pumps like the ones we are have been seeing that past few days surely gets our hopes up, but remember that in the daily time frame we are still in a downtrend and we are currently testing the 55 EMA, so if we are able to break this point we could see a trend reversal but we don't have that scenario just yet so let's stick with what we have now.

Double EMA (DEMA) From ScratchHello, traders!
Today we’ll speak about the most trivial, but very useful indicator that’s called DEMA. As you know, moving average is a backbone of 90% complicated indicators. It’s able to give lots of information about the price action. Well, let’s speak about it.
The double exponential moving average (DEMA) is a technical indicator introduced by Patrick Mulloy in his January 1994 article "Smoothing Data With Faster Moving Averages" in Technical Analysis of Stocks & Commodities magazine.
The DEMA uses two exponential moving averages (EMAs) to eliminate lag, as some traders view lag as a problem. The DEMA is used in a similar way to traditional moving averages (MA), but DEMAs react quicker than traditional MAs.
How to use DEMA?
-The average helps confirm uptrends when the price is above the average, and helps confirm downtrends when the price is below the average. When the price crosses the average that may signal a trend change.
-Indicate areas of support or resistance.
-Cross overs of 2 DEMAs. We sometimes draw fast DEMA(20) and slow DEMA(50). When the fast line crosses the slow below, it’s a bearish signal, when above - bullish. It’s consider to be a good entering signal. However, we shouldn’t forget that the indicator is still lagging.
Guys, I should remember you that every indicator shouldn’t be used in solo. You should only use them in conjunction with other indictor when they confirm each other. I hope, this knowledge will boost your trading skills and make your trading staff more interesting and profitable. Have a nice day, dear traders.

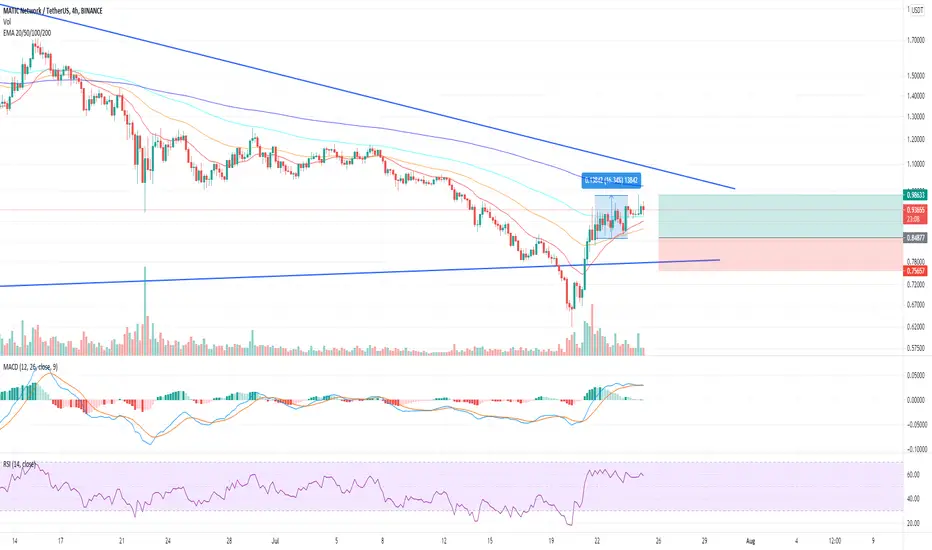
MATIC Continues with upward trend reversalAs we mentioned we were entering a long position in Matic which has been hit but we beleive the volume will start to arrive on the amazing project and see this trend continuing.
THETA Trades On PointAs per previous post on out THETA trade entry, our 1st target hit within 0.1 with second target well on track.

BTC UpdateBTC has closed 4hr candle above key resistance of $32,200 level which is the first confirmation of trend reversal I was looking for.
Then we wanted a bounce when retest was done to confirm flip from resistance to support. BTC doing all the right things.
Next confirmation is 4hr close above long term trend resistance trendline.

SAVA Dark Cloud Pattern, trend reversal coming. SAVA Dark Cloud Pattern, trend reversal coming.
Need a confirmation candle to entry. SL 1 ATR above the swing high.
NOT FINANCIAL ADVICE, DO YOUR OWN DD AND WORK, TRADE WITH RISK MANAGEMENT.

LINAUSDT Early Buy for Trend Reversal!!BINANCE:LINAUSDT
The main reason for the buy plan is the Libra pattern.
The swing analyses indicate that there might be a trend reversal but before the massive buy which is probably the 3rd wave of the Elliot, there should be a fair price.
The fair price is 0.03 we guess which is also the fib retracement level!
Around the fair price, we will be seeking a price action signal that enough to trigger all buyers in the market and will be targeting the last higher point for the half portion of our order.
After the first target, if the trend will continue we will be in it!
Stops should be tightened because the lowest point is so far to build an appropriate risk/reward correlation.

Gold battles recovery point on US NFP DayGold extends early week recovery from March tops to poke 50-EMA ahead of the key US employment data. The expected recovery in the headline Nonfarm Payrolls (NFP), coupled with the forecasts of downbeat Unemployment Rate, keep weighing on the metal prices. However, firmer RSI and MACD’s teasing of bulls may propel gold prices in case of a negative surprise from the stated jobs report. It should, however, be noted that a clear upside break of $1,780 immediate hurdle needs to cross the $1,817-20 area comprising the previous support line and 200-EMA to consolidate the previous month’s losses and regain the $1,800 threshold.
Meanwhile, a downside break of the recent low near $1,750 has hopes to bounce off mid-April lows near $1,723, not to forget mentioning the immediate support close to $1,763. In a case where gold remains depressed below $1,723, the $1,700 psychological magnet may test the bears ahead of directing them to the double bottoms marked March around $1,677. Overall, gold sellers seem tired and hence any surprises from the US data should be reacted with wider moves.

NAS100 POSSIBLE TREND REVERSAL.Buyers are showing loss of strength here, its like a tug of war between buyers and sellers , if price breaks 14355.0 Support zone then there might be a possible trend reversal which means ill be looking for sells on the first pullback.. probably would be by next week.

Silver floats above $25.65-60 key support, 100-DMA eyedSilver’s first weekly gain in four portrays the metal’s gradual recovery from 200-DMA and 61.8% Fibonacci retracement April-May upside. Not only the price but the RSI line also inches up from the oversold area, which in turn suggesting the firmer bullish bias. However, 100-DMA near $26.55 becomes the key hurdle to convince the silver buyers. It’s worth noting that the 50% Fibonacci retracement near $26.25 guards the bright metal’s immediate upside whereas the early month low near $27.00 will lure the bulls past $26.55 breakout.
Meanwhile, a daily closing below the $25.65-60 support confluence will aim for the mid-April lows near $24.65. Though, the $25.00 threshold may offer an intermediate halt during the fall. Even if RSI conditions don’t permit the metal’s declines below $24.65, any further losses will attack the yearly low marked in March near $23.75. Overall, silver seems to consolidate the monthly losses during the quarter-end days and hence the corrective pullback may prevail during the next week.

A reversal on EURUSD? Is it time to buy?In the last few days we saw a sharp drop on EURUSD.
We can see a strong USD pretty much everywhere after the news from FED.
Price has now reached significant support levels and it's important what will happen next.
On EURUSD we're expecting a test of next support level in the 1,1850 zone,
where we could see price slowing down and possibly going back up to 1,2000!
Entries to be made only when you have a rejection of support and candle close with a long wicks!
Follow us for more opportunities!

Possible Trend Reversal for NZDUSDLooking at NzdUsd, we could finally be seeing this pair break its range its been in for a while now. Looking on the daily timeframe, we could notice that the bullish momentum that this pair once had, has faded away. With this being said, we could start to predict that a trend reversal is in sight.
Focusing on the 4H, price is beginning to break market structure that signals bearish bias. I've outlined a level of significance that would trigger a bearish break of market structure. If price manages to break this level, it is showing the presence of sellers and I'll wait for a retest before executing sell orders. But for now, have my alert set under the level and just waiting.

GBPJPY - Bull Flag + ReversalPrice has been in an uptrend all year and is currently in a bull flag pattern. A break of this flag looks to send it to a strong monthly resistance where a reversal may follow.
