NEOBTCneobtc
downtrend weakness
(vol decrease in downtrend)
4h regular divergence ( trend reversal sign )
daily support @.000998
Trendreversal

GBPAUD - Support and Resistance (2 Aug 2020)I'm waiting for the candle to break and close above 1.8365 for an additional buying opportunity. I'm seeing a great potential for a mid to long term of an appreciation movement on this pair as a trend reversal trade, let see how this trade pans out.

UNG may have bottomed...From the chart we see a near perfect hit of a 1.27 extension of an impulse wave in the 11.5 region which may have marked a bottom in Natural gas, I say this because in recent weeks we are not seeing a pattern of lower highs and lower lows take hold. Furthermore there has been aggressive buying in related stocks such as SWN and RRC which may be an early indication of a change in the market trend. Using a Fibonacci trend based timing tool (horizontally w/ regard ot time as opposed to vertically for price) we see had relevance in predicting price reversals (from the 1 marked with a long vertical line in the graph) we are coming up on the 1.27 this Monday, it will be very interesting to see how the next few weeks play out.

GBPCAD SHORTPrice hit a key area, broke trend and formed a double top. The red candle afterwards adds some confirmation.

XEM/BTC | Macro Trend Reversal | Golden Cross | Trade Setup Today's analysis – XEM/BTC – A strong break of its multi-month resistance backed by volume; showing signs of a macro trend reversal.
Points to consider:
- Bullish price action
- S/R Flip (trend reversal)
- EMA Golden Cross
- Increasing volume
- RSI above 50
- Stochastics below 50
XEMBTC breaking structural resistance with inviting bullish engulfing candles indicating buyers in the market establishing a bullish bias.
Price currently retracing to establish an S/R flip retest of the structural support zone, price holding support will form a local higher high and higher low on the chart indicating a macro trend reversal, supporting the bullish bias.
The 200 EMA is also in confluence with structural support; putting a strong emphasis on support being a key level. A golden cross of the 200 and 21 EMA will indicate momentum shifting to the upside; another confirmation supporting the bullish bias.
A clear volume influx coinciding with the break of the key level adding validity to the price action. Continued Volume follow-through is needed for a continuation.
RSI is trading above 50 and needs to continue ranging above 50 to remain bullish. Stochastics are below 50, momentum is lacking is the immediate market, however, a valid bullish cross-over will indicate momentum stored to the upside.
Overall, in my opinion, a successful S/R flip retest backed by volume validates a long trade to technical targets above with risk defined below structural support.
If you’ve read this far, I’d like to thank you for following my work and development as a trader!
As always,
Focus on you, and the money will too!

CAD/JPY Trade ReviewCADJPY Trade Review
I posted this Trade Analysis here on Wednesday. This trade was awesome. Price went up above the Weekly Supply and reached the top of the Liquidity Zone as i predicted in my previous post. The Banks and the big Institutions cleared the previous highs and the stop loss of retail traders who were in shorts (sells). Everyone believed the market was Bullish and started buying. Market Manipulation. Lol
The price crossed the 80 mark and many breakout traders entered the market, Buy stops were triggered. Then the real move happened. The price hit 80.10 resistance. The Market then reversed and did a huge drop just as i predicted. A lot of buyers were trapped. the stop loss of many buyers were hit.
I was not trapped because i understand Market Manipulation and I follow Market Struture. Sold the pair at the top of the liquidity zone. 100 pips and more in Profit. All Supply and Demand Traders know that every gap/void must be filled. The market filled the Gap in the Liquidity zone and went to target the stop loss of traders above the Weekly Supply Zone.
Now that they cleared the stop loss of the retail traders (both sellers and buyers), the Banks and Institutions used all the liquidity to do the real move down (Sell). Lol
Happy Weekend!!

ONT/BTC | Macro Trend Reversal | Key Level | Trade Setup Today's analysis – ONT/BTC – establishing an S/R flip retest above structural support.
Points to consider:
- Bullish price action
- Trend Reversal
- Support Confluence
- Volume Influx
- RSI ranging above 50
ONTBTC trading in a healthy uptrend, breaking its structural resistance with multiple bullish engulfing candles indicating strong buyers in the market, forming a bullish bias.
Price breaking bullish from its inverse head and shoulders pattern, forming consecutive higher lows and higher highs is indicative of a macro trend reversal.
A successful S/R flip of structural support as it coincides with the 200 EMA will solidify the trend reversal.
There is a clear volume influx coinciding with the break of the key level, follow-through is required for continuation.
The RSI is currently testing the 50 level, it needs continue ranging above 50 to maintain strength in the market.
Overall, in my opinion, a successful S/R flip retest backed by volume validates a long trade to technical targets above with risk defined below structural support.
If you’ve read this far, I’d like to thank you for following my work and development as a trader!
As always,
Focus on you, and the money will too!

Back To The High ... Before A Drop ???The S&P500 is looking to return to it's high of 3394. Taking a look on the 4H chart, price action is looking morning starish on this uptrend. A retracement is bound to happen between the 3315 & 3345 areas creating S&R levels. The current position we're holding is waiting on the bullish candle to close above 3280 on the 1H in order to enter the trade going long. (Personally, I've set an alert.)
The real question is the Trend Reversal and when will it happen!? We all know once it breaks the uptrend and support level.
But it can easily reverse after going long and retracing back down to 3315, crossing below the bullish trendline, going back up for a retest just to continue the new bearish trend. Or maybe, once it returns to it's high of 3394.
Could consolidate a bit ... and then short back down forming a bearish trend reversal.
Either way the profits are still running wherever the market goes.

NANO/BTC | Macro Trend Reversal | S/R flip | Increasing volumeToday’s Analysis – NANOBTC – consolidating within its daily support zone as holds above the 200 EMA
Points to consider:
- 200 EMA S/R flip
- Macro trend reversal
- 55 EMA visual guide
- Increasing volume
- Oscillators neutral
Nanos recent strong price action forming a successful S/R flip re-test of the 200 EMA on the daily timeframe indicates early signs of a macro trend reversal, giving the market a bullish bias.
Thereafter, Nano establishing a higher high and higher low on the chart further supporting the bullish bias.
Further price development will allow the 55 EMA to act as a visual guide assisting in trade management.
Historically, an inflow of volume has coincided with bullish price action as it breaches key levels; indicating a true break of the level and adding validity to the price action. Volume follow-through is needed currently for a true trend continuation, avoiding any false breaks.
Oscillators are neutral, further price development will allow for directional bias.
Overall, in my opinion, NANO is currently trading in the buy zone for a long trade to structural resistance as the immediate target with risk defined below the 200 EMA.
If you’ve read this far - thank you for following my work!
And as always,
Focus on you, and the money will too!

Possible trend reversal coming up for Compound?COMP, currently in a downtrend, is in an overall falling wedge pattern, which is bullish. Also, several of the most recent candles show inverted hammer patterns, which suggests we could be seeing a trend reversal soon. There has been a long downtrend lately, but things could soon take a turn upwards. Going to be watching for other signs as well.

THETABTC | S/R Flip | Trend Reversal | Trade SetupToday's analysis – THETABTC – Putting in an S/R flip retest of daily support. Price holding this level validates a long trade to structural resistance.
Points to consider:
- Trend Reversal (S/R flip)
- 21 EMA (visual guide)
- Bearish divergence (playing out)
- Stochastics above 50
- Low Volume
THETABTC forming a probable higher low above daily support as it retraces for a retest. Price holding this level will indicate first signs of a trend reversal as the market builds momentum to the upside, establishing a bullish bias.
The 21 EMA will act as a visual guide as the trend develops and price respects the MA assisting in trade management.
Bearish divergence playing out as price tests support. Both oscillators need to hold and range above 50 to maintain the bullish bias.
Volume is low and below average, usually, an indication of an influx being imminent.
Overall, in my opinion, s successful retest of the daily support level validates a long trade to structural resistance with risk defined (SL) below support zone.
What are your thoughts?
If you’ve read this far - thank you for following my work!
And as always,
Focus on you, and the money will too!

MITHBTC | S/R Flip | Trend Reversal | Inverse Head and ShouldersToday analysis – MITHBTC – Forming a higher low, consolidating above daily support validating a long trade to technical targets above.
Points to consider:
- S/R flip Retest (trend reversal)
- 100 EMA (support confluence)
- Inverse head and shoulders
- Low volume
- Oscillators neutral
MITHBTC trading in a healthy uptrend forming a lower high with a valid S/R flip retest of daily support, establishing a bullish bias with signs of a macro trend reversal.
Price breaking above and respecting the 100 EMA allows for an additional layer of support. Holding above the MA is bullish, supporting the bias for a trend continuation.
A valid inverse head and shoulders (bullish trend reversal pattern) is also in play as price holds above the neckline coinciding with daily support.
Volume has tapered off and trading below average, an influx is essential as price gravitates towards daily support to avoid any false breaks and restore strength in the anticipated trend continuation.
Both, RSI and Stochastics are testing the 50 levels as volatility contracts. Although further price action will allow for directional bias, it is essential oscillators hold above 50 to maintain a bullish bias.
Overall, In my opinion, a long trade is validated as MITH retraces to daily support with technical targets above - defining risk (SL) at the previous swing low.
If you’ve read this far - thank you for following my work!
And as always,
Focus on you, and the money will too!

ALGOBTC | Key Level | Trend Reversal | Head and ShouldersTodays Analysis – ALGOBTC – Forming a potential head and shoulders pattern, trading at a key level within a multi-month descending channel.
Points to consider:
- Range Median – key level
- Head and shoulders
- Low volume
- RSI below 50
- Stochastics oversold
ALGOBTC has found support at the range median of its descending channel. Price holding above the area will establish the right shoulder of a potential head and shoulders (H&S). Price breaking and consolidating above channel support will further validate this pattern.
A validated head and shoulders pattern will establish a higher low in the chart, indicative of trend reversal, forming a bullish bias in the market.
Volume is tapering off and remaining below average, an influx is needed price attempts to break channel resistance to avoid any false breaks as seen previously.
The RSI has broken below 50 indicating increasing weakness in the immediate market.
Stochastics are oversold and may remain oversold for some time as seen historically, before momentum shifts to the upside.
Overall, in my opinion, further price development will determine a directional bias. An S/R flip at channel resistance will allow for a long bias and a break below range median, price is likely to test channel support.
What are your thoughts?
If you’ve read this far - thank you for following my work!
And as always,
Focus on you, and the money will too!

BATBTC Trade Setup | Trend Reversal | Hidden Bullish Divergence Today's chart - BATBTC – Consolidating at key support; a successful re-test validates technical targets above.
Points to consider:
- Trend Reversal
- 21 EMA visual guide
- Hidden bullish divergence
- Stochastics oversold
- Low Volume
BATBTC testing trend support after a strong bull move into daily resistance, price respecting support level will form a higher low on the chart, indicating a trend reversal and will allow for trend continuation.
The 21 EMA will assist as a visual guide, price breaking and trading above the EMA is a confirmation of strong trend continuation.
Although trading below 50, the RSI confirms a hidden bullish divergence: price has made a higher low whilst the RSI has made a lower low, indicating a strong market accumulation. This also allows for ample space before the oscillator reaches overbought conditions as price breaks bullish.
Stochastics are also overextended, although they may remain there for some time, momentum has been stored to the upside.
Volume has been tapering off, indicative of an influx being imminent, likely to coincide with a break in either direction.
Overall, in my opinion, BATBTC needs to hold trend support and break above the 21 EMA to validate a conservative entry for a long trade to technical targets above.
What are your thoughts?
If you’ve read this far - thank you for following my work!
And as always,
Focus on you, and the money will too!

ADABTC | Key Level | Bearish Price Action | Trade SetupToday's analysis – ADABTC – Showing signs of exhaustion as it tests key a support level. Breaking below support, price is likely to retrace to daily support. However, if PA continues to respect the 21 EMA, a bullish continuation is probable, negating the thesis.
Points to consider:
- Bearish price action
- S/R flip re-test (trend reversal)
- 21 EMA (visual guide)
- RSI testing 50
- Bearish Stochastics
ADABTC showing signs of a local trend reversal as price retraces from local highs where bull moves are quickly being sold into by the bears. With body candle-closes below local support, price will likely retrace to daily support where it finds an equilibrium between supply and demand before a decisive macro trend continuation or reversal.
A break below the 21 EMA forms a bearish bias and an S/R flip re-test of local support and the 21 EMA will form a lower high, confirming the bearish bias.
RSI forming a lower high projection. A break below 50 is needed for price to break local support and retrace to lower levels.
Stochastics projecting down, breaking below 50 indicate decreasing momentum in the market.
Overall, in my opinion, a body candle close below local support validates a short trade to daily support with risk defined (SL) near local highs.
What are your thoughts?
If you’ve read this far - thank you for following my work!
And as always,
Focus on you, and the money will too!

ATOMBTC | Key Level | Double Bottom | Trend Reversal Todays Analysis – ATOMBTC – Consolidating at key support, an impulse move to structural resistance is probable as it continues to hold above the 200 EMA.
Points to consider:
- Pivot point (key level)
- Double Bottom/probable head and shoulders
- Macro trend reversal
- Volume influx
- RSI above 50
ATOMBTC trading at a key S/R cluster as it breaks and holds support above the 200 EMA, attempting to break bullish. Body candle closes above this zone, an impulse move to structural resistance is probable.
A bullish continuation from this level validates a double bottom pattern. An S/R flip retest of daily support will form a left shoulder for a probable head and shoulder pattern and also form a higher low on the chart (indicating a macro trend reversal).
The recent influx of volume coincides with bullish price action, adding substantiality to the move. Volume must remain above average to maintain a continuation and avoid any fake-outs.
RSI and stochastics trading above 50 validates strength and momentum in the immediate market: oscillators need to range above 50 to maintain the bullish bias.
Overall, in my opinion, ATOM needs to hold daily support to increase the probability for an impulse move to structural resistance.
If you’ve read this far - thank you for following my work!
And as always,
Focus on you, and the money will too!

OGNBTC | Trade Setup | S/R Flip | Bullish Price Action Today's analysis – OGNBTC – breaking bullish from its immediate downtrend as it reaches its apex.
Points to consider:
- Daily support respected
- S/R flip
- 21 EMA (visual guide)
- Low Volume
- RSI breaking above 50
- Bullish Stochastics
OGNBTC has respected daily support upon retest, establishing a higher low (early signs of trend reversal).
Local resistance is breached as price breaks bullish from its immediate downtrend. Establishing a body candle close above resistance adds validity to the break and an S/R flip retest of resistance supports a bullish reversal.
The 21 EMA will act as a visual guide as the trend develops and price respects the MA assisting in trade management.
Volume has been declining and remaining below average. Historically, an inflow of volume has coincided with bullish price action, indicative of an influx being probable. Volume follow-through is essential to solidify price action and avoid any false breaks.
RSI breaking above 50 indicating increasing strength in the market. Stochastics projecting up, breaking the 50 level is indicative of increasing momentum in the market. Both oscillators need to range and hold above the 50 level for a bullish continuation.
Overall, in my opinion, a successful break and retest of local resistance with volume follow-through validates a long trade with technical targets above; risk defined (SL) below daily support.
What are your thoughts?
If you’ve read this far - thank you for following my work!
And as always,
Focus on you, and the money will too!

USDCAD - Is Short Term Uptrend Came to EndTrading Confluences,
Price reject 4-Hour Resistance Level
Price Starts to Creat Lower Highs
Price Broke Minor Trend Line
RSI Divergence
Trade Idea - Consider going short if price broke below the local structure level and retest it successfully.
Trade Analysis from Trade Revenue Pro

EURUSD - Double Bottom at Support LevelTrading Confluences,
4-Hour Support Level
Double Bottom
RSI Divergence
Trade Idea - Consider Going Short if Price Actions Retest the Local Structure Level.
Trade Analysis From Trade Revenue Pro

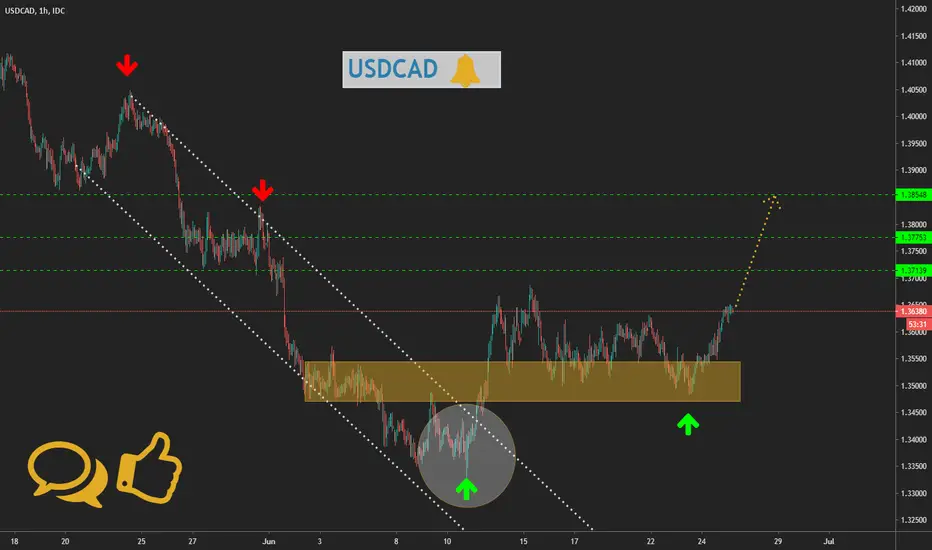
Trend Reversal | USDCAD (Update)Do you remember the analysis from June 15, when we were expecting a reversal.
It took a while for the price, but the support zone held up and we are already seeing a rise.
This confirms our expectations from June 15 for a reverse and we expect to see higher values.
Resistance levels:
1.3713
1.3775
1.3854
Do you have a trade?
BITCOIN important NUMBERS for Day Traders(Supports & Resistance)Thank you for constantly supporting us with your likes. Bulls are loosing power and failing BTC from 9800. this can be the beginning of a trend change leading to BTC downfall if it fails to cross 9800.
The numbers on the chart shows the major support and resistance zone inside the current consolidation, they are support when BTC is falling and resistance when Btc is rising.
BTC Hopes lay in Major supports around this zone on its way down 9600 -9550, 9350 -9400, 9250 -9200. if this supports breaks down then 9050 to 9050 and 8800 is btc last hope or it will drip like hot sauce to 8k or 7500.
Would you like to Improve your trading skills to reduce losses and increase your winnings?
Join me on Telegram by clicking the link in my Bio if you wish to learn how to read chart, Learn how to trade Cryptocurrency on Futures and Options.Thanks in advance for your Likes

ZIL BTC | Trend Reversal | Flow | Key Fibonacci LevelsTodays analysis – ZILBTC – trading in a possible descending channel, currently testing local support.
Points to consider:
- Flow in the market/price action
- Respecting key Fibonacci levels
- Resistance Confluence
- Trend Reversal
- Low Volume
- RSI below 50
ZILBTCs healthy counter-trend and strong continuation adds legitimacy to the money flow.
The previous swing-low respecting .618 Fibonacci retracement is indicative of a current retrace to .618 Fibonacci level.
The .618 Fibonacci level also coincides with descending channel resistance. A rejection at this level will solidify a trend reversal with a lower swing high.
An increase in volume is necessary to add legitimacy in the overall market.
RSI attempting to recover from oversold conditions. A countertrend will neutralise and prime the oscillator for a trend continuation.
Overall, in my opinion, a short trade is validated at the rejection of the resistance confluence with a technical target of local support.
Entering the trade at resistance confluence consents immediate trade invalidation (price trading beyond resistance zone), mitigating overall risk.
What are your thoughts? Let me know in the comments below!
Be sure to leave a like and follow me for daily chart updates.
As always, focus on you - and the money will too!

EUE/NZD Shorting 2 optionsWhat do u think about shorting Eur/Nzd. It looks like it will fall back to support levels. What do u think?
