Trend Reversal | USDCADWith the news about the interest rate last week on Wednesday from the Fed, we saw a fixation of many bottoms and peaks.
USDCAD is another place where we expect the reversal of the current movement.
The price broke the Trendline and even make a correction to the support zone.
From here we expect a rise to:
1.3742
and
1.3881
What do you expect, do you have active trades?
Trendreversal

Watch the reverse on GBPNZD!
As you guys can see very clearly, Now we are on a important weekly zone, I waited for a candlestick formation to let me understand what the market wanted to do and I saw this:
A beautiful reversed head & shoulders as well as a rounded bottom. I will watch the closing of the candle on the 4h time frame: if it closes above the resistance that I draw I'm gonna go long, on the momentum candle with a stop loss right under the right shoulder and the take profit on the next possible target. This trade will give me a risk reward of 1.55, that satisfy my trading plan.
Now I would like to hear from you.. do you have any impressions? Please let me know what you think in the comments section!

fcpo possible reversal or formation of the "head"current resistance : 2400-2420
current support : 2300
lower support level : 2200
the price might come to a reversal region...

GBPAUD - Triple Bottom At the Weekly SupportTrade Confluence :
1. Triple Bottom At Support
2. RSI Divergence Confirm Weaknesses
3. Broke Above and Retest the Local Structure Level

The most accurate analysis I was talking about 🤩🤩 (part 2)This idea is linked to my previous idea. first check that out and come to this for better understanding.
From this 4h chart i am able to understand that there’s plenty more room for trend-reversal.
i am not god i may be wrong but, the decrease in volume and this head and shoulder pattern if bitcoin takes correction then we can find it taking some support at 9200 followed by 8800.
if you’re able to understand this situation where volume decreases and prices remain in sideways or slightly higher in uptrend then this is the sign there may be a downtrend coming.
Observe the neck line for few days carefully, because we can not think only in one direction, we have to be ready if it crosses 10,450. if this happens then we can see BTC to newer high of 14500.
in the end i’ll say trade carefully, we can make sweet profit in both trends.
if you think that my work worth some appreciation then please follow my telegram channel @harshgpcryptocalls. i share free premium altcoin signals more than 50-70% profit in last month.
thanks for your considerations.

No one is talking about this BTCUSDT long-term scenario. 🤯🤯first of all if you are new here then go and check out my telegram channel @harshgpcryptocalls
If you don’t like my advices and ideas don’t follow me just ignore. For me, your profit matters. not wasting time let’s start the description.
So, currently there are two scenarios present at this time.
1.One is Bitcoin can pump to new high of 14500. (which is highly impossible, but can’t trust the volatility)
2.Second is it can take correction to the 880l level and then enters into a downtrend which can take the price tothe lower level of 4700.(having higher chances)
the reason i’ll post in a new 4h chart analysis (i’ll link to this so, don’t worry about detailed analysis)
the simple and short conclusion is we’re expecting BTC to cross the levels from breaking resistance or support for new trend of the season.
Don’t get trapped in any wrong decision. i advise you to wait and watch for a week.
stay tuned happy trading, take care.

Azure Power Global: divergence confirmed, downtrend is startingwww.vfinvestment.site
The price crossed down the 100-day moving average very rapidly, the divergence with the MACD was validated by two very strongly bearish candles, MACD looks pessimistic and RSI indicates no oversold condition. I think that is more than enough to assume the price will revert down to the historical support/resistance of 11.80, if not break through it. If you really want to go certain, you can wait for the price to cross the 200-day moving average, but by that time you will probably lose some potential profit.
VF Investment can not be held responsible for any financial damages suffered from following our well-funded but personal opinions and trading ideas.
Please, maintain proper position sizing and risk management!

AUDUSD Direction Shift | Shorts on PullbackAUDUSD shown a bearish breakout from the ascending trendline after being completely overbought. This changes the markets momentum shift and we will be looking to enter this bearish trend on the 0.5 Fib retracement, and also retesting the current hourly descending trendline which is holding pretty well so far.

Head and shoulder trend reversal on EURGBPOn the weekly timeframe we can see many rejections and reversal candles on the 0.90000 thousand pip quarter point showing us possible reason for a reversal of the trend. On the daily chart you can see an ascending triangle forming for a breakout, and a shooting star candlestick right at the 0.9000 level to further confirm a bearish trend. Now down to the 4 hour chart you can see a possible formation of a head and shoulder pattern but still only in the right trough and needs to form the right shoulder. Retracement from the most recent swing high to the swing low shows a 50-61% zone right where the right shoulder should find resistance for a lower high. Taking a sell here is a little risky, but with the addition weekly and daily price action analysis we can learn towards a trend reversal. When it comes, watch for break of the neckline from the troughs of the two shoulders.

GBPJPY Head and Shoulders Trend Reversal?-Since my last analysis of GBPJPY, the price has rejected the 130.581 level, which was noted as a possible outcome.
- A nice inverse head and shoulders pattern has emerged on this pair.
- The distance between peak of inverted head and right shoulder is around 310 points, therefore from the breakout of the neckline early this morning, we can expect the price to push a similar distance to the upside.
- This movement would also bring the price to the previous resistance of 135.268.
- RSI on the 4 hour time frame stands at 69.53, so, in the short term, we could also see a retracement to, and retest of the neckline before continuing an upward trend.
I hope this is an helpful analysis; please share your thoughts and opinions!

Bounce From Support and Breakout from Downward Channel495-500 level proves to be a strong buy level and thus support, which it has bounced from in the past. (Outlined by green shaded line).
When Wheat is trending in one direction it typically remains within an upward or downward channel as you can see historically, as well as outlined by the shaded blue channel. As you can see, it has recently broken out of this channel.
These factors could mean a good trend reversal (long) setup, also with a good risk/reward if it goes to test the 580 resistance levels as it previously had.
What are your thoughts?

Solarwinds Corporation short after bounceback from resistanceHistorically, the price of the Solarwinds Corporation has been very steady, moving in its normal range between 16.76 and 19.40. Given no overbought signals, nor any divergence with the MACD, I expect the price to be pushed a little bit higher by the bulls, at least to 19.40, if not up to 20.41. But it will not break these resistance levels for long. When the bears take over, make sure to go short!
VF Investment can not be held responsible for any financial damages suffered from following our well-funded but personal opinions and trading ideas.
Please, maintain proper position sizing and risk management!

#COLPAL #COLGATE #FMCG #NSE #NIFTY #BANKNIFTY #COVID19 #INDIACMP 1295.25
TGT 1340
Short Term 1 Wk
Trend Reversal
Stop Loss 1283

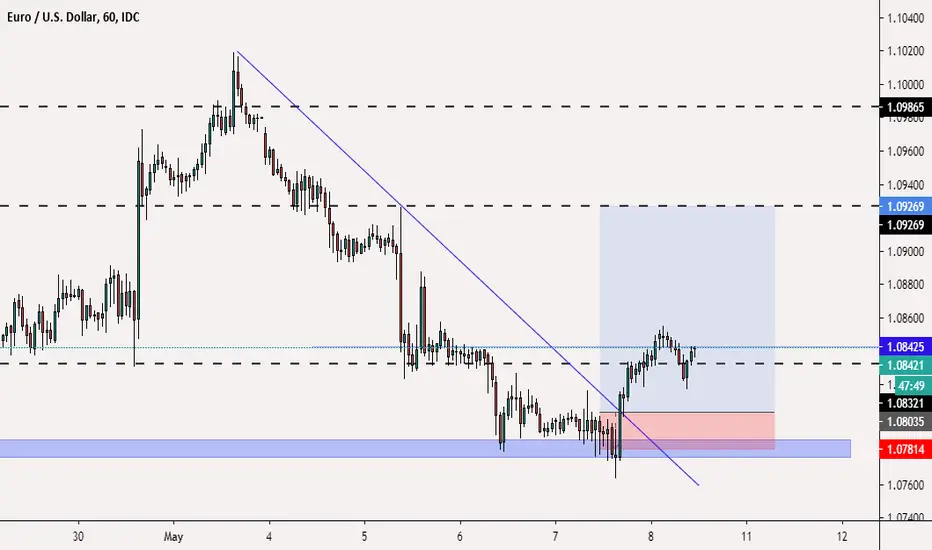
Bottom Head & Shoulder, 80% Sell OpportunityChart Patterns: "Bottom Head & Shoulder", "Range Double Top"
Candlestick Patterns: "Pin Bar" & "Engulfing"
Entry price: 1.09670
Stop Loss Price: 1.10250 (58 pips)
Take Profit Price 1: 1.08865 (80 pips)
Take Profit Price 2: 1.07830 (184 pips)
Estimated Duration: 1-4 Days
Probability to Meet Target: 80%

GBPUSD : Looking for long positionEntry for long position on the FX:GBPUSD at lower end of Area 1 at 1.2215. Updates to follow...

Clear trend reversal comingTechnical analysis indicating a trend reversal . Sell after confirming BB, EMA and once market reaches trend line
Keep trading

S&P 500 is in an EXTREMELY CRITICAL STAGE!SPX has been consolidating between the 61.8% resistance level and the 50% support level. Many orders concentrate on these key Fibonacci Retracement levels pushing the price in the desired direction. In consequence, the price has been consolidating between the levels and the next breakout could be huge, determining the next direction of the overall trend.
As I have stated in my two previous posts, I have a strong belief that the downward trend will continue after this consolidation and that we could see new bottoms soon. If you want to know why I believe so, take a look at my previous posts.
In case you are interested in shorting the SPX, I have drawn a relatively safe entry point (1) to the graph. In case you short, I see it suitable to apply a stop-loss level (2), in case the upwards consolidation would still continue.

BTCUSD - Trend-reversal Today. Price Technical Analysis #70Market in last 24 hrs
- BTCUSD price moved almost 9% between between $9,270 and $10,080
- Price at time of publishing: $9,990
- Price crossed important resistance level of $10,000
- BTC’s market cap: $182 Billion
Today’s Trend analysis
Price should trend downward today. Oscillators are neutral but compared to yesterday many have now flipped to indicate a downward trend. MACD is above 0 but RSI and CCI are in over bought zone, indicating that downward momentum has gained strength and a trend reversal is possible.
Another interesting point to notice is the affect of Halving-Hype and the impact of the same on BTC and other Crypto tokens. We are observing an increased trade volume and price volatility .
- Downwards today
- ‘Oscillator‘ indicators are mostly neutral. RSI is at 71.5
- ‘Moving average‘ indicators indicating buying opportunity. Ichimoku Cloud is neutral
----------------------------------------------------------------------------------------
The analysis is based on signals from 28 technical indicators, out of which 17 are moving averages and remaining 11 are oscillators. These indicator values are calculated using 4 hr candles.
DM to get details of the above analysis and list of indicator & their values used to arrive at the above conclusion.
Note: Above analysis would hold true if we do not encounter sudden jump in trade volume .
----------------------------------------------------------------------------------------
If you find the analysis useful, please like and share our ideas with the community!
- Mudrex

spx500Spx500 8h -Bearish possibility - Enter off LH which is also right shoulder. Already hit the 61.8 fib level at last high and rejected. Currently 200MA is acting as resistance. LH on macd, divergence starting.
Bullish possibility - Stop loss below last low, market structure says bullish. Strong bounce off the lows.


BTCUSD - Trend Reversal Today. Price Technical Analysis #61Market in last 24 hrs
- BTCUSD price moved in a range of +/-100 around yesterday starting price of $7,660
- Price at time of publishing: $7,730
- BTC’s market cap: $149 Billion
Today’s Trend analysis
Price should see a trend reversal today. Oscillators are mostly neutral but with a stronger bias towards sell side. MACD is indicating a sell opportunity and CCI is in overbought zone. Bears are now gaining control and should act soon.
Another interesting point to notice is the correlation between US stock markets (S&P500, etc) and BTC price, which is at currently trending at its all time high.
- Downtrend today
- ‘Oscillator‘ indicators are mostly neutral. RSI is at 66
- ‘Moving average‘ indicators indicating buying opportunity
----------------------------------------------------------------------------------------
The analysis is based on signals from 28 technical indicators, out of which 17 are moving averages and remaining 11 are oscillators. These indicator values are calculated using 4 hr candles.
DM to get details of the above analysis and list of indicator & their values used to arrive at the above conclusion.
Note: Above analysis would hold true if we do not encounter sudden jump in trade volume.
----------------------------------------------------------------------------------------
If you find the analysis useful, please like and share our ideas with the community!
- Mudrex
