$AMD Trend Reversal( Elliot+Divergence)We can see at the 1-hour chart of AMD stock that:
1. ELLIOT WAVE
We see the 1,2,3,4,5 and the A,B,C completion of the cycle and the C probably will lie in the green rectangular zone possibly test the support zone at 34$ .
2. Regular Bullish Divergence
We see in the price chart that the price at 27 of February was at 41$ and then until now is falling around $37, when the rsi in the same period is going up from 22 to 48.
So from the two these factors i expect a strong uptrend in the future and it will test the resistance at 52$ and will see if it breaks it.
Trendreversal

EURAUD REVERSAlEURAUD has been very bullish lately and I am expecting a long term sell...….however if it bounces from the main trendline instead of dropping and retesting I can expect a continued uptrend.
I got my words a bit mixed up hopefully u can understand my plan...:)

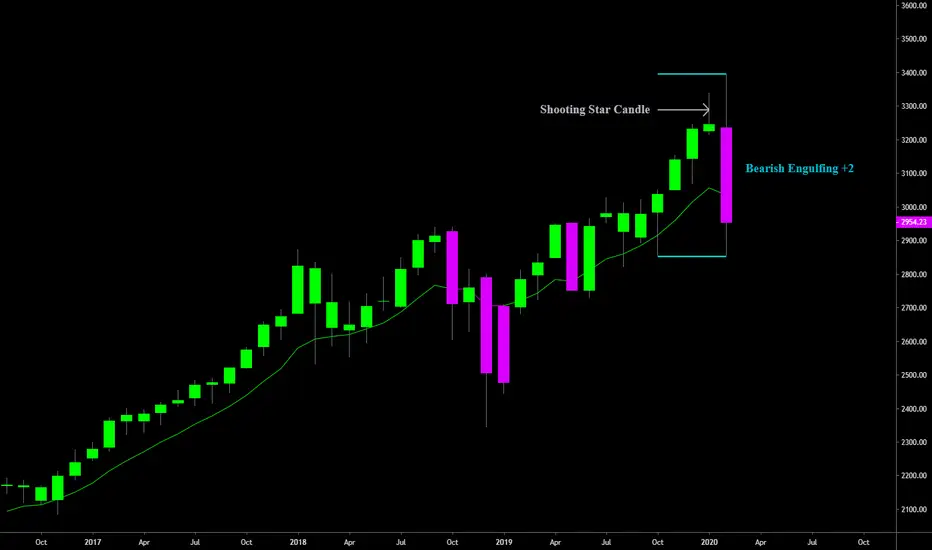
S&P 500 Bearish Engulfing+2 Following Shooting StarA closer look at the month of February shows that we had a bearish engulfing candle + 2. A bearish engulfing candle is one where the high of the candle and low of the candle completely engulfs the previous candles high and low(shown with blue lines) and indicates a potential reversal to the downside. The +2 indicates that the bearish engulfing candle not only engulfed the previous candle, but also engulfed the two candles before the preceding candle as well. February’s low was .10c above October 2019’s low which kept this from becoming a bearish engulfing +3. While this bearish engulfing candle on its own is bearish, a trend reversal isn’t confirmed until/unless we see a price move lower on the following candle(March 2020). If March price moves and closes lower than February’s low it can be viewed as a trend reversal and end of the 10-year bull market rally.
February’s bearish engulfing candle comes on the heels of a shooting star candle created in January of 2020. A shooting star candle is a bearish candlestick with a long upper wick with little or no lower wick. Shooting stars appear after an uptrend in price. The distance between the highest price of the candle(top of the upper wick) and opening price(top of the candle body) must be twice the distance of the candle’s body to be considered a shooting star; the upper wick must be twice the length of the candle body. Shooting star candles are most effective when they occur after a series of three or more consecutive rising candles, which this chart shows.
We now have two bearish candles on the chart with last months shooting star and this months bearish engulfing, both of which indicate that a top in price has likely been made.
USDCHF LONG CORRECTION.This is the first Valid buy in the USDCHF since the correction started last week. We are going long above 0.9700
Stop Loss @ 0.9683
Target @ 0.9778.

IRBT Shorts "Sweep" in the Cards?IRBT - I'm expecting a move up. What I like:
- Half-assed inverse head and shoulders on a daily
- Start of an uptrend (albeit disorganized and choppy)
- Relative strength with the indexes down over 1%
- Holding closest symmetry support at $50.20
- Cluster of symmetry support from $47-48.33 with the uptrend line
-786 fib retracement at $49.31
- Big ass gap above
Beyond the technicals, my intuitive/dowsing approach is hinting at a short squeeze and move higher; and with 50% of the shares shorted (as I understand it), that could be F-U-N!

S&P500 gets its pullback? Possible reversal trendlines - The SPX500 index has had a 9.7% sell off for the past week. Looking back at the chart's history (avoiding recessions) these sells offs usually range from 8% to 12% before they pullback or reverse trends back to bullish.
- - The purple trend lines show relevant prices where there could be a pull back or reversal within the sell of percent range that we've seen before and the green trend line is where im most expecting it to pullback.
- - - Should the price reach the lowest purple trend line, this would be 17% sell off. This would be a nearly identical trend seen recently between December 03, 2019 and December 25, 2019 where price dropped 17.5% before changing to the bullish trend.
IMPORTANT: There are small signs of Divergence between RSI and Price chart but ZERO signs of divergence on the Daily chart. Watch for what Time Frame has the clearer sign of Divergence to know the magnitude of the pullback.
Below is a ling of a my previous Idea on SPX500 showing the type of Clear Divergence.

CHK Reversal in the works? LONG is the answerEarnings tomorrow and my dowsing and intuitive work led me to this one. I have indications of a longer term trend reversal. It may dip first, but should be bought.
If any of you know anyone doing kooky stuff like this, please send em my way.
I'm just gonna guess they don't lose as much as expected or some kinda good news, hang on tight! Could be a fun ride.

USDCAD: possible short scenarioTrend reversal might occur in USDCAD..
..the idea is based on strong price movement and breakdown of the resistance level around 1.326.
Joining bears from 1.32615 price with 1.3276 S/L and 1.3202 T/P provides R:R around 4.1
//
Feel free to share your opinion/position via comment and follow me to stay updated.)

EUR/USD BUY SIGNALHey tradomaniacs,
welcome to another free signal!
Important: We need to see how the market reacts at opening regarding to the news from weekend!
Corona-Virus can cause another drop of EUR/USD.
-----------------------------
Type: Daytrade
Market Buy: 1,08140
Stop-Loss: 1,07940
Target 1: 1,08135
Target 2: 1,08435
Target 3: 1,08615
Stop-Loss: 20 pips
Risk: 1-2%
Risk-Reward: 2,5
-----------------------------
LEAVE A LIKE AND A COMMENT - I appreciate every support! =)
Peace and good trades
Irasor
Wanna see more? Don`t forget to follow me.
Any questions? PM me. :-)

EURUSD: possible long scenarioOn Friday there was a spike in EURUSD volatility and we could see dollar weakening.
Joining bulls if breaking 1.0865 price level with 1.0845 S/L and 1.0916 T/P provides decent R:R.
//
Feel free to share your opinion/position via comment and follow me to stay updated.

Europcar LONG (Reversal in trend) Dear readers,
First of all I want to say that this is my first time publishing something on Tradingview. So any tips/support would be appreciated
As I am from Belgium myself I'm somewhat more known with Belgian stocks and I saw this huge opportunity here in Europcar. It might not be the most popular stock, so not ideal for personal exposure for me but so what. I'm here because I'm interested in technical analysis, and then I hope by delivering good work and pointing out good ideas with great potential that exposure will grow.
But for now here is the idea.
Let's look to the broader picture first: As you can see Europcar is in the very long term in bullish territorium but has been bearish for the last year.
Now we can clearly see that the 1 year bearish trend has been broken and that we are moving higher again to the broader picture (Which would be about a 14 euro's, that's where I'm putting my take profit).
I see this as a huge trade opportunity and I'm wondering what your thoughts are. Btw any likes or comments would be highly appreciated to grow the trade idea career :)

APOLLOTYRE : Sign of reversal ??? APOLLOTYRE : Based on trend and support/resistance levels in higher time frames ... if cross above 159.80 in next trading session, can take long trade.
PS: the above opinion is purely my own perception and not trading recommendation.

H&S ShortWe have the following:
H&S pattern
Wait for breakout and pullback before entering. Otherwise I wouldn't advice on taking this trade. + Price action or Fib retracement would be good confluence
Cheers!

Digibyte broke out of the Downtrend!Welcome fellow Tradingviewers,
Digibyte one of the oldest projects around in the cryptocurrency market might just have broken a very important level.
In our last analyses we shared our thoughts on the delisting on polienex and why it really did not even matter.
Without further or due, lets start analysing:
We will be analysing DGB using a top-down strategy, including candlestick patterns, indicators and price patterns.
Monthly:
- The candlesticks are not showing any real signs yet, Neutral.
- We are below the 50 MA, indicating more downside.
- MACD is starting to shift towards bullish territory, but for now indicating more downside.
- RSI is neutral.
- WE BROKE OUT OF A MULTI-YEAR DOWNTREND
Weekly:
- The last weekly candle closed as a bullish engulfing candle, indicating more upside momentum.
- We are below all MA's indicating more downside.
- The MACD has crossed bullish a couple of weeks ago, indicating upside momentum.
- RSI is in neutral, coming from oversold territory.
- WE BROKE OUT OF A MULTI-YEAR DOWNTREND
Daily:
- The last daily candle was pretty much neutral, slightly favouring the Bulls.
- We are currently testing the 100 MA, indicating more downside.
- We are also above the 50MA indicating more upside.
- Break above 200 MA would switch the trend to bullish.
- The MACD has crossed bullish, indicating more upside.
- RSI is in neutral.
- WE BROKE OUT OF A MULTI-YEAR DOWNTREND
In summary:
The break of this multi-year downtrend has not been really spectaculair.
We are still awaiting full confirmation on the breakout but things are surely looking better and better for Digibyte.
A break above the 200 daily MA would confirm that we are once again in a bullish trend!
This multi year downtrend seems to have formed a falling wedge, IF we can get some confirmation, 150, 250 and 350 sats would be the very first targets!
This analyses is only intended to share my idea, to educate and entertain you guys.
This should not be considered as financial advice.
I hope you guys enjoyed this analyses, if you did don't forget to leave a Like !
If you want to share your thoughts, please do so in the comments below!
Kind Regards,
FORALLCRYPTO

BATBTC ready to battle 3400 satsWelcome fellow Tradingviewers,
BATBTC has not shown much traction since we shared our first analyses, mostly just sideways action.
Untill the start of February where we finally retested our MA's for 'one last time' before aiming for higher grounds.
Without further or due, lets start analysing:
We will be analysing BAT using a top-down strategy, including candlestick patterns, indicators and price patterns.
Monthly :
- This last monthly candle wasn't that interesting, but this one is turning in to a bullish engulfing candle, indicating more upside.
- The volume this month is definitely increasing, currently prices are increasing to, indicating more upside momentum.
Weekly :
- The last weekly candle closed in a bullish engulfing candle, indicating more upside.
- The volume on the last two weekly candles keeps on increasing, indicating more upside momentum.
- MACD has crossed bullish , indicating more upside momentum.
- RSI is still neutral.
- Approaching the 3200 weekly resistance, indicating downside momentum.
Daily :
- We clearly found support on the 200MA indicating that the bullish case for BAT is still legit, indicating more upside.
- Above all Ma's indicating more upside momentum.
- MACD has crossed bullish indicating more upside momentum.
- RSI is nearing oversold territory, indicating downside momentum.
In summary:
We can clearly see that the bulls are trying to let BAT take off.
The volume is increasing a lot while price is slowly following, which are major bullish signs.
We still have a long way to go but the first steps are being made here.
The 3200/3400 sats resistance is going to be important for the bulls to break.
This analyses is only intended to share my idea, to educate and entertain you guys.
This should not be considered as financial advice.
I hope you guys enjoyed this analyses, if you did don't forget to leave a Like !
If you want to share your thoughts, please do so in the comments below!
Kind Regards,
FORALLCRYPTO

The new possible ETH/BTC long term uptrend starts now or never. ETH/BTC has broken a geometrical down trendline on the weekly and looks to be trying to start a new Bullish trend against Bitcoin.
With it now sitting right at a very key Resistance Zone that ranges from 0.02618223 to 0.02877095 Bitcoin. If We can begin to maybe develop some bullish candle bar patterns at the bottom half of the zone on the daily then eventually build up to the top half of the zone with a strong weekly or daily close above it; ETH/BTC's Bull Trend will almost certainly have room to move up to the next zone up at 3,658,099 sats.
Definitely something to keep an eye on.

UBER trendreversal confirmed part 2Welcome fellow Tradingviewers,
Our first individual stock pick of 2020 has been outperforming our expectations. Resulting in almost 40% profit without any leverage!
In an Interview the CEO of UBER announced that UBER is going to be profitable by Q4 a whole year earlier than expected.
Besides the great news, we also had a great earnings rapport indicating upside momentum for UBER.
We will be analysing UBER using a top-down strategy, including candlestick patterns, indicators and price patterns.
Monthly:
- We can clearly see that the first month of 2020 has closed in a huge Bullish engulfing candle, indicating more upside momentum.
Weekly:
- The last weekly candle closed in a bullish engulfing candle, indicating more upside.
- The last weekly caandle managed to close above the 40 dollar resistance indicating more upside momentum.
- MACD is in bullish territory, indicating more upside momentum.
- RSI is still neutral
Daily:
- The volume has shown support of the recent price rise, with high volume buying, indicating more upside momentum.
- We are above all Ma's indicating more upside momentum.
- MACD has just crossed bullish again, indicating more upside momentum.
- RSI is showing a bearish divergence, indicating downside momentum.
In summary:
The first month has been incredible for UBER, great earnings and the road to profitability have resulted in UBER retracing almost all the way back towards the IPO price.
We are currently nearing the 43 dollar resistance, before heading towards the 46 dollar resisstance. after this the sky wouold be the limit for UBER.
So let's see how 2020 is going to unfold for UBER but for now everything is still looking healthy to start thinking about reaching a new ATH!
This analyses is only intended to share my idea, to educate and entertain you guys.
This should not be considered as financial advice.
I hope you guys enjoyed this analyses, if you did don't forget to leave a Like !
If you want to share your thoughts, please do so in the comments below!
Kind Regards,
FORALLCRYPTO

ETH double bottem playing outWelcome fellow Tradingviewers,
Altcoins have been taking of for the last couple of weeks and Ethereum does not want to be left behind.
Ethereum is the number two with about 10% dominance in the crypto market, will that rise? Let's find out!
We will be analysing ETH using a top-down strategy, including candlestick patterns, indicators and price patterns.
Monthly :
- The september monthly close gave the first Buy signal.
- The last monthly close was neutral and this one is starting to look like a bullish engulfing candle, indicating more upside momentum
Weekly :
- We found support on the 17500 sats area twice now, resulting in a double bottem, with it's target around 28000 sats, indicating more upside momentum.
- The last weekly close was a bullish engulfing candle, indicating more upside momentum.
- We are currently above the 50MA, indicating more upside momentum.
- MACD has crossed bullish, indicating more upside.
- RSI is in neutral territory
Daily :
- The last daily candle has closed in a bullish engulfing candle, indicating more upside momentum.
- We are currently testing the first real resistance around 25000 sats, indicating downside momentum.
- MACD is in bullish territory, indicating more upside momentum
- RSI is oversold, indicating downside momentum.
In summary:
We can clearly see that we have broken through the 22K sats resistance, tested 23K, retested 22K and are now heading higher. You could say that this was the neckline of the double bottem pattern.
So from now on we expect that ETH is going to act as is usual when a double bottem has formed and this means that ETHBTC should head higher towards the: 27/28K sats area.
Upon reaching this area we will update again.
This analyses is only intended to share my idea, to educate and entertain you guys.
This should not be considered as financial advice.
I hope you guys enjoyed this analyses, if you did don't forget to leave a Like !
If you want to share your thoughts, please do so in the comments below!
Kind Regards,
FORALLCRYPTO

VETBTC following the planWelcome fellow Tradingviewers,
In our last analyses we clearly showed everyone the buying range from 58-60 sats catching the wick of the weekly candle perfectly.
If you would have bought in that area, you would now be in a profit of around 30% which is a nice start for just a few weeks.
Monthly :
- Monthly close above 78 sats would be a big deal because then we would have our 3rd bullish engulfing on the monthly, indicating more upside.
Weekly :
- Last weekly candle was a neautral one.
- We are currently testing the 50MA resistance, breaking above would be bullish, for now indicating more downside momentum.
- RSI is neutral
- MACD is still bullish, indicating more upside.
Daily :
- The last daily candle has closed as a bullish engulfing, indicating more upside momentum.
- We are currently testing the last resistance when it comes to MA's Currently testing the 100 MA
- MACD is still bullish, indicating more upside momentum.
- RSI is in neutral territory
In summary:
The most important thing to watch now would be the breaking of the 50 MA weekly, if we manage to break this resistance then we are almost certainly ready to test the 100 sats area!
This analyses is only intended to share my idea, to educate and entertain you guys.
This should not be considered as financial advice.
I hope you guys enjoyed this analyses, if you did don't forget to leave a Like !
If you want to share your thoughts, please do so in the comments below!
Kind Regards,
FORALLCRYPTO

NEOBTC ready to rise?Welcome fellow tradingviewers,
NEO/BTC is showing some real vital signs. With the mini-Altseason we have had the last couple of weeks NEO has been holding back. But now it might just be time to shine!
Monthly:
- We saw a beautiful bullish engulfing candle back in October, indicating more upside.
- The months after october have been slow indicating more upside.
Weekly:
- The last candle closed in a bullish engulfing cande, indicating more upside momentum.
- We are currently testing the 50MA, indicating downside momentum, unless we break it on the first try and find support.
- Weekly MACD crossed bullish, indicating more upside momentum.
- RSI neutral.
Daily:
- This daily candle is looking like a bullish engulfing, which upon close would indicating more upside momentum.
- Daily cup and handle can be found with the breakout level around 1500 sats.
- we are above all MA's and have used them as support, indicating more upside momentum.
- MACD crossed bullish, indicating more upside momentum.
- RSI is neutrals.
In summary:
The most important resistance to break right now would be the 1500 sats area. If this area breaks, the C&H pattern will be breaking out.
The C&H pattern has a target around 2100-2200 sats, if this C&H pattern is going to show us some real strentgh then we might be heading even higher towards the 2600 sats area, but this is too soon to say right now.
Let's focus on what is going to happen in the 1500 sats area first.
This analyses is only intended to share my idea, to educate and entertain you guys.
This should not be considered as financial advice.
I hope you guys enjoyed this analyses, if you did don't forget to leave a Like!
If you want to share your thoughts, please do so in the comments below!
Kind Regards,
FORALLCRYPTO

ADA Cardano - I am super bullishMy argumentation:
Cardano has been sold off three times for more than 80% - Elliot Wave Theory --> ABC correction coming
Selling pressure seems to be gone since moving in that range, it doesn't seem as if anyone wants to sell it below these prices --> market makers will have to move in the other direction to benefit from the situation
The 200 ema in the Daily setup has been crossed and confirmed with two positive candles, (third today)
RSI came out of negative slope and was confirmed in the weekly.
Ichimoku nice close and room to minimum of cloud (not shown in chart)
Personally I went big time into this setup. Not financial advise!
Happy trading!

ICX - 1 month later analysisAn update of my trading plan
One month after the first analysis, let’s have an update of the trading opportunity we had.
First of all, we also had a weekly higher high; normally the long term downtrend is finished; really good news for investors and bag holders.
The price took the right direction; the technical analysis was not so bad but it wasn’t the toughest part of the job :)
We reach the targeted area (orange circle on the chart) but I have lacked of ambition, the 0.33$ target was too low; the perfect trader would have sell only a small part of his coins at that level and let his gains run higher. I sold 60% at that level and 40% before 0.4$. I could have done much better; but I’m happy to not loss any money.
Now, just a few word on the current situation. The momentum is really impressive and definitely not the time to enter. I will wait for a price correction and maybe make another analysis for the next level. if you are still in (swing trader); you are steel-nerved but don't forget to take your profit (at least a part of). You already made an excellent trade. Will you wait for the weekly EMA100 before correction?
I'd be curious to hear your ideas

Simple Breakout trade for XLMXLM has been on the down and down for years now but it looks like there might be a chance for it to breakout.
Given the right conditions I believe XLM could break to atleast 9 cents in the near future. For longer term targets assuming we can hold prices above 9 cents, our next target would be straight to 13 cents, then 19 cents This will all be very likely so long as we hold the support that i highlighted in green.
Something that wold give me more confidence is if we close the weekly above the support here. Daily closes can be nice too but the weekly wold be safer.
