LTCBTC trendreversalWelcome fellow tradingviewers,
For the ones following me for a longer period of time we have mentioned a possible trendreversal on LTCBTC a couple of times.
After our last analyses we had a small fakeout to the downside with the miners capitulation sending the prices into one last dark hole.
Since then prices have returned to the mean and we are now getting even better signals.
So lets jump straight into analyzing shal we?
Monthly :
- A candle closure above 0.0065 is very likely to happen, this would indicate a bullish engulfing candle of the monthly which is a great indicator for further upside.
- The volume picture is also corresponding with the bullish engulfing, increase in volume + increase in price = upside potential.
- Next real resistance would be located around 0.008
Weekly :
- This weekly candle is also trying to become a big bullish engulfing indicating more upside to come.
- Weekly MACD crossed bullish which is a big thing (if you want to know why check our last analyses)
- Resistance located around 0.007
Daily :
- 5 candles ago we had a bullish engulfing candle indicating more upside, which seems to take place as of today.
- Daily closure above 0.0069 would mean that the 200 daily moving average has been overtaken, which would mean that the TREND has CHANGED !
So depending on the daily close of today you could state that the trend on LTCBTC has changed and that we are now once again looking to open long positions.
LTCBTC is soon getting its own ASIC miner which would make the mining of LTC become more profitable indicating that more people will start mining again.
So in summary:
We are really bullish on LTCBTC if we get a closure above the 200 (D)MA and a bullish engulfing on the monthly, then the trend is changed in our opinion and we could be in for a long lasting bullrun.
This analyses is only showing you guys our vision on LTC and should not be considered as financial advice. If you agree or find this analyses useful let us know in the comments below and don't forget to leave a Like !
Kind regards,
Forallcrypto
Trendreversal

ETCUSD: what's going on?One week ago on Sunday (12th of January) Ethereum Classic completed the "Agharta" hard fork, which makes it "more interoperable" with sister-chain ethereum.. whatever that means, ETC more than doubled its value in a couple of days during the week.
Technically speaking the price broke out from the descending bearish trend, which provided a good signal for possible trend reversal and opening long positions on 12th of January..this proved to be a good idea! However, 2 days ago (on 17th of January) the price formed a kind of a shooting star candlestick chart pattern (which was more like an inverted hammer pattern but in the up-move), so at the moment the correction or realization of profit is taking place.
Now the question is how deep is it going to be?
I think buying now is more like a FOMO, so it's better to wait for a correction at least until 61,8 fibo retracement level, which is around 7.39 price.. from there it's possible that we are going to see a rebound and continuation of the uptrend.
If playing the above mentioned scenario, the target can be around 9.85 and stops below 6.645 (R:R=3.3).
It's also possible that we are going to see a deeper correction to 5.88 price level..so everyone should calculate and implement their own risk management strategy.
ETC annual yield: 1,023%
//
Follow me to stay updated.)

Divergence near support EurChf Weekly divergence near support level. Expect trend reversal. Waiting for buy opportunities.


Rounding bottom formed, how far can XINHWA go? Thank you for continue following us:)
Strategy: Bullish Candlestick Chart Formation
Swing
Bias: Bullish. As the chart above shows the rounding bottom was formed in last three months. The stock price broke neckline at RM0.465 of the rounding bottom. An earlier signal was when the stock price broke RM0.435 sideway consolidation and at the same time made a Bollinger Band breakout.
Earlier, we had traded the short term opportunity from this counter, entry at RM0.435 and TP at RM0.480, based on Bollinger Band Breakout Strategy.
Time to look back for mid term opportunities.
The share price is expected to complete the cup reversal at RM0.55, potentially 12.7%, after the resistance of RM0.520 and psychological resistance of RM0.500
Stop-loss: 0.465
1st Target: 0.520
2nd Target: 0.550
Gentle Reminder: Plan your Trade, Trade your plan.
Kindly like and comment to support if you agree with this trading idea!

Bullish ReversalA pattern is being painted but wicks are making sure stops are triggered.
If this plays out try to long the pullback at the breakout.
Be careful, don't long resistance as this may just continue down.

Trade Ideas Position: USDJPY CrabA bullish crab setup, deeper than a bat pattern that I was waiting for, a checkback has happened and made this a valid trade to consider to engage.
Trade engaged as a trend reversal on a larger timeframe - daily chart.

USDJPY-Weekly Market Analysis-Dec19,Wk5A bullish bat setup without breaking the uptrend consolidation on 4-hourly chart(bullish flag) and opportunity to engage in a better price for a trend following trade or a trend reversal trade on the daily timeframe as a head and shoulders bottom setup.

VETBTC trendreversal confirmed part 2Welcome fellow Tradingviewers,
In my last analyses i showed you guys the falling wedge that we have been trading in for the last year or so, and we now broke out.
Since then there was some news on Vechain again.
- The cold wallet got hacked resulting in the loss of some funds
- The Chinese Walmart is going to use Vechain to make a platform for food safety
So there has been some mixed events going on, now lets go to the price action:
Monthly:
- Last one closed in a big bullish engulfing candle
- The current monthly candle is showing a huge wick to the upside
Weekly:
- The last two weekly candle seem to be indicating a rejection and could lead to more bearish momentum
- We closed below the 50MA weekly
- RSI still in neutral territory
- MACD still bullish
Daily:
- We broke the daily 50MA next MA suppport is located around 60 sats, where currently the 100 Ma is crossing above the 200. Making a golden cross
- last daily close was a Bullish engulfing candle while bouncing on support, indicating upside
- MACD is in bearish territory
- RSI is Neutral
- We are in the early stages of forming a cup and handle pattern on VETBTC
So what's next?
There is still some room for downside momentum, as long as bulls are able to defend the 60-65 sats area the cup and handle pattern will be valid.
The cup and handle neckline is located anywhere from 90 to 100 sats, the conservative target upon breakout is located around 140 to 150 sats.
Cup and handle patterns usually have a very strong breakout, so make sure that your bags are secured before the breakout!
This analyses is only showing you guys my vision on VET and should not be considered as financial advice. If you agree or find this analyses useful, don't forget to leave a Like!
If you have anything to say about this analyses ypu can do so in the comments below!
Kind regards,
Forallcrypto

Trade Ideas Analysis: USDJPY Ascending TriangleAn interesting development of this trade, yes indeed is quite troubling when you have 100pips of running profit and the market just stall and fail to break new high, nothing is more painful when you see magic candles form after a bullish candle.
My immediate thought is to close and take the profit, spend it on Xmas and call it a year, but wait up...
It does look familiar, yes, ascending triangle, another breakout(towards the upside) setup.
Always sit back relax and use APE. Analyse the market, Plan your trade and Execute your order.


USDJPY-Weekly Market Analysis-Dec19,Wk3USDJPY has performed well in an extension move off the bullish bat pattern, target1 has achieved and the crucial push depends on this week the US tariffs that are due tomorrow.
The candle that touches the previous high and fails to close above the previous high is a concern to me.
Monday market movement will determine if I'm going to keep the trade or an immediate exit of it.

Trade Ideas Position: USDJPY GartleyUSDJPY on 1-hourly chart fulfils a bullish Gartley pattern. Well, it may look odd in my chart but this analysis shows up well on my live chart(check your data).
Traders who want to have better Reward:Risk(RRR) can wait for bigger bullish bat pattern to show up.

POSSIBLE EOS RESVERAL BITFINEX:EOSUSD tested the multiyear trendline and held, On the 1D we observe an inverted three rising valley pattern (quite visible on the inverted chart) which is an indication of the short term reversal.
targets for the completed pattern is $4.79 i indicate take profit zones to manage the trade
The trade is invalidated if price trade below $2.45.

LTCBTC ready for a trendreversal?Welcome fellow Tradingveiwers,
This analyses is only showing you guys my vision on LTC and should not be considered as financial advice. If you agree or find this analyses useful, don't forget to leave a Like !
Monthly :
A lot of wicks in the last couple of monthly candles, could show indecisiveness in the market.
Weekly :
Candles are not looking to promising
Also far below the MA's
But there is a huge RSI and MACD convergens which cannot be ignored.
For the ones following forallcrypto on the other social media channels, you have all seen how the bullish MACD crossover on the weekly helped us predict the bottem of BTC back in the start of 2019.
So we value this HUGE MACD and RSI convergence as a pretty bullish signal.
Daily :
Candles are indecisive slightly below MA's and not a lot of volume.
Start of the formation of a triple bottom formation.
4H :
We are currently moving inside a descending channel, which would be bullish upon breakout.
Clearer view of the triple bottom formation seen.
Triple bottom patterns are known to be reversal patterns.
MACD RSI ready for bullish momentum.
What's next?
We can now clearly see that we are forming a triple bottom while the weekly MACD has crossed bullish, the RSI has been at a flat level for some time now and also showing a convergence. Becasue the LTCUSD chart is currently forming a double bottom this could become a explosive breakout WHEN we breakout.
If this triple bottom has enough strength to break the 200 D MA then we can begin to speak of a trendreversal. But for now it is to soon. The target of the triple bottom in BTC terms will be around 0.0082 sats and would now be just short of the 200 D MA. I can't wait to see how this plays out.
If you guys liked this analyses please let me know in the comments below!
Kind regards,
Forallcrypto

Looks like coffee's making a double bottom.Looks like a double bottom is being completed.
Bullish reversal anyone?

Bitcoin about to make a move?Hello Everyone~
We can see from the chart above that we are at a minor resistance level ; if we fail to break above the downward arrow resistance line out of this falling wedge , I predict further sell-off leading to bitcoin finding a new bottom in the high 4 to 5 thousand range. This would fulfill a rough head-and shoulders pattern that has been progressing for the last few months.
However, if we do break above the immediate resistance, we still have to put up with the greater pattern at hand, the greater falling wedge .
So, until we break above the resistance of the current falling wedge pattern, I will remain bearish for the short to mid-term..
Bitcoin is known for doing the craziest things though, and anything could happen. Will this be the swing that takes us out of the bearish pattern, or will she fall further before finding major support?
Let me hear what you think in the comments down below!
Cheers everyone!
-FractaLJack

VETBTC trendreversal confirmedWelcome fellow Tradingviewers,
This analyses is only showing you guys my vision on VET and should not be considered as financial advice. If you agree or find this analyses useful, don't forget to leave a Like !
We can clearly see that VETBTC has broken out of the falling wedge it has been trading in for the last year or so.
Monthly :
We have seen a huge bullish engulfing candle, with a lot of Buying volume last month which indicates a lot more room for the upside.
Weekly :
We have closed the last weekly candle in a huge bullish engulfing one, indicating more upside.
We have also closed beautifly above the 50MA for the first time since this chart is live.
Volume is increasing and seems to be confirming our positions.
RSI and MACD are still nowhere near bearish territory.
Daily :
VETBTC is now fighting the first taking profit zone at 100 sats after seeing some sellof at 93 sats, we are now ready to try to test 100 after the beautiful bullish engulfing candle 2 days ago.
The volume has been starting to increase on the way up, which usually is a very bullish sign coming out of a wedge like this.
We are also above all moving averages on the daily graph which gives us even more confidence that the prices are going to keep on rising.
RSI , MACD are also bullish on this breakout and ready for another leg up.
What's next?
We have set three targets from the falling wedge, they can be found at 100, 160 and 220 sats.
Depending on how fast and well these targets are going to get reached will change our trading plan, but as we know falling wedges usually indicate a trendreversal and it is not uncommon that they easily override their targets!
If you have any questions please let me know in the comments below!
Kind regards,
Forallcrypto

Trade Ideas Position: USDJPY SharkA long waited bullish shark pattern setup is finally here. Trade has engaged as a countertrend trade for most but its a trend reversal trade for myself.

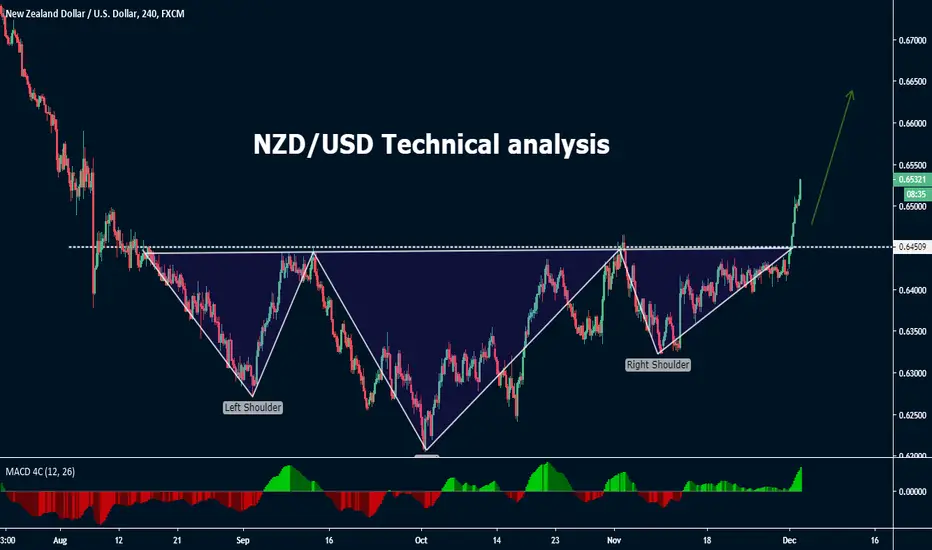
NZD/USD Technical analysisThe counter has formed an inverted head and shoulder pattern.
It has broken out of the neckline with a strong bullish candle.
Hence, we expect the pair to be bullish in the near-term.
USDJPY-Weekly Market Analysis-Dec19,Wk1A final break and close above the high on the daily chart shows the 1st sign of a potential bullish run.
A retracement and additional break and close above recent high will further confirm it. At this moment I will be waiting for this bullish shark to set up and head in for a trend reversal trade.

USDJPY-Weekly Market Analysis-Nov19,Wk5If you have been following on my trade analysis, you should know that I'm waiting for a buying opportunity on USDJPY for a trend reversal trade.
There are 2 strategy that I am waiting for to engage the trade.
1) Bullish Shark on the 4-hourly chart
2) Deep Bullish Gartley on the 1-hourly chart
As the level is close to each other, I chose the Bullish Shark setup on the 4-hourly.
The reasons, for this reason, is as follows:
i) I spotted the bullish shark pattern weeks before the forming up of the bullish deep Gartley on the 1-hourly(Trade what you see)
ii) the forming of the deep Gartley pattern broke 2 of the critical rule on Point D completion(if you learn from the right school ahem.. you should know, if you truly don't, then the source of your information may be way off)
iii) reward is to risk ratio of the bullish shark is way better than Gartley - well this is not the reason why I do this, but to many, this might be, not here to judge but I see that the 1st 2 reason is more important. Simply mean if I spotted the deep Gartley first and none of the critical rule is intact, I will trade base on the deep gartley target.
