BABA is showing signs of lifeWith respect to the tradingview community there are several instances when the majority of opinions on any given security are sell when it is probably time to buy and vice versa. In my humble opinion the former scenario is in play as far as BABA is concerned, short term at least. We see a loosely formed inverse head and shoulders (there is not a clear right shoulder but price action may qualify) with an upward sloping neckline (very bullish), as well as renewed volume coming into the stock, and the Awesome Oscillator showing that a trend reversal may be happening as of now. In roughly 1-2 weeks time we will have more data to analyze, lets see what happens.
Trendreversal

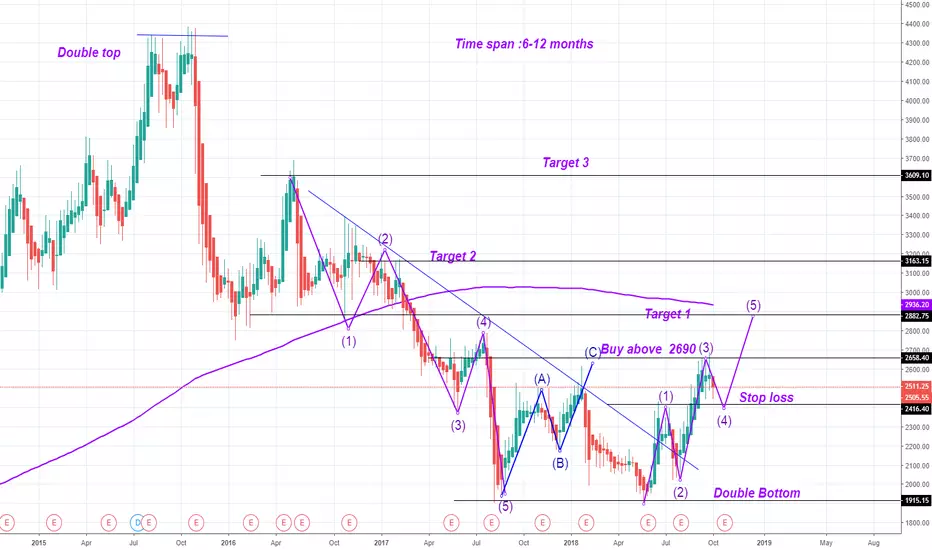
CHATBTC off to the races soon! Santa's been filling his bag!Analysis:
Whoever has been filling their bag, it must be as large as Santas... Weak hands are folding. We see an opportunity to go long on the current support.
Entry Point:
We are waiting to see if price will continue to drop and retest the lower support. If support at 320 holds we will go long, if not we will check again on the next support area around 270
Take Profit:
The green lines represent target take profit levels. We suggest cashing out 20% at T1, 40% T2, 40% T3 (or sell 20% and let 20% ride if it still looks bullish ).
Another way to consider looking at my take profit levels. First target is shorter term, 2 and 3 are mid term, and 4+ are longer term. If you want a quick trade, dont expect to hit T4, just close it all on T1.
Stop Loss:
If we enter @ 320...Stop Loss suggested at ~270, which is below the liquidity pool and established local support levels.
Upon completion of T1 move stop loss to 600ish to secure a risk free trade. Additionally continue moving stop loss up by one target each time a new target it reached. i.e. when T2 is reached, move stoploss to T1 level.
This way you can ride out dips with no anxiety and automatically exit the trade in profit should you not be around to monitor!

DR Reddy Lab - Possible 50-150% up side move in a YearTHe Technical shows that major trend of DR reddy is bearish and it's about a correction and about to trend reversal.

GBPUSD - Trend Reversal, Completion of RetracementThe rising trend for GBPUSD has shown signs of reversal since it fell from near 1.33 and broke below the bottom of its rising channel.
This is always a clear sign of the beginning of a trend reversal and the break was strong which created a new low.
The price has then retraced as it climbs gradually and is about to reach the top of another rising channel created from the retracement.
Thus, the supply zone where the retracement is most likely to be completed, coupled with 618 retracement level, could be an opportunity to sell short the GBPUSD.

XRPBTC has officially created a higher high What does it mean?Well its official XRP/BTC has officially broken out of the downward channel with a strong push up. it actually broke above the last push up on April 20. Look at the chart they don't lie. Now we need to find support on the old resistance that was our downward channel and spring off and create a new high. We will have to wait and see if the bulls can pull this one off but it has me excited. Lets go bulls and turn around this trend and create a second higher high!!!!!


AUDUSD - Potential Head & Shoulder Bottom at Right ShoulderEarlier in the week we did some higher timeframe analysis on the AUDUSD and saw that despite being in a bearish trend, we've reached a level where the sellers may be losing interest & could be in store for a potential reversal.
A classic way that the market reverses is in the form of a Head & Shoulders pattern.
Thus far we have 3/4 of the pattern complete as we're currently trading at what could be the right shoulder. If price were to violate the neckline in would confirm the reversal pattern and we could project a move higher to the .7300-.7350's level
Akil
For more on this idea, please see the link below to my latest (non Trading Coach podcast) Youtube Video

Trend reversal with inverse H&S on the 4 hour?Thoughts are appreciated very much! I'm not looking for followers necessarily but I am looking for edification. On the current 4 hr, ONT has passed the 55 and 100 EMA's

USDJPY - Short-Term Trend ReversalUSDJPY has been fluctuating within a range between near 112 to 110 as the market is still filled with a lot of unexpected events and causing a lot of uncertainties in the market.
The price is now seen trading at the top of the range and is likely to reverse and fall.
To confirm a reversal, I have waited for the price to break below the rising trendline, and secondly, a retracement back to the trendline resisted and fall again.
There is an obvious space for the price to fall further, and thus we can look to short again within the supply zone.

MNKD - Next Resistance Level 1.5, or Reversal of DownTrendLooking for a resistance level that causes a reversal of trend. You can see the 2.01 resistance level was hit on 9/6, and 9/7 the price fell through to 1.78. If the downward trend continues, the next resistance level to be hit would be 1.5. Substantial sell volume on 9/5, 9/6 and 9/7 could be indicative of a higher likelihood for a trend reversal early next week.
According to Chris Lau at InvestorPlace, a 10 yr discounted cash flow revenue exit model values shares at an average of $2.40, placing the stock at a current discount of 20/25%, assuming revenue increases due to the new partnership with UTHR.
finance.yahoo.com

EURUSD - The $1.15 level Is Important To MeHey traders!
I've had a lot of request here on tradingview to provide an update on my $EURUSD outlook so here we go. However, before we get into that please understand that as a longterm swing trader, my views don't change too often. There are a handful of levels in the market that are important to me & most of what happens within those levels has no effect on my longer-term outlook.
On the chart above, you can see that price never pushed high enough to change my longer-term opinion. However, i would like to see some more confirmation before looking for ways to get short and that confirmation would be a violation of the $1.15 level.
As always I'm wishing you guys a great week of trading. I'm excited to be back in the markets just in time for the volatility spike. Good luck out there!
Akil

END OF TREND CONFIRMATION1. Divergence
2. Trend Line Break
3. 123 Reversal Pattern
123 Reversal Pattern:
At point 3, the market is at
the crossroads and price can
either make a new low or
confirm a change in trend
once price takes out point 2.

EURUSD 1 Day - A Shift In Longer Term ViewsI'm taking some time off from trading with the addition of a new family member, but of course I couldn't completely stay away so I wanted to come in and give you a quick update on my EURUSD views. (For some perspective you may want to go back and look at my previous post & videos discussing the Euro)
With the violation of the neck line we officially have the completion of a head and shoulders bottom which has formed right after the completion of a bigger head and shoulders top. Despite this being a classic reversal pattern, there really isn't too much room for expansion within the key level of the underlying trend.
So here are my views.
As long as price does not violate the blue line, then my overall bearish bias remains. HOWEVER, if we end up violating the green line then I'll be looking for yet another reversal in trend and a move that can continue much higher.
If price remains inbetween those 2 levels then I honestly have no interest in the pair until a clear direction is determined.
Akil


Copper Wave AnalysisPotential long position forming with Copper on daily chart. Using simple wave analysis, Ichimoku overlay, OBV and MACD indicators, signs of a trend reversal in Copper are showing adequate confluence. The daily chart for copper is a good example of plotting Elliot waves. As you can see, ABC corrective waves has fallen between impulsive waves 3 and 4. This is a good general signal of the continuation of the impulsive wave structure.
The Ichimoku indicator is a very reliable indicator in my opinion for confirming trend reversals. When the conversion line (blue line) crosses above the base line (yellow line) following a re-tracement it almost always signals a confirmation signal to the new direction of the trend. Its limitations (perhaps in this case, too early to tell) is that it can give false signals if the security is not clearly trending, as in its forming a triangle or bound in a tight horizontal channel.
The MACD shows that a cross over has already occurred and looks to continue to move higher. The On Balance Volume indicator is showing signs of divergence between the lower lows of Copper and the OBV price line, however, the divergence is not strong but adequate.
Volume is at very low levels which is always a good forward signal of an impulsive move in either direction. For a strong confirmatory long position, wait for a definite cross over in the Ichimoku base and conversion line. It is best to place a buy after a candle has completely closed above the conversion line. Other confirmatory signals such as increased volume and a strong positive move in the OBV are also solid signals of a beginning trend.
Watch it closely the next week to see if it is starting a new trend or forming a triangle/flag/wedge.


BTC where lies its reversal?So if we look at the past for a trend reversal we see bitcoin has to drop a bit more. Looking at it's current trend. I expect it will reverse at around 5300 mid november latest.
We shall see.

Possible ETH Double Bottom (DAILY) w/Fib TargetsAssuming ETH catches support here at the projected (fib based) bounce zone, it could be setting up for a nice double bottom. If so, I've set some target goals also based on fib retracements. For the crypto world this might be a longer swing trade.
I would SET STOPS in case it fails support here. In that case I would be looking for a bounce at the next inverse fib target.

BTC accumulation progress, big play !Do you see it? The wealthy are buying bitcoin with every possible dip... this is a pattern which occurs in a trendreversal before a bullrun. I am lighlty panicking with my alt positions as well, but I still do have about 25% present... And when it is confirmed I go in with leverage on the top coins from the moment the first peak occurs. The awkward feeling is a good thing, and I am buying with every dip low cap alts. Possibly there will be 1 major dip, which will be bought within the hour, perhaps when volume goes through the roof.. you have 1 chance of catching a falling knife ! And then you know it is for real...
How do you feel? Quite unsure? Good !
PS: The chart on the left is now, the chart on the right was before the bullrun last quarter 2017

Looks like ETH has hit bottomEthereum's price action looks to be bottoming out at a psychological support of $430. Heiken ashi is showing a possible trend reversal in the next few hours. While from our oscillators we have a divergence from MACD and a much stronger one from RSI. Bollinger Bands are also showing a weakening trend by price consistently failing to hit lower band. We very well could be in for a trend change on ETH. As a trader, I would recommend waiting for a more confirmation such as price breaking the upper resistance band on high volume or MACD to cross center line. Either way, rest of the day looks green for ETH if it can maintain current support level.

AEM - Continuation of UptrendCo has declined 48% since peaking in Mar this year and has been turning up on the SMA 13/26.
Supported by the recent resistance turn support at 1.17 after breaking above with high volume, expect the uptrend momentum to continue after the current consolidation.
Next resistance at 1.32, stop loss at 1.16.

Tianjin ZX: Continuation of UptrendSMA 13, 26 crossover indicate potential reversal from the downtrend and starting to trend up.
Recent correction provide an entry opportunity to ride the uptrend.
Immediate resistance at 1.23, next resistance at 1.30. Stop loss at 1.07.
