Synereo trend reversalWe could possibly see an upward trend starting on BITTREX:AMPBTC with a daily close above or around 2100.
We found support in the same area as December all time lows and had been sitting there for the past week.
RSI has been oversold or close to it for the past 2 weeks, and is moving upward but not spiking.
MACD will confirm a bullish signal line crossover heading towards the centerline with a daily close positive.
There will also be an upper bband breakout and a possible 3 white soldier set up in play if the we close green.
Volume has basically bottomed out, so I would like to see an increase to confirm the reversal.
If we close above or around 2100, with decent volume, I think we could reach ~2500 the following day testing recent resistance, before we continue the upward trend by this weekend.
Trendreversal

DOGE Long OpportunityThe same to Doge like other recent chart analysis we made. Falling wedge and ready to breakout after a volume increment in the following days. RSI downtrend and price downtrend already started an uptrend and RSI at 37. Just a little bit volume will begin the rally.
Entry Zone : 39 - 43 sats
Potential Targets :
Target 1 : 46 sats
Target 2 : 51 sats
Target 3 : 55 sats
Target 4 : 59 sats
Target 5 : 65 sats
Target 6 : 72 sats+
Good Luck.
Legal disclaimer:
Information on this channel is our team's analyst's "opinion" based on data available at this point in time. These opinions are not recommendations to buy or sell securities/commodities and cryptocurrencies. Trading and investing is a risk and you should not rely on this data to make any financial decisions. You must consult a financial advisory licensed by regulatory agencies in
your legal jurisdiction. All information stated here and in our reports don't guarantee any possible profits or losses. Please do consider to do your own due diligence and research when making any kind of a transaction with financial implications. With Regards. TeamTWA.

GE - Ready to star an uptrend?GE has been in a downtrend path for all the 2017 and 2018, most of the time even under the moving average 50 days (blue line), and the price just once tested the 100 days trend line (orange moving average).
Today, the stock is closing almost with a +8%, after the company announced his plans to spin off its health-care business and sell its participation in the oil-services company Baker Hughes.
Maybe is too early to say the downtrend is finished, and the company still faces some risks in the short term, as some expected downgrades in his credit rating, and his recent reality after it was removed from the Dow Jones.
From the technical analysis view, there are some key elements: A) possible double bottom formation, around the $12.75 area, and B) a possible MACD bullish cross in the daily graph (left).
Before to go long, I will wait for some confirmation signals for the next days, such as: 1) keep price action over today GAP ($13.5); 2) price action over the moving average 8 days (green line); 3) golden cross between 20 and 50 days moving average; and lastly, but not least important 4) stay above the long-term trend, the 200 days moving average!

A POSSIBLE, BALANCED TRAJECTORY FOR ETHEREUMWe all want to determine start and finish of the cycles, bullruns, bear markets, etc. I can say this is a quite objective approach and a very likely follow up for Ethereum, especially with the steadiness.. quite comparable to BTS, which made an example already of a more bullish scenario.
We have to see the outcome of BTC of-course, but in time which is a very important factor as well, we are consolidating volatility is steadily fading. Hope for a trend-reversal soon!

GBP/JPY Technical analysisThe GBP/JPY has been constantly forming a bearish flag and extending its downtrend.
Now the pair has again formed a bearish flag.
As per our analysis,once pair the breaks out below the trend line,we can expect the downtrend.
On the contrary,if it makes a bullish crossover above the resistance,we can expect short covering from the bears.

EURAUD possible fallMonthly rejection on the resistance level. The big shadow candle gives a good opportunity to sell on the resistance zone.

Looking For Retest On Broken SupportBullish power since Aussie open. Looking for a failed retest of the broken support to confirm trend reversal.

BTC Potential IHSBitcoin has lost a lot of momentum in his move down. If we don't see a retest of the resistance soon, we will see a move up! This would verify the IHS, the IHS-target would be ~6800$. Reaching this price level would mean a breakout of the local downtrend.
I am opening a long here, looking to take profits at every individual fib retracement. The 0.382 is my main target here.
My stop-loss is right below the resistance at ~ 5950$

BitcoinCash (#BTC): possible trend reversalJust TA!
I hope you enjoy my charts, please writte your comments, hit that like button or follow me. Thank you!

AKAM potential downtrend aheadWe have seen AKAM in an uptrend for almost a year. Important price level/supply zone at around 78.00-78.40 seems to still have an important role.
Of course this needs to be confirmed on lower timeframes and last higher low needs to be broken first.

[EUR/USD] Clear 1.15 rejection; possible long opportunityPrice is showing a significant rejection really close to the 1.15 level.
This might form up a double bottom in the trading session tomorrow.
What might happen
> Trade opportunity / trend reversal

NZDCAD reversalNZDCAD moved to the downside in a very clear channel and has now broken out with some strong green bullish bars. My bias shifted to long so I'm looking to get in to the upside.
Take a look at my previous idea where you can see I called is early and made a great run/profit.

BTCUSD almost going to bounce back?It looks like the end of a huge equilibrium pattern. Could it be the end of the downtrend that started 12/17/2017? What do you guys think?

break-out of the triangle postponedAs most people are bearish on bitcoin, I am quite sure it will go up from here, or at least around the 8000 usd level. If we can see previous indicators, it all points to a consolidation where most topcoins are literally obliged to make some action, and more probably to the upside. The falling wedge is not yet invalidated, as a bounce of the pennant is still possible as a lower visit within the pennant. On the longterm we have in time even passed the pivot point which indicated a reversal. We are nearing a very very important point of decision. I cannot believe most people are willing to sell at this time, only if you're a daytrader perhaps.
I'll be posting other TA on topalts, which look even more bullish, especially XRP and TRX.

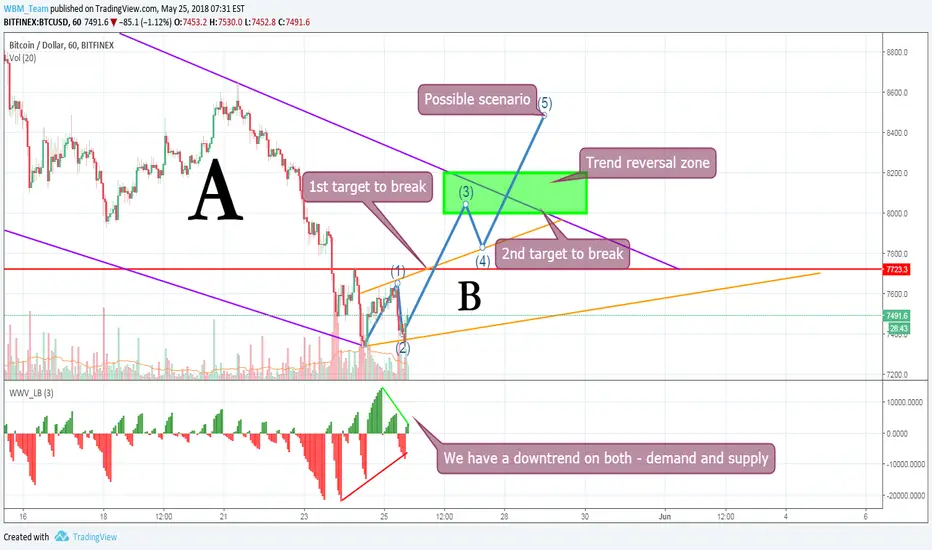
BTC - silence or storm?Hi Guys!
We are back with the new view and new charts.
It is not a secret we are in a corrective downtrend. How deep can we fall?
There is more than one answer.
First of all we have a super big support at 6000$. We call it profitability level below which, miners simply don’t earn money. We won’t go below that level. We vastly described why in our previous analysis. You will find it down below.
Moreover we have long term support which is currently at around 6900$ level. We shouldn’t go below that.
So what has to happen to break the correction tunnel?
First of all we have to break 1st target which is at 7700$ level . It would mean we are out of the B tunnel – goooooood. OK but what next?
We are still in A downtrend.
Once it is broken we have a chance to move forward breaking our 2nd point/level which will be at around 8100$ . Once broken for good we are more likely to follow the pattern 1-5 of Elliot’s Wave.
8100$ is also breaking point of the longterm trend. Look at the chart below the analysis.
According to the Weis Waves there is significantly lower volume on both sides – supply and demand.
It looks like stabilization.
Remember after such a massive drop there will be fast recovery. Look at the historical peaks and bottoms.
So guys keep observing BTC and of course our profile.
If you like our job give us a like. Do not hesitate to comment. We are very open and value your contribution!
If you don't want to miss out updates don't forget to follow us!
HUGS!
WBM Team
An alternative scenario : Basic EW bullish count !Hi,
For some obvious reasons, I continue to think we are in a krach, BUT market is always right so here is my alternative scenario considering the breakout of the downtrend line is not a bulltrap. This is a basic Elliot wave counts doing in the rules (waves rules, and fibonacci's retracements), DON'T take care of the timeframe.
In this case 7500/7600$ area could be a strong entry point for long term positions on BTC.
Cheers.
You can see my primary count in the link.

ONT is just finished the downtrend and is reversing the trend!!!Hello Lads and Ladies,
Looking at ONT we just saw a breakout from the descending triangle. The pattern that ONT has is very clear - 3 increasing spikes followed by 3 decreasing spikes. A few moments ago the descending triangle was completed and directly followed by a short breakout. Now we are entering the trend reversal phase in a elliptical move upwards. The first target lies slightly above the last second decreasing spike - 0.0010500 sats. From there on the second target will be around 0.0015000 sats, followed by short break and then the third push which is historically almost 100% above the last third increasing spike. According to that this would be at 0.0024000 sats, anyhow I would take biggest chunk out at 0.0020000 sats.
Cheers, Tomas

WB ready for some bullish days30 min candles show $WB is climbing out of a falling wedge, RSI forms an ascending triangle, RSI lows climbing out of oversold zone. Just got a long position - getting out when it breaks to the downside or scaling out on any big pump to the upside.

EURUSD 1H Divergence of Price vs. MomentumEURUSD 1H Chart:
Momentum was falling, while the Price was rising - the AutoDivergence Study fired a Sell-Signal!
Price might fall to the Daily-Pivot - this is the Profit Target 1.
Profit Target 2 and the Stop Loss Level are based on backtesting results of the AutoDivergence Strategy.

Support is holding on #BOTZ - #ETFs #stocks #trading #investingWeekly timeframe is my favorite and this shows a great support level that once again held; pretty significant pin candle last week, good level to go long from here.

Trend reversal GBPCAD, getting in on a pullback: SHORTGBPCAD look strong moving up but “The trend is your friend until the end when it bends”. Well, that time is now. Price even broke the 1.76000 trendline on the bigger time frame.
I’m looking to get in SHORT on the first pullback. Probably around 1.76400.
TP 1: 1.68000
TP 2: 1.59000
Also check out my analysis on the GBP Futures:

GBP Trend reversalThe Great British Pound is not so great anymore. Terrible numbers hammered price down and now it also broke some critical levels.
Now that 1.3730 is out of the way I’m looking for a pullback into these levels to get ready for trend contuniation (short) on different currency pairs.
I’ll link this chart to some setups we’re seeing now.

The GBPCAD Breaks Further Support LevelsWe last posted on the GBPCAD on April 5th when price had broken below key support in the form of the round number 1.8000 and the weekly 200SMA cluster zone.
This in itself was not a major concern to our long position as support and resistance levels are not hard levels but zonal areas. Price can and will often dip below support levels in pullbacks in a bull trend before the bulls push price action back in the direction of the major trend. Likewise with resistance levels in a bear trend.
If price continues to weaken, we then look for the next key support levels to hold strong. With the GBPCAD, this was first with the daily 50SMA and then the pivot high of January and then finally the pivot high of December. Further weakness on the GBPCAD meant price made light work of the daily 50SMA and the January pivot and is now directly at the December high.
This is our last barrier to staying in this trade which we will then look to exit with a small loss.
Amongst several elements that are the key ingredients to good trading is the understanding of impeccable risk management across multiple high-probability instruments. In an ideal world, every trade you place works out, and that can happen. But what is far more likely to happen is a mixed bag of winners, losers and break evens. The percentage break down of this will vary year to year as market conditions are organic and unique year to year and market to market.
The focus should then not be on how many winners you have but on how large your winning trades are. This is achieved by cutting your losers short and letting your winners. And then compounding into winning trades only. The significantly larger profit from the winning trades will absorb the smaller losses from the losing trades and also go on to grow accounts.
The challenge that many face is never staying in a trend long enough to ever see the power of compounding in action. This is not due to a lack of ability but due to a lack aligning oneself with the natural movement and features of the market. The focus is always on the money first rather than the process.
For one to grow an account effortlessly, year in year out, your knowledge first and foremost has to be worth more than the money you have.
Holding 5 trades throughout the duration of say an 8 month trend is significantly more powerful in growing an account compared to opening and closing multiple trades a day. The latter is simply advertised as the sexy way to quick money but there is never anything sexy about compromising time for money and in the end not achieving success.
The GBPCAD is looking like one of those currency pairs that may not deliver this year compared to say the EURSEK which currently is looking far more promising. But we are still in the GBPCAD and price may bounce tomorrow and have a very different outlook in the following days.
Only time will tell.
Any comments or questions, do not hesitate to leave them below. Hit agree if you share our sentiments!
Sublime Trading
