Has Sugar Bottomed?I just wanted to take a moment to share this bit of insight. I'll try my best to be brief in my analysis.
What you see is a continuous chart of Sugar futures. In my opinion, I'm thinking that there is a reversal in trend that is about to take place and here's why.
The first thing that you may see is the downward slopping trend channel which began in October of last year which depicted a clear bear market. In late June of this year, prices broke through the bottom of the channel and created what I consider to be an obvious selling climax. Preceding the climactic selloff was a shortening of downward thrust, which showed stopping action in the market's selling. Since then, prices have moved sideways, creating a base. One thing that stands out about this base is the fact that the supports continue to rise, which is an indication that bulls are buying at higher levels each time the price falls. As I type this, prices are at the top of the range. Does this mean that there will be a breakout? I wouldn't go that far. After all, there was a false breakout on July 31st, which was checked at the overhead resistance area of the April '17 low.
Another case for a bullish reversal, going back to the selling climax, is that the wave volume shows continuous increases in volume in the buying waves. Such action indicates that demand is overcoming supply. Something to note is how prices are pulling away from the bottom of the channel as it forms what may be an accumulative base.
Conclusion: I'm gonna have to see a strong close above not only the top of the accumulative base but also above the April '17 swing low. Such action will be a signal to get long following a pullback to test the breakout area. On another note, I find it interesting that Sugar, or any commodity for that matter, is setting up for a potential move to the upside as the U.S. Dollar is about to make a strong move to the upside as well. A strong dollar is usually bearish for commodities, but hey, we can only listen to what the charts tell us, right?
Trendreversal

Higher TF Short, Lower TF LongW/ the Monthly candle closing bearish engulfing suggests we can anticipate a retracement of the rally the Euro has seen against the dollar
On the Daily TF we can see the formation of a Head and Shoulders pattern beginning to form the right shoulder
On the 8H TF we can see price has almost formed a Bullish bat as it gets closer to 88.6 Fib level
Will be monitoring Price Action @ 1.17 price to see if we get a Bullish set up
If we do see a push back to upside we can see targets @ 1.191
From there we will be looking for Lower Lows and for price to show a trend reversal to the downside


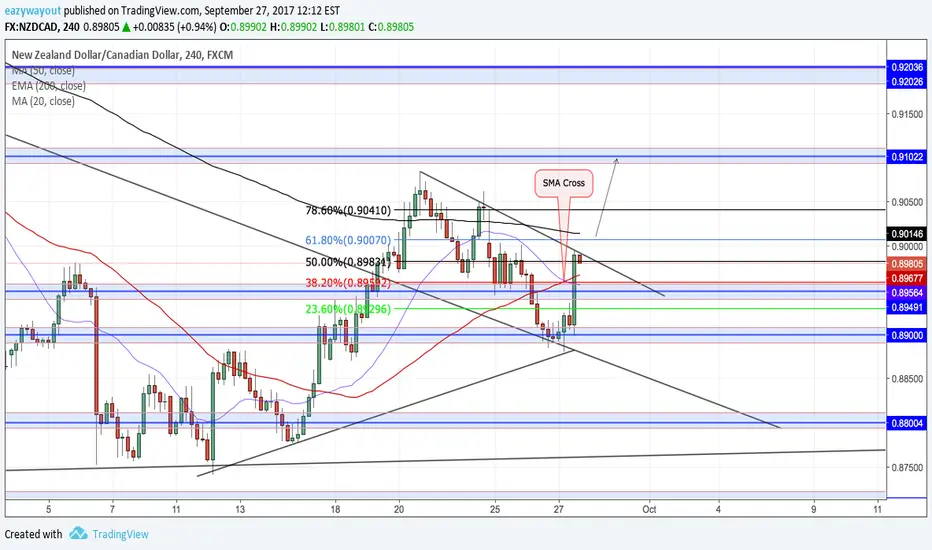
NZDCAD 4HStrong bullish move to the upside, after CAD Governor Poloz spoke, Brought weakness to the cad dollar. NZD came out strong during the New York session & also broke out of its daily downtrend. A slight pullback expected I am looking to get a break of the counter trend line to go long. NZD has news this afternoon we could get some nice movement then..
Trade with care!
XAUUSD - Trend ReversalIn these troubled times when it comes to news involving USA and North Corea, many will move their investments to Gold.
XAUUSD is currently presenting a trend reversal sign.
Double bottom formed on the 4h timeframe.
2618 trade opportunity.
Entry at market.
Stop at 1287.04
1st Target at 1311
Possibility for multiple targets on this trade aiming for the resistance level at 1360.

Banking on Bancor: The Trend ReversalAdmittedly, when I previously published a Bancor chart on Sept 1, I got a little ahead of things. I have since been watching it since and it appears the previous capitulation spikes to 50,000 sats may have found the bottom. It has yet to break and appears the downtrend it has been in for the last couple months may have just broken. I am going to go out on a limb here and say we will probably ride out sideways for a bit in the 65,000 to 55,000 range before retesting 75,000 and hopefully push much higher. It is important to keep in mind the amount of money that was invested into this ICO project ($153M). The smart money has held onto their tokens and it wouldnt be surprising if they have been buying the whole way down with the intentions of pumping at the first sign of positive news. Let me know what you think in the comments below. Obv. not investment advice but it will be interesting to see how this plays out. Cheers and good luck trading!

IOTA seems bullish :)IOTA is an excellent coin to hold long term!!! Has big multiplying value potential with its amazing technology. It's fairly new and hasn't had any major announcements yet, they just had a conference which means at any random point they might drop some news on partnerships, upgrades and projects. Still announcements to be made about being added to exchanges. I personally am going very long term on IOTA because it has strong fundamentals, good dev team with a roadmap & I truly believe in this revolutionary technology. Possible that we will never see these prices again. #HODL.

NZDCAD - Potential 2618 TradeDouble bottom at an important area of support on weekly and monthly charts
Since we did not take advantage on the double bottom, we will be waiting for a pullback into 61.8 Fib retracement before getting involved in this trade.
Entry at .87909
Stop at .87456
1st Target at .88513
2nd Target at .89553

EURGBP - Head and ShouldersPrice has recently been on an uptrend and found some resistance at .93056.
This might be a reversal in trend.
Possible entry @.91899
Stops @.92428
1st Target @.91262

EURGBP 4H Trend reversal? Price bounced off 93.00 support level, and is showing it cannot push above this zone. Seems there is a trend reversal taking place, getting ready to make lower lows & lower highs! Moving averages getting ready to cross showing downside & the Pound gaining strength. Will price head back to its daily trend line? I will be looking to enter short again after the pullback. Will euro be talked down by draghi? We shall see : )
Trade with care.. !

SC Trend Reversal - Supports/ResistancesSC Possible found the bottom and consolidated for some time, now it has reversed with a good spike in volume. If it breakout from the two local resistances I see it going to half way to ATH.

USDCAD long entryIf you look at the chart, you see all the classic signs for a trend reversal. We have a solid bottom, we broke previous highs, the EMA 200 is below the price, and right now, we have a little setback.
My entry is NOW.
We have good chances that the goals will be reached, give it some time though.
Good luck and better trades!

NZDJPY DAILY/WEEKLY TRADE (SELL)The grand bearish wave FX:NZDJPY is forming on DAILY/WEEKLY time frame. Fibo fan is indicating the possible future location of point V . Being a long-term project, it'll take significant time to reach its goals, but if reached, they're definitely worth* it :-)
This idea was largely inspired by beauty and simplicity of Tradewonk's analysis:
Good luck and profitable trading!

EURGBP: Showing signs of reversalIt seems as tho eurgbp has finally stopped climbing. Today impulse move indicate a trend reversal. We can now wait for a retest of resistance and enter short hold.
Trade with care.

Potential Long Position for USD/JPY_Trade Plan 2017.08.07
Legend for price level, trend line, and rectangle:
Orange > Monthly Level
Dark Gray > Weekly Level
Blue > Daily Level
Red > H4 / H1 Level
Green > M15 / M5 Level
Yellow > M1 Level
D1 and H4 are both showing the overall trend is still sideways to down with price hold below MA200.
Currently in H1, price seems to form Double Bottoms pattern with price hold within resistance area 110.685 - 110.923, slightly above MA200.
Trade Plan:
If price breaks up previous high, re-test it, and rejected up, can consider to long the market to follow the potential trend reversal to the upside.
With Stop Loss 30 pips and Target Profit 90 pips, the potential trade offers 3.00 Reward-to-Risk Ratio.

NZD/JPY - Possible Fall SpottedIn this pair we can see a major resistance zone and a minor one and a pullback with a XABCD previous Harmonic Pattern .This would be a good short sell trade if anyone is interested.Just an analysis.
NOTE :- I am not a pro trader,still a learner.Feel free to show my mistakes and help me to learn.
Thanks.

A possible breakout trend trade?Could this pair actually break down lower?
There could be a potential 2x trade here.

Potential short due to weak earningsrewards is 2x and big fall after the earning announcement.
however reward assumption is that previous low can be met.

ETH - The Sun May ShineETH has broken the major downward channel that it has been stuck in for weeks, it is currently sitting at the last major trendline that indicates complete reversal.
Breaking this resistance would mean the bearish market has come to an end.
However this line will hold a lot of resistance, meaning that a downward continuation is still possible.
Like stated in the previous chart, ETH would need some great news, and massive increase in volume.
Well we have the volume, and possibly with the upcoming activation of segwit it has led buyers to push this market up.
What to do:
Watch this line closely. A move above it would likely mean the bearish trend has ended.
If it fails to break this line, it could lead to a great short opportunity.
Good luck to everyone!!
note: the trend line was placed with 1 day candlesticks, the chart is currently in 4 hr.

Clean support and resistance tradeSupport and resistance plotted on a higher time frame
Pinbar showing rejection of price and top reversal
2:1 risk reward
Money in the bank

VSTM Wave completion + other concurrent price action
I'm long 500 units VSTM given the completion of the wave cycle + concurrent daily close above .38 fibo AND minor support from the initial trend reversal line established back in March.
Be careful though, fundamentals are fairly weak with this small cap company failing to produce a profit. Stop loss set tight at around 1.8. 5 year target at $15+. Short term, I expect to see $5/share, hopefully by the end of the year. Assets alone value over $2/share, so for me, it's a moderate risk.
My first day here at TradingView, cut me some slack :-D Any input would be greatly appreciated.

BTCUSDT/ Trend reversal? End of bull TrendTrend reversal?
End of bull Trend
POLONIEX:BTCUSDT BITSTAMP:BTCUSD KORBIT:BTCKRW

new REVERSAL indicatorWorking on a new REVERSAL indicator …
Almost every signal of the "MM-Reversal-King" was right.
11 out of 12 is not that bad.
