Trends

Citi Bank Bullish Breakout?Can we see a breakout in NYSE:C ?
I currently say this because ever since the 14th of January of 2019 it has been consolidating between the resistance line at the $65.23 and the support at $60.81.
For myself the RSI and MACD are the most important indicator to me. As you can see the MACD has crossed just before the 3rd run to the resistance and the RSI is yet to be oversold.
Posting this today the price has came close to the resistance line just by $0.6. I believe that if we see the price break through the resistance than it will breakout and we can see the target price to be around the $69.00 range.
ALSO, there was a big right triangle forming and as of today it has also broken through the right triangle resistance line. So this should be interesting to look at if it can break through 2 resistance lines.

Trend is changing!? BTC going down!?Hi Guys!
As we see on this 1 D chart on Coinbase, we have some changes in the trend. I guess the uptrend is now exhausted and want to come down lower. Could be a healthy correction to the Fib level of 0.786 or complete melt down?
If BTC breaks the upward sloping trend line which is established for several months, then I see levels at least at the yearly lows of 2018 near 3,1 k. Could form a real double bottom and start the sideways trend for the next 5-6 months. Accumulation phase.
I see both scenarios playing out at the very moment, but first, we need the confirmation of the breakdown. I need to see 3750 levels break first.
Let's see...
Happy and safe trading!
*This is not financial advice, this is only an idea. Do your own research and act on your responsibility.

EURUSD Gann Year Cycle Complete, Moon PhasesThe EURUSD has moved to the very end of Gann’s final inner year cycle, the year cycle (360-365 days). This extends from the 2018 swing high on Feb 16th, 2018 to February 18th, 2019. Just below at 1.1224 is the 3/8th Major Harmonic, which represents the lower trading range between 3/8th Major Harmonic and the 5/8th Major Harmonic at 1.3186.
But those price levels are mostly moot. What is important is the metric crap ton of cycles that have culminated here. First, the Gann Cycles.
1. 360 day cycle: complete, indicating a strong trend reversal is imminent.
2. 90-day cycle: From the 2018 low on November 26th, 2018 to the 2019 swing low on February 15th, 2019 – we get the completion of a 90-day Gann cycle.
3. 144-day cycle: From the most recent swing high on September 24th, 2018 to February 15th, 2019 we see a 144-day inner year cycle complete.
4. Close to the end of the current Law of Vibration cycle which ends on March 1st, 2019.
Next, we see the astronomical cycles.
1. Mars enters Taurus February 14th
2. Sun enters Pisces February 18th
3. Sun sextile Uranus February 16th
4. Full Moon on February 19th.
5. Moon Perigee on February 19th.
The Full Moon that shows up on the 19th is the main triggering event here. When a series of Gann cycles and astronomical cycles culminate into one zone, we generally wait for one final triggering catalyst – that is the Moon Phase. We should expect to see a very violent move from this level next week.

ETH Bullish?I'm putting all bets on BINANCE:ETHBTC for at least a double in your return. A look at BINANCE:ETHBTC shows us that ETH bounced at known support created a uptrend then retraced shortly with a double bottom and now is in a Wave pattern. I believe we are about to wave up and it will generate some nice returns. ETH is always a safe bet regardless because we already know were its bottom and BTC's bottom is called it in june of last year lol. Anyways mostly everything is pointing bullish on ETH and I am personal going to take the shot.
-Thanks for tuning in, a follow would be great! Or maybe a like ;)
--Heres my twitter but Im in and out of it twitter.com
---Good Luck on your trades!

Loony Head and shoulders patternThe pattern shows a head and shoulders that looks like it's failing based on rising gold prices and the huge rejection wick. Will see how the price action unfolds

4 Days left for Steem to make a new movementSteem started a descending trend channel from Jan 24th and it finished on Feb 1st, after it started moving within a wedge that has been tested and rejected for both support and resistance. The key level and timeframe is 4 days for it to move above or below the 8100 satoshis level, any break moving above the resistance will head towards the 880 weekly low level tat was created on Dec 22nd and it will probably keep moving within the weekly low level and the monthly of 9365 satoshis level. A move below the support level it will test the 6582 satoshis monthly level, for it to create a new movement. I'm hoping the move will close towards the recovery soon and probably make a 10% increase in a few weeks from now.

GBPUSD SHORT IDEA +250 PIPSPrice was travelling in a large descending channel marked out by the large BLUE lines. After the slight recovery from Theresa May's destruction of the pound, price found itself in an ascending channel which managed to actually break the BLUE DESCENDING CHANNEL to the upside. You still with me?
HOWEVER, price has now found its way back into the descending channel, indicating a FALSE BREAKOUT. Price has been performing well inside the zones marked out on the chart, We expect price to make its way back up to the top of the channel again which is also it's next resistance area marked out, and then we expect it to make its way back down into the centre of the channel.
TARGETS MARKED OUT ON CHART!

S&P 500 entering an ORDER BLOCK | TAPE READINGThe price is edging up. If you look closely, you will see an Elliot 5 Wave impulse. If you know about fractals, you should have that in your trading arsenal because the Elliot Wave principle is a natural, sensational and accurate tool in 'forecasting' price action.
The waves move in harmony according to the Fibonacci patterns and spirals. The Fibonacci is the actual backbone of the Elliot wave principle (although i haven't included it in this price level - even though I have, by virtue of Elliot). The US economy is projected to be moving down. With the recent trade wars, French (fuel) tax riots, weakening global demand, drop in oil, and massive debt, the US should start a process of deleveraging soon.
The SPX is reflective of the global economy. The markets have been rising this year, the biggest performers in the upcoming quarters should be emerging economies by virtue of the law of diminishing returns. The global landscape is changing right before our eyes as China takes the stage as the the leading super power. Overall, Trump's Trade War was a misdirected battle that's turning out to be a blessing for all emerging economies because it's happening on the backdrop of President Xi's aggressive, futuristic and rather ambitious One Belt One Road Initiative.
The global landscape is going to be shaped by the actions of changing global movement and emerging drivers in the global macro economy.

GOLD - Breakout. Gold in a descending wedge. If it breaks above we'll see limited upside of 1360. Downside potential of 1250.

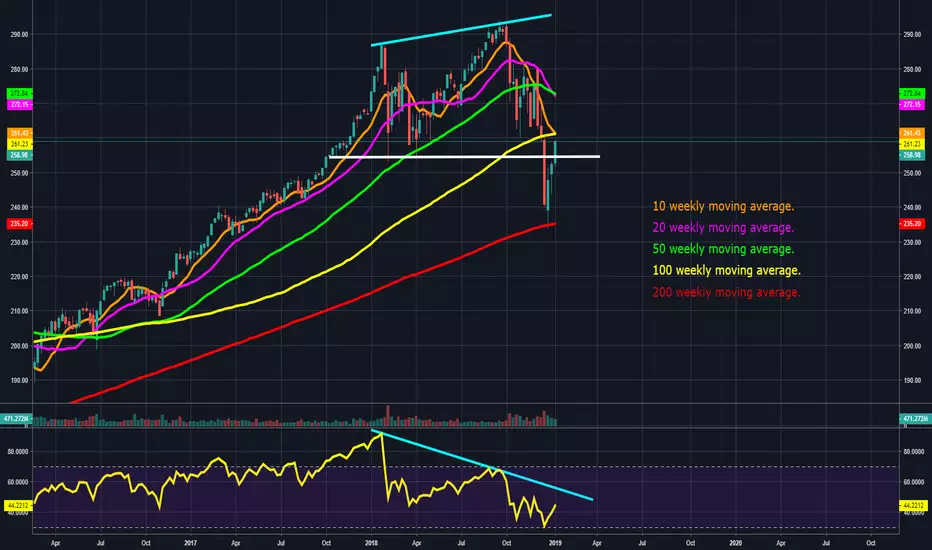
Critical few weeks coming up for the SPY. As predicted in my previous analysis awhile back; we did bounce off of the 200 weekly moving average and we have seen a respectable rally to the upside. However, we are now coming up to test the lower time-frame moving averages (10 and 100 weekly moving averages,) and if price fails to break back above and hold them as support again, I suspect my original dead-cat bounce off of the 200 weekly moving average theory will come into fruition. I still remain bearish overall on the stock market at this time. If we get rejected at the 10/100 weekly moving averages, we would need to see the 200 weekly moving average hold again as support. If it does not, and we fall below it and see it act as new resistance, we could be entering into a bear market. If we climb back above the 10/100 (and eventually the 20/50) weekly moving averages and hold them again as support, I will change my bearish stance.
-This is not financial advice. Always do your own research and own due-diligence before investing and trading, as for investing and trading comes with high amounts of risk.
Previous posts on the SPY:
12/26/2018:
12/19/2018:
USDCHF ShortPlease see chart for potential targets. Fibbonachi retracement levels and area of interest for a Short position. I would like to see this Pair break out of the recent consolidation zone to the upside before targeting liquidity below that zone.

Apple ShortApple broke the 157.23 resistance line, but then retested and fell below. This coupled with the high volatility predicted by the BB is a sign that the rising channel will breakout and fall lower so a short position should be taken. This was seen earlier in Apple when the descending channel broke out and increased the price. If however it does breach the 157.23 line, retests and continues higher. A long position should be taken.


Bitcoin Trendline Correlation 2011, 2014, 2018 Interesting perspective of important historical trendlines

Is LTC about to die?!Things aint looking very good for LTC.
Currently cant even touch the bottom of the downward channel we are in without crossing into a negative price range.
Probably best to stay away from this Crypto currency until we have the a real confirmation of uptrend, if any that is.

After a nice short, here's Traders Guide To The Bitcoin Long.Had a beautiful short we played here:
But now we're looking to the future. Let's long at this 4hr level. Maybe we win. Maybe we rekt. Maybe your face.


Potential Long Position For The SNPThis is just a short-term long position for the SNP, if you are a swing trader then there is a possibility we may bounce in January and continue back down on February.
I am basing this on the fib extension of 1.618 and the .236 Support level. Things could go alot lower as bearish momentum almost always moves faster than bullish momentum when it comes to the SNP 500.
Also I am not as expierenced trading the SNP as i am in other markets so take my charts as just guides as another traders viewpoint so you can further make your own desicions

The importance of the trend: SAR indicatorHello all,
I could talk about price or something, but I'm not in the mood for that today. Instead, I'd like to share with you all how I use the stop and reverse points (SAR) to identify trends and give me an edge in trading.
Of course, we have all heard the phrase, "the trend is your friend." Well, it's true. Of course, trends break and at some point following them can lose you money, but in terms of the big picture, following trends is pretty wise: you will be right more than you are wrong if you manage your downside appropriately.
There are a few metrics to identify a trend objectively, and one of them is the SAR indicator I am using. If you had solely been trading off of this indicator, you would be doing well for yourself. Of course, this doesn't always happen in every market this well and it's not perfect like anything else, but it is a very good trend indicator.
When the dots are above the price, that means you are in a downtrend and of course, if the dots are below the price, then you are in an uptrend. This is extremely useful and tells you the following: if you are betting against the overall direction of the SAR, you are probably wrong.
The SAR is therefore a great tool to be using to see if you have a correct outlook in terms of the big picture.
In terms of what it says in this chart, it is saying bitcoin is bearish... well no shit, but look at when it first started saying it was bearish: price was much higher. If you subscribed to the narrative that bitcoin was forming a smooth bottom and was about to moon, this would have been a great head's up. This is a big reason I was able to see this large crash coming and avoid accumulating bitcoin spot at $6,000. Of course, I looked at other factors, SAR just is one of them.
As you can see, I was leaning bearish and I saved my ass a ton of money as a result because the price then plummeted 50%. Risk management is a thing, but if you are like me and are looking to accumulate bitcoin at certain levels, then maybe 6k would have been one of them. As a result, you would have been dead wrong.
I am not a genie, I do not make money by being able to see the future, I am successful by doing the following well:
1. Not lose money (you can't bet the house on a trade)
2. Get into trades that give you a good probability of winning
SAR is a tool to help you do the second.
Hope this helps,
-YoungShkreli

ADAUSD - 1D Chart AnalysisAfter it has dropped in November from 0.0706$ to 0.0388$ and it has registered a decrease of 45.04% (or 0.0318$), the price of Cardano has started the current month with the right foot.
The RSI had a slight return from the "oversold" area, the Stochastic has registered a crossover on the 1st of December followed by a small increase of teh price, which was also confirmed by the MACD as long as it's Moving Average has "jumped" above the Signal.
The contradiction comes from the lower trading volumes compared to the previous days and also from the Doji candlestick which was created yesterday, with the price finishing the day at the same value of 0.0419$ as it started.
Traditionally, there are some circumstances in which it is considered that a Doji candlestick is showing the market's indecision or a possible change of the price direction. But this doesn't seem to be too relevant for Cardano as we could see the same situation on the 23rd of November and the price just continued the drop.
Overall, it seems that without any news which can stimulate the trading volumes, the price has big chances to start moving sideways and to stay between the Resistance Level of 0.0464$ and the Support Level of 0.0398$ for the following days.

Trend lines. Simple, yet powerful.We just saw this large drop in the last day which has hopefully found a new bottom on the green trend line, but I would not be surprised to see another drop to the yellow trend line in the 4500-5000 range in the near future. My opinion is that there are potential short term gains from this point, but you still have to be cautious.

Canopy Growth's position in the industry.Canopy is one of the most well established Cannabis companies out there. They mainly focus on the distribution of medical cannabis. They have different products in their portfolio, from CBD concentrated pills to CBD oils.
The last couple of days its stocks have been in a bearish trend, but it seems now that they have reached the MA 100 with a bullish candle. If my prediction is correct, its stocks might keep increasing in price.
PD: Keep always in mind that Cannabis stocks are very volatile due to the current fragility of the industry. A lot of variables will still be present, coming regulations, market and consumer experiences. Also, controversy with its legalization will create ups and down because there is still some stigma in different societies; as to research that could suggest that its legalization might not be as positive if not structured accordingly.
