Blowing up accounts can be a good thingIn this screencast I show some of my positions which are mirrored on my live account. I say that blowing up Tradingview paper accounts is a good thing. The present account has not been blown up for about a year, which is much better than before. I used to blow up an paper account every 3 to 6 months before. It's a very safe space to gain experience, to fail repeatedly but learning from the 'punisher' (the markets).
I show a couple key positions and how I thought about them.
I assert that a bit of common sense is useful when you know the characteristics of the instrument you're exploiting. But learning how each instrument tends to 'behave' can only be discovered by spending time and interacting in the markets. So I don't trust Wall Street - at all! I'll tighten my stops more aggressively if I'm in a very favourable position. Same for Yen pairs and Gold. USDJPY is relatively tame compared to other forex pairs just from my experience on 4H time frames.
I'm delighted to point the way for new traders. PM me questions if you wish but I don't give advice, sell signals or courses/services, or give hot tips. I believe in facilitating new traders to discover their own best methods which match their individual psychologies.
Trends

HAIR, too late? We might get another chance!This started to take off mid day today.
I already have two positions but looking for a third on a pullback.
My first entry was near the low of October 15th which was a test of the bull trend line.
Got a second entry near the low of October 16th which also tested the bull trend line and made higher lows from the day before.
Looking for a third entry on or near a retest of the close from October 16th, identified by the box on the chart.
It might not make it there because we've established a pretty good battle ground, as seen by the heavy volume profile near $2.15.
Ideal profit target would be along the first trend line, with a possible reentry if the trend line gets broken. We will see when that time comes.
As always, practice safe risk management!

USD JPY Patterns idea for going long?I went long at the yellow highlighted area where I hoped it would keep the bull trend going. The last two purple highlighted areas seemed like a on going pattern where the third purple area near the yellow, is doing the same thing where I predict it may follow the dark green and dark blue lines, getting as close as it can to 113.000.
If it does not go that way then it may follow the dark red line becoming a bearish trend, maybe a twin buy for a come back.

Strong Resistance can mean strong support Here you can see where each time we hit a new resistance we dropped down to the 6000-6300 range and snapping back up breaching resistance and making a new support . we then retrace back to 6200 area before snapping back past new resistance to make a new support . 6800 has proved to be a challenging area for us last month and even last week we dropped down to our 6000 range before "snapping" back up past 7400 which has been the fall off point since early September. i think this 6800 will act as a new support going forward and 7400 should be our new resistance . lets see if the cycle repeats itself there are alot of bullish indicators and I do believe we have strong support at 6000 area.


SELL I think that this pair will be a long term (2 week) sell. It is consolidating so I will set a sell stop and review my trade once it is complete.

Here is a longterm price analysis of BTC. Lots of data in here..BITSTAMP:BTCUSD
I put together this long term BTC chart to analyze the price action and seasonality. There are definitely some interesting data points. Check it out and let me know what you think in the comments!
Here are some highlights...
Q4 Performance %
(daily closes)
'11 - 1
'12 - 8
'13 - 509
'14 - (60)
'15 - 86
'16 - 60
'17 - 240
'18 - ???
October Surprises!
(ranges in %)
'11 - (65)
'12 - (27)
'13 - 143
'14 - (35)
'15 - 43
'16 - 19
'17 - 56
'18 - ???
Happy trading!!


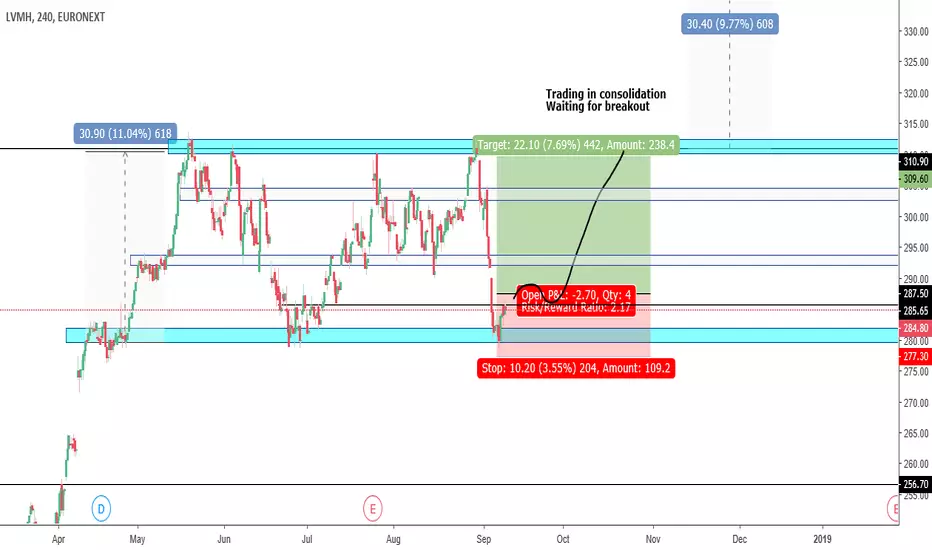
LVMH MC LongTraded within the light blue consolidation.
Reached the support that has proven its self on several occasions
Bull leg coming
MONERO XMR 150$ PRICE TO WATCH? lets find out..BULL or BEAR?Monero (XMR-USD) : has been a long journey down the channel, since that peak on March, nothing has been green here..The anonymous coin that launched a new way to pay the black markets, has turned RED!
Troubles over and ready to jump up to bullish territory? let's talk about it..
Why are we so interested on XMR? it has a reputation, many transaction are actually real payment between people and thats a huge must, is not just speculations, it is the real purpose of a coin,
the coin is at the moment present on 93 Crypto exchanges (coinmarketcap.com) and that's quite interesting as well as makes it a very popular coin (ranked 10th)
The technical analysis on the other side is not that great:
Huge resistance at 150$ makes it almost impossible to jump out without expecting some battles at those levels, but the increase on Volume on 1st sept could be a possible Descending Triangle ends, that could allow Bulls to push till 150$, but then indicators as RSI shown already not too much steam (almost oversold) that's why we expect the resistance to act accordingly.
After this touch there could be interesting opportunity on the recovery of this coin. Might take time, and we recommend to watch out possible support levels at 84$ level , if support work solid and Volume increase, could be a nice opportunity to jump on the Bull side and broke the 150$ resistance, otherwise if not supported by volume a possible crash to lower level is possible.
Hope this will inspire some new ideas, don't forget to hit the like/follow button if you feel like this post was helpful, that's the best way to support us and our work.
Happy trading days
C-Monkeys

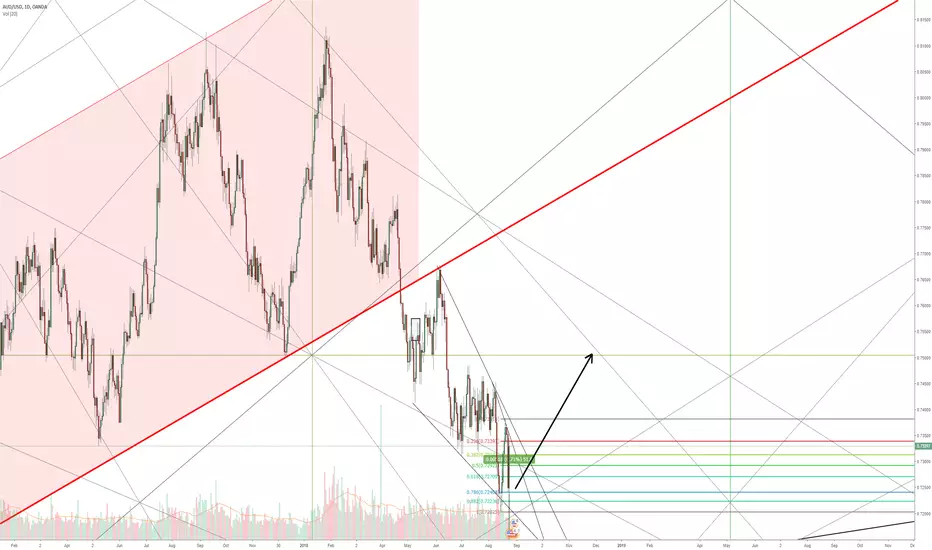
AUDUSD back to 0.75 - Gann and Financial Astrology189-day Gann cycle, strong trend reversal. Tweezer bottom on daily. I'm not a big fundamental/news based guy (I don't believe it matters) - but the new Prime Minister, Scott Morrison, is apparently better for the markets than Mr. Turnbull was. Regardless of the reasons, the trend change was already identified a while ago and price is catching up with time. In this case, there will be violent rise higher from this zone.
Not surprising that there are significant bullish Financial Astrological conditions here (I also posted these as an update to my Bitcoin Mirrored Foldback idea - )
August 7th - Sun Square Jupiter
Red Vertical - August 23rd - Admetos Square Sun
Blue Vertical - August 24th - Uranus AND Saturn Trine Sun
Mars exits its retrograde cycle.
There is a metric ton of things that all happen between August 23rd and August 26th. Because we are these swing lows, it’s important to notice the confluence of these cycles.
The orange box represents the Mars Retrograde cycle it ends that cycle on 26th.
There is a Full Moon on the 26th, Moon Apogee on the 23rd and the Sun enters Virgo on the 22nd.
Two trine aspects of the Sun: Uranus Trine Sun, Saturn Trine Sun
The downtrend of USDJPYAs we have seen in the last 12 months Usdjpy has been going in a uptrend ,it has broke the trend thus moving into a downtrend .we wait for the breakout to happen and our first Takeprofit will be by the red support line

Knife Catching is a Sport We seem to have held just above the downtrend line anchored to 20k and 9.9k, we are also currently in a high volume area which tends to see a good amount of consolidation
the first green box will be the target for a pull back while the upper box is the target for a potential reversal
Shoutout to @g_squared_iv who is a fallen knife catcher, this is how we honor him!
~Gemini

UP up up and away bitcoin!Look at the chart! higher high, indicators, AND ETC on ROBINHOOD! Markets all in Green. LETS GO.

SAIL away to gainsI swear this one and RTRX are twins or something. Hit 28 and you will be a dime. Choose your pre-workout (pick your poison) for some bullish gains! PS...ER is coming soon so watch out for that.

Fibonacci Timing says us the buying time.
------------ It is all of about Big Picture ------------
I think easy to long-term analysis than short-term analysis

Look like pumpy pumpers at it again. Potential payout for bulls.This crazy breakout lead into a head and shoulders, then faked me out and i realized it was an inverse head and shoulders! The MFI, CCI, MF, TTM SQUEEZE, and STOCASTIC RSI all came together to potentially make this push happen! I am trying to publish fast as I think its coming soon
: )
This is not financial advice. I would highly advise taking any of my trades ; )

ADABTC ScenariosWe've got a few different scenarios that can play out in my mind, you can see them outlined in different colors. I think we go up from here and follow the green because there was a very strong bullish engulfing candle on the 5 minute chart which prompted me to make this update.

GNT upward sloping BULLISH 3 drives patternLooks like a bullish 3 drives pattern. It does have an upward
slant but the 1,2,3 sides are on the bottom and the sharpeare
to the left. If this is the pattern we have a target at 23k sats
which is the all time high for GNT on 4/11/18. I am hoping
this is the case cause this downward movement has been
significant.

BITCONE GO WHERE [ENTRY PLANS]Previous short idea invalidated, time to move on. Good volume from 6.6 (rip new 6800 shorts and stops) and potential bullish catalysts (likely ETF approval) and explosive volatility after yearly lows are good news and should allow at least a small relief rally into the 8000s. R/R of btc at this current price ~7.5k for longs is absurd; If you closely examine the orderbook behaviors from 7.3 to 7.5 in the past few hours it appears ask side liquidity is often pulled and price is quickly being bought up on thin books.
Given the lack of a retrace on this huge upmove after breaching 6.8 i'm expecting a retrace to at least 7.2; Planning to scale into longs at 7.2~7k with large scalp shorts at this level if we don't consolidate at the very least. Profit has been taken on longs and I'll let them ride with take profits/stops at 7k flat. Only concern for current shorts is we continue upwards like in april

Bitcoin Sellers Losing SteamAs you can see in the chart, the selling has continued to slow since the initial sell off @19.8k
This doesn't mean that Bitcoin cannot go lower, however the trend is indicating that a reversal may be near.

BITCOIN THEORY FRACTALI have a bitcoin theory I made back at the end of May that correctly predicted the mid term bottom for June with-in 24 hours.
If the theory continues, we would see one last push to 7000 area before retracement to 6150 which would carry us into a nice bounce for the coming months.
