BUY: BTC/USD## OUR APPROACH:
- 100% Systematic Trend Following Trading
- Trading Long and Short Signals with a medium-term time frame to capture +50% price moves
- Always protect your position with a stop loss (initial stop loss turns into trailing stop loss)
## TRADING LONG SIGNALS:
- Go long as the price closes above the "orange" solid Channel Line
- The "purple" dotted line always shows your current stop loss (it is trailing)
- Ride the trend as the price moves up
- Exit the position only if the price closes below the trailing stop loss
##TRADING SHORT SIGNALS:
- Go short as the price closes below the "orange" solid Channel Line
- The "purple" dotted line always shows your current stop loss (it is trailing)
- Ride the trend as the price moves down
- Exit the position only if the price closes above the trailing stop loss
##WANT TO APPLY THIS SYSTEM TO YOUR TRADING?
- Reach out to us via the message function on Tradingview to get access to this Pine Script on Tradingview
## OUR TRADING SETUP (Hit the links below to sign up for the services we love!)
- Data and Charts by Tradingview:
tradingview.go2cloud.org
- Trading on Binance:
www.binance.com
- Trading on Bitfinex:
www.bitfinex.com
## OUR FAVORITE BOOKS
- Trend Following Trading – How to make a fortune in Bull, Bear and Black Swan Markets
amzn.to
- Trend Commandments – Trading for Exceptional Returns
amzn.to
- The Rule – How I beat the odds in the markets and in life – And how you can too
amzn.to
- Market Wizards – Interviews with Top Traders
amzn.to
Trendtrader

ONTBTC: Double Bottom Pattern.ONTBTC: Double Bottom Pattern.
Note: This is only for Educational purposes; this is not investment advice.

GOLD IS BAE - I LOVE BAE Gold gold gold, you are so perfect - IF ONLY we pay attention!
STALKING XAU/USD has given me an edge, to actually watch these patterns and setups form and COMPLETE (thats important, chart time- chart time- chart time)
who would've thought that drawing ONLY obvious lines on a chart would make a picture so much clearer?!... where was this brilliance 4 years ago lol -_-
My process:
-- drew my OBVIOUS zones in green - (obvious zones as in an area that price made THE MOST drastic turn in the opposite direction on the higher timeframe)
-- drew my obvious retracement areas in fuchsia - (obvious retracements as in , an area price revisits THE MOST on the higher timeframe)
-- drew my favorite chart patters (ascending triangle, descending channel, bull flag - on the higher timeframe)
-- drew my trendlines (on the higher timeframe)
Based off me doing these steps I was able to see that:
-- PRICE HAS BROKEN OUT OF MONTHLY SYMMETRICAL TRIANGLE (this gave us the trend direction...CONTINUATION UP)
-- PRICE IS FORMING AN ASCENDING TRIANGLE ON THE 2HOUR TIMEFRAME AND PRICE SHOULD BREAK OUT ONE OF THESE DAYS (even though I took the trade from the trend line bounce ; P)
-- PRICE IS MAKING HIGHER HIGHS / HIGHER LOWS (this confirms the uptrend)
-- PRICE PULLED BACK TOWARDS THE 20 /50 EMA (I don't trade when price is far away from the EMA/s)
-
-
Price ended up breaking out of the ascending triangle, but I'm waiting for the 4hour candle to CLOSE
-- IF price closes above my RED ZONE I will buy on the pull back towards the zone + 20/50 EMA on the 15 min chart!
*
*
-- IF price closes below the RED ZONE I WONT TRADE it until price shows me that its ready to be BOUGHT again! ( I LIKE TO BUY ONLY)
My trade plan for market open. My over all forecast is to see XAU/USD head to the next super key level at 1780.00 - WE SHALL SEE : )
Thanks for reading
** I am no teacher, just someone that fell involve with the markets the moment I saw my first chart. I've been dedicated to find a simpler way. I am here to share my thought process, winning trades and losers. I hope you have a great trading week!**
-Lee
THE TREND IS YOUR MF FRIEND"

Palladium Halts After Previous Big MoveThere is no surprise that Palladium has currently found weakness after hitting a round number following
a strong surge in price. With every big move, we can expect to see exhaustion in the market before
a continuation in the trend.
Price first made contact with the $2,500 round number on January 17th and has since pulled back.
The recent pattern of breakouts and trends may be over if price declines further but for now the uptrend
is still intact.
When price pulls back, we always want to look for areas of support/resistance that price may move towards.
In this case, the next obvious area of support below price is the 20sma. It was last used as support back
in December 2019 and may do the same again.
After this level, the next area of support is the previous resistance turned support which is right at the
$2,000 psychological round number but this is some distance away from where price is now.
Palladium is still priced higher than Gold and currently holding the title for the priciest precious metal
for the time being. If we do see a break and close above the current all-time high at $2,543 then we
should see further bullish moves in Palladium.
See below for more information on our trading techniques.
As always, keep it simple, keep it Sublime.

JD Sports Very Much Bullish!JD Sports has a good history of trending well as we saw from the trend between
December 2018 to May 2019.
Price became exhausted and went into consolidation from May 2019 to September 2019
and the breakout in September was the first indication of further trends to come, which
is what we are currently experiencing.
This has not been the neatest of trends but price has consistently been heading to the upside
forming higher highs and higher lows.
Price may become exhausted again and form a period of consolidation and in that case,
we would just need to wait for a breakout to confirm a continuation of the bull trend.
A break above £8.90 should see further moves to the upside and give us the opportunity
to add to our already profitable positions.
See below for more information on our trading techniques.
As always, keep it simple, keep it Sublime.

S&P 500 In A Linear Trend!The S&P 500 is going from strength to strength, continuing to create new all-time highs
since the beginning of 2020.
After breaking out of consolidation on the 28th October 2019, price has formed a
nice linear bullish trend. This Index has a good history of forming strong linear trends as we
have seen in the recent past from December 2018 to May 2019.
Some traders may begin to fear a market reversal based on fear but as technical traders,
we do not preempt market reversals. We need to see indications based on our analysis that
suggests a reversal is highly likely.
You can find more information on how we do that in the links at the bottom but to summarise,
what we first need to see are areas of support being broken. The first being the support at $3,027
followed by the $3,000 round number.
So, for now, we are in a bull trend and we may experience a pullback soon which is normal.
Price has the 20 simple moving average just below which is the first support area price may use as support.
This trend may go on for a number of months so it is worth looking at strong trending stocks for long opportunities.
See below for more information on our trading techniques.
As always, keep it simple, keep it Sublime.

Is $2,500 The Limit For Palladium?Palladium has gone on to shatter records performing a steep climb over the past couple of weeks
but will the rise be over as fast as it started?
The chart clearly shows the clean breakouts following clean pullbacks in Palladium over the last year
and each breakout has resulted in a nice trend. The most recent breakout has been the strongest
yet in its recent history.
When price was approaching $2,000 again in January 2020, many said that price would fail at that level
as it had failed there previously in December 2019. Price will always do what it is going to do,
which is why speculation should be ignored at all costs.
Palladium went on to soar above $2,000 and then we saw increased momentum which pushed price up
another 25% to where it now stands around the $2,500 level.
Is this the limit for Palladium?
That is anyone’s guess. But what may be more likely to happen next is for price to pull back as price appears
to have momentarily run out of steam. If this is the peak then we may see a sharp decline,
but if this is just a pullback then we want to see a break and close of the current high at $2,543 which will
confirm a continuation of the bull trend.
See below for more information on our trading techniques.
As always, keep it simple, keep it Sublime.

Gold Battling With Resistance & Support!The behaviour of Gold has been consistent over the past couple of years where we have seen trends
followed by consolidation periods. The most recent breakout of consolidation on the 6th January 2020,
saw price sharply rise to a height of $1.611 but that was short-lived.
Price re-entered the consolidation zone and things were not looking good for Gold as its rival commodity,
Palladium, is soaring to new all-time highs.
Despite moving back into consolidation, the buyers did not give up and have again pushed price back up
and above the resistance level at $1,557. If there is a good amount of momentum built up then we should
see price approach the next resistance level at $1,611.
A breakout there will confirm a continuation to the upside and we should continue to see long-term
growth in the price of Gold.
See below for more information on our trading techniques.
As always, keep it simple, keep it Sublime.

Gold Breaks First Major Resistance!Following on from the previous Gold post, you would have seen that we mentioned that price was
approaching major resistance at $1,557 which was from the high of 4th September 2019.
On the 6th January 2020 price eventually broke through this resistance level confirming a
continuation to the upside. Price also broke out of consolidation and what tends to happen after
consolidation is that price usually forms a strong trend. This does depend on how long the consolidation lasted.
Price is currently showing some signs of weakness as the breakout candle has a long wick above it,
indicating that the sellers are trying to push price back down.
What may happen next is that price may use the previous resistance as support before a continuation to the upside.
Price may also decide to re-enter consolidation and in that case we would need to wait for another breakout
before looking for any long opportunities.
As we currently have positions in this instrument, we are waiting for opportunities to compound and increase
the potential profits this commodity may decide to deliver to us.
See below for more information on our trading techniques.
As always, keep it simple, keep it Sublime.

Palladium Worth Over $2,000!On 17th December 2019, price made an attempt at breaking the $2,000 major round number and failed.
From that date through to the end of 2019, it was unclear whether Palladium would exceed $2,000.
We prefer to wait for breakouts and avoid trying to guess what price will do next.
On 6th January 2020, price broke and closed above $2,000 creating new historical highs and signalling
strong momentum in this commodity.
If price does continue to rise then we can expect to see deep pullbacks along the way up as this is the
nature of this commodity but this is nothing to worry about.
Pullbacks are just periods of temporary selling and usually scares off the inexperienced traders.
If you are trading and following the trend, then your stops should be kept a distance away from price
to allow these pullbacks to occur without stopping you out prematurely.
We will be following Palladium and will be looking to add more positions to our profitable trades
that are currently still running.
See below for more information on our trading techniques.
As always, keep it simple, keep it Sublime.

Gold Finding Momentum!At the moment Gold is still in consolidation but taking a closer look we can see that price
is looking strong and finding its footing at a support base.
If we look at the support base formed in April/May 2019, we can identify the trend that followed
which saw a 22% rise in the price of Gold.
After big moves we usually see exhaustion in the market and in the case with Gold, price went into
consolidation and remains that way but that may not be the case for too long.
A support base has been formed in November 2019 and we can now see a potential trend emerging.
This, however, will not be confirmed until we have a break and close above the current major high
at $1,557 from the 4th September 2019.
With nice momentum on Christmas Eve and a potential close above the $1,500 round number,
Gold may be on its way to breaking the recent major high and eventually go on to make new record highs.
See below for more information on our trading techniques.
As always, keep it simple, keep it Sublime.

EURGBP Has Another Fake BreakoutFollowing the UK elections on the 12th December 2019, the British Pound showed some strength
and tried to battle it out with the Euro. Price managed to push itself down through major support
at 0.8297 and things looked positive for the Pound.
It wasn’t too long before the market corrected itself and the Pound and the Euro were balanced again
and now price has returned back into consolidation.
The current consolidation period has lasted 3 years and 2 months so far and it may go on for a number of years.
We can never predict how long consolidation lasts but we can identify when they are over by waiting for
support and resistance levels to be broken.
Right now we want to stand aside until we have a clear breakout and ignore taking trades when there
are fake breakouts like the ones highlighted on the chart.
We show you how to identify fake breakouts in the video link below and we will also be posting updates
on the EURGBP to ensure you are ready in the case a breakout does occur.
See below for more information on our trading techniques.
As always, keep it simple, keep it Sublime.

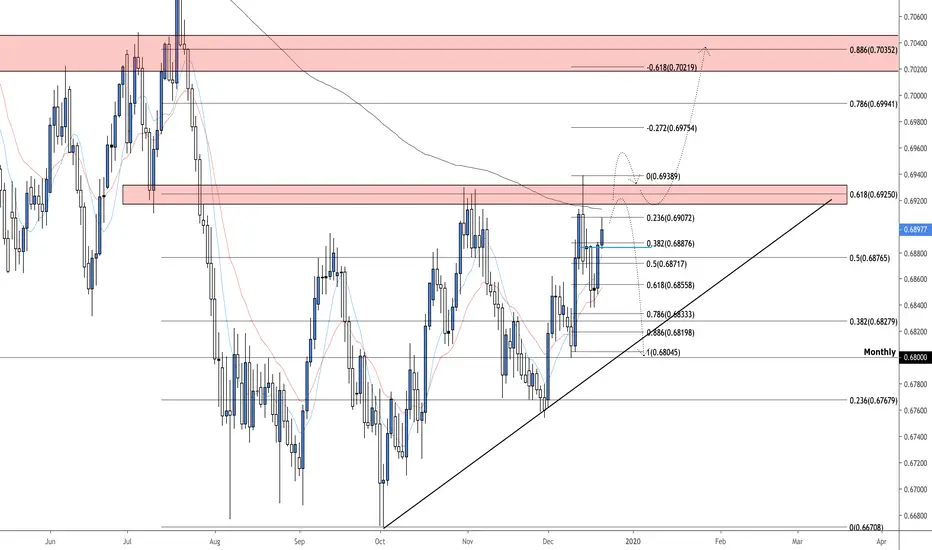
AUDUSD 12/21/19 Daily AnalysisAUDUSD Neutral Idea
On high time frames we can see that AU is very bearish and is currently approaching a key resistance level around 0.69250 which is also a daily 61.8% fib level
I would like to see how price action reacts at this level before making a move. Ideally for a long setup we would like to see resistance broken and retested as support
If we are to continue with short setups strong rejection from this level would be perfect for us to then enter on.
Either way, we are waiting for confirmation
Palladium Slowing Down at $2,000!If price can climb another 60 points and go beyond the $2,000 mark then it would be creating new
record highs for this commodity, which in 2016 was only priced as low as $454.
It has travelled some way since then to where it is now and that journey has not been the smoothest.
After the smooth linear trend from August 2018 to March 2019, price took a turn and went
into consolidation. The sideways movement continued like that for 6 months before the trend resumed.
What traders have to realise is that a period of consolidation does not write off a trade and
quite often just indicates exhaustion in the market before momentum kicks back in and we see a trend continuation.
The last pullback was held and pushed back up by the 50sma, which also pushed price through
the previous resistance at $1,823. We will have to see if that same momentum will push price
through the $2,000 psychological round number and beyond.
We will share updates if and when we see new all-time highs created.
See below for more information on our trading techniques.
As always, keep it simple, keep it Sublime.

The Dow Jones Making A Break For It!The overall structure of the Dow Jones 30 looks positive. The most recent pullback came down
and tagged the support level from the consolidation resistance and bounced off from that level.
After periods of consolidation, it is always good to see price retest support levels as it confirms
the support level is holding and gives more strength to the buyers. Now what we ideally want to see
is for price to continue to trade above the previous high at $28,175.
This will tell us that the buyers have enough momentum to see that price continues to create
higher highs for the next few weeks and months.
This is a good early indication that a strong bull trend may be unfolding and helps to prepare
us to take advantage by entering strong bullish stocks.
The Dow Jones has seen some nice growth over the last year, rising by 29% or 6,500 points.
This may seem like big growth to some but we may be in store for even further growth in the Dow
and overall US market.
See below for more information on our trading techniques.
As always, keep it simple, keep it Sublime.

Gold Could Be Set To Rally!Gold appears to be repeating its behaviour from earlier this year.
From 20th February to 19th June 2019, price was in consolidation and used the base
of the consolidation zone as support and then formed a strong uptrend which rose by 22%.
If we bring our attention to the current consolidation, the pattern looks very similar
to the consolidation period mentioned above and what we know of the market is that
it tends to repeat itself.
This does not guarantee the same thing will happen, but it will give us a strong indication
of what is likely to happen next. With this knowledge, we can position ourselves early on to
take advantage of opportunities to make a profit from the next trend.
Right now we just need to wait for a breakout of the 4th September 2019 high at $1,557.
By that point, price would have moved above the $1,500 round number and the breakout
would have confirmed a continuation to the upside.
See below for more information on our trading techniques.
As always, keep it simple, keep it Sublime.

Apple Set To Create A New All-Time High!Apple continues to perform well, despite being range-bound for 4 months
between May and September 2019.
Prior to the consolidation, we saw a rise of 52% from the beginning of the year.
After such strong rallies, it is not unusual for price to slow down or pull back sharply
as there would be exhaustion amongst the buyers.
A deep pullback or long period of consolidation does not write off a stock, it just
indicates that patience needs to be applied before looking for more trading
opportunities in a particular stock.
There are certain indications that a stock is completely reversing which we cover
in the video links below. But as you can see with Apple, after price broke out of
consolidation and broke above the $200 psychological round number,
the trend resumed and looked strong rising 22%.
We have recently seen a pullback, but price has found strength again and looks set
to make a new all-time high. If a high is made then we will continue to look for
trading opportunities here and profit from the rise in Apple.


AUD/CAD - DON'T DO IT!!... Don't go long!... YET!!4 Previous touches on that trend line, and now some bullish candles appearing. I bet a lot of people are wanting to join in right about now. And if you are tempted would your stop loss not be where I have put the trade prediction?
Well if I can see that, big banks and institutional traders who get paid a lot more than me can see it.
Apples for the taking (I think that is the quote).
Don't feed the banks pockets, feed your own!

NZDUSD Daily Analysis 11/23/19NU Short idea
This pair has been holding a steady bearish trend on high time-frames.
At the current level we have seen multiple rejections from the major resistance zone & daily 38.2% fib level around 0.64400 which means that a strong bearish move could be imminent.
For us to have enough confirmation we always look for bearish setups but in this scenario there are two relative minor support levels we want to see break (in blue).
A break of the first support level will confirm the first broken higher low, ideally after that has been broken a retest followed by strong bearish setups will give us confidence to short to the next support level around 0.63250.
Once this level has been broken that will confirm a break of a higher time-frame lower high in which case this thing is more than likely to dump!
We’re looking to target our weekly support around 0.62750 which is about 125 pips from where price current is!


***Short Opportunity***Looks like will be testing 152 level soon. would be nice if it rallys up to 2day Vwap and fails, so we can short on the way down below 1day vwap.

