PENGUUSDT Daily Chart Analysis | Powerful Uptrend in PlayPENGUUSDT Daily Chart Analysis | Powerful Uptrend in Play
🔍 Let’s dissect the current PENGU/USDT daily chart, highlighting the unmistakable bullish structure and mapping potential targets as this trend matures.
⏳ Daily Overview
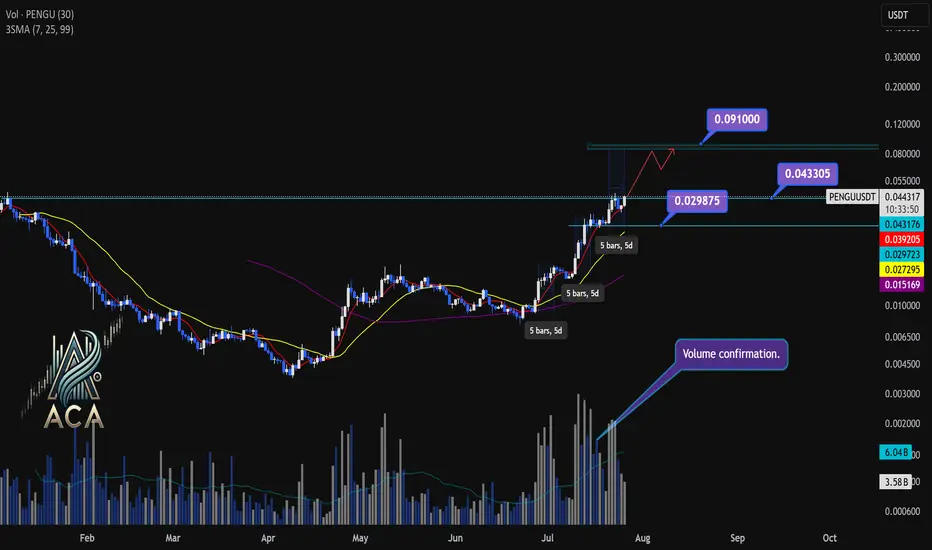
PENGUUSDT is riding a strong upward trend, with all three daily SMAs (7, 25, and 99) lined up in bullish sequence—clear confirmation of momentum. Recent rallies are also supported by textbook volume behavior: volume consistently surges during price climbs and tapers off during minor corrections, reflecting the classic signature of a robust uptrend.
🔺 Bullish Setup and Price Targets:
The next major upside target sits at $0.0910, almost 85% above the current level. For bulls, a daily candle closing above $0.043305 with convincing volume should act as a confirmation for fresh highs—though, as it’s Saturday, even moderate volume could suffice for a valid breakout.
📊 Key Highlights:
- All SMAs (7, 25, 99) confirming the uptrend on daily timeframe.
- Volume spikes on upward moves, fades on corrections—classic bullish confirmation.
- Historical trend velocity: Each time a new high (HH) is set, it’s preceded by around 5 days of advance; first leg was +83%, second +124%, the next (projected) is +160%, aligning with the $0.0910 target.
- Corrections: After each rally, pullbacks have measured about 15% and 20%. Should the first target be reached, expect a correction up to 25%—a healthy reset for further continuation.
🚨 Conclusion:
With all signals aligned—moving averages, volume dynamics, and historic price structure—the path remains bullish. A decisive close above $0.043305, especially with solid volume, could be the catalyst for the next major leg higher. As always, monitor for typical correction ranges post-breakout in line with the prior trend.
Trendtrading
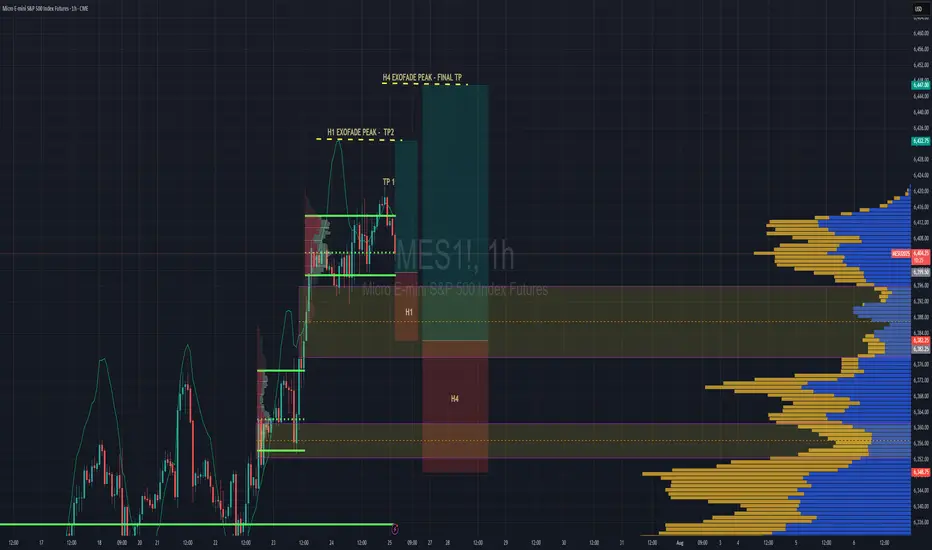
S&P 500 Intraday & Swing Entries H1 entry is close to getting activated for intraday.
If you want a swing trade then wait for H4 entry (you might be waiting a while obviously)
Reason for entries - We have broken out of Balance since July 25th and currently in a trend phase until we establish a new value area, or return to the one we broke out from.
So since Trend and Momentum is UP, then we should find Low Volume Areas to enter in the direction of the trend for a classic pullback entry trade.
SILVER Analysis - Can buyers push toward 4,100$?TRADENATION:XAGUSD is trading within a clear ascending channel, with price action consistently respecting both the upper and lower boundaries. The recent bullish momentum indicates that buyers are in control, suggesting there's chances for potential continuation on the upside.
The price has recently broken above a key resistance zone and now came back for a retest. If this level holds as support, it would reinforce the bullish structure and increase the likelihood of a move toward the 4,100 target, which aligns with the channel’s upper boundary.
As long as the price remains above this support zone, the bullish outlook stays intact. However, a failure to hold above this level could invalidate the bullish scenario and increase the likelihood of a deeper pullback.
Remember, always confirm your setups and use proper risk management.
Disclosure: I am part of Trade Nation's Influencer program and receive a monthly fee for using their TradingView charts in my analysis.

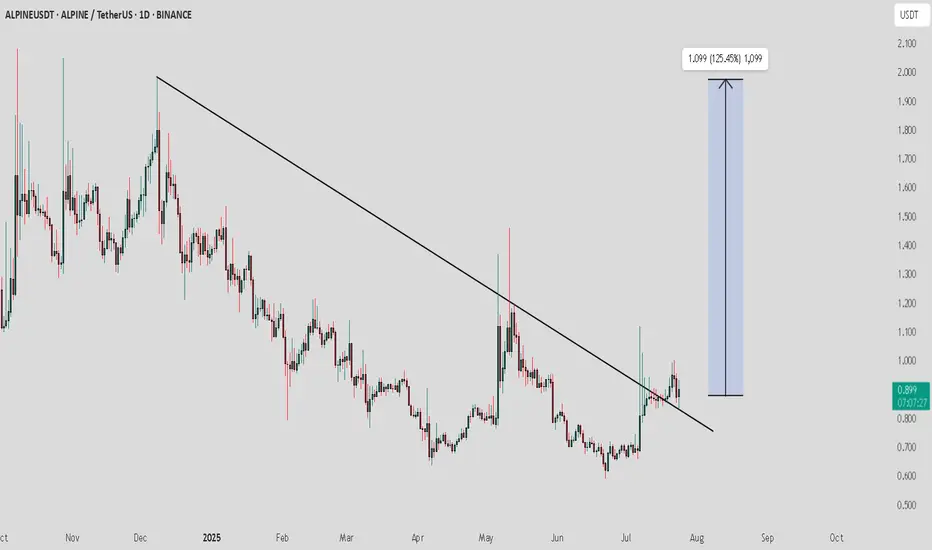
ALPINE / USDT : looking bullish ALPINEUSDT Analysis:
The price is currently retesting the downward trendline. This is a crucial point where the price may either bounce off or fail to hold the trendline, signaling the next major move.
Bullish Scenario:
Trendline Retest and Bounce: If the price holds above the trendline and shows bullish momentum, we could see a rise towards 1.099 (125.45% potential upside).
Confirmation: Look for strong buying volume during the retest to confirm the bounce.
Bearish Scenario:
Trendline Breakdown: If the price fails to hold the trendline and breaks below it, this could trigger a downward move.
Target: Watch for the next support levels to gauge the potential downside.
NAS100 Bigger Picture. Uptrend to be resumedLooking at the current structure through the lens of a trend trading approach, what we saw on NAS100 is more than a simple price bounce, it’s a trend continuation trading within a high-volatility environment. As price is approaching a key resistance level, how price is behaving around this dynamic trendline will be key.
This recent retracement and rejection happening near what we can call a demand zone cluster, was confirmed by a beautiful bounce off the support range. And right now price is respecting the upper and lower bounds nicely.
What happens next? Price is showing signs of bullish exhaustion, but the higher-timeframe structure supports a continuation.
My projected target is towards the upper resistance line, that’s my 23,100 zone as shown.

EUR/USD – Buy Setup Analysis (1H Chart)EUR/USD – Buy Setup Analysis (1H Chart)
📈 **Trend**: Uptrend
The pair is respecting the ascending trendline and is trading above both the EMA 7 and EMA 21, indicating bullish momentum.
**🔹 Long Setup**
* **Entry:** Around 1.1774 (current price)
* **Stop-Loss (SL):** 1.1731 (below trendline & EMAs)
* **Take-Profit (TP):** 1.1872 (based on recent swing high)
**🔎 Technical Signals**
* Price is forming higher highs and higher lows.
* Strong volume surge on bullish candles.
* EMA crossover (7 > 21) supports continuation.
**Conclusion**
As long as EUR/USD holds above the trendline and the EMAs, the bullish setup remains valid. A break below 1.1730 would invalidate this outlook.

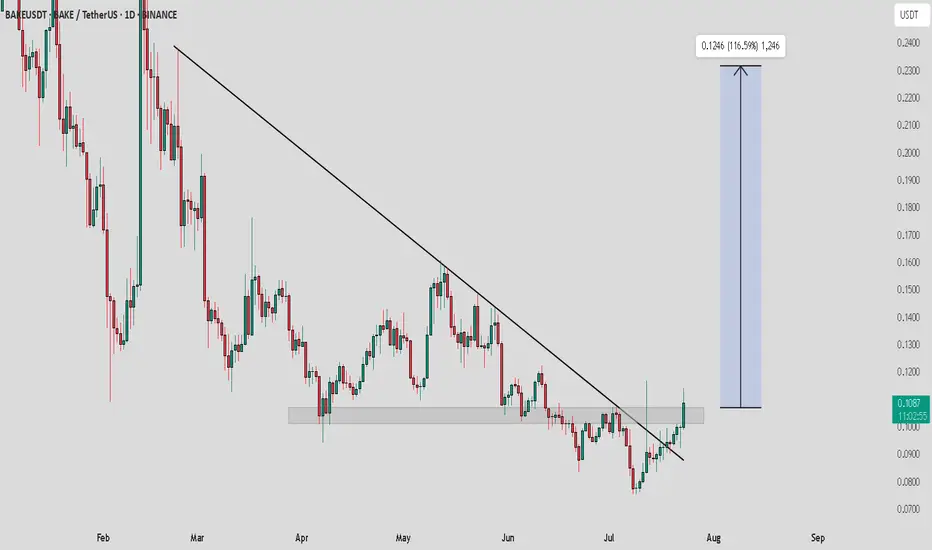
BAKE / USDT : Breakout PotentialBAKE/USDT - Breakout Potential
BAKE/USDT has recently broken above a key resistance zone and is attempting a trend reversal. With the trendline resistance already broken, we are expecting a bullish move towards the $0.124 target, which represents a potential gain of 116.5% from the current price.
Bullish Scenario:
Breakout above the resistance zone confirms the trend reversal, targeting $0.124 with a +116.5% upside.
Pro Tip:
Look for strong volume confirmation during the breakout. Set stop losses just below the breakout level for risk management.
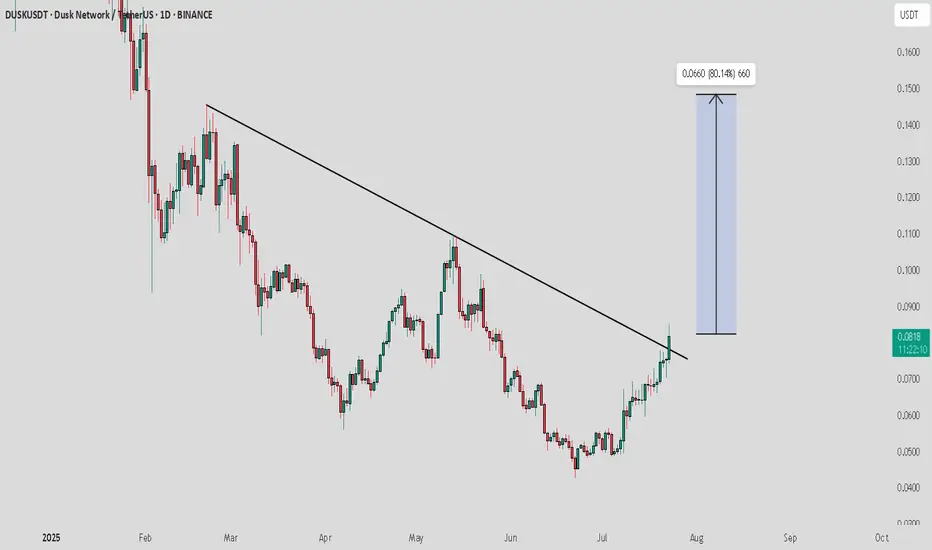
DUSK / USDT : Trend reversal in progressDUSK/USDT - Trend Reversal in Progress
DUSK/USDT has recently broken above a significant downtrend resistance line, signaling a potential trend reversal. With a successful breakout, we’re expecting a strong move towards the $0.0660 target, representing an 80% potential upside from the current price.
Bullish Scenario:
Break above the downtrend resistance confirmed, setting the stage for a significant move toward $0.0660.
A sustained uptrend could lead to further gains in the medium term.
Pro Tip:
Watch for confirmation with increased volume during the breakout. Manage risk by setting stop losses below the breakout level.
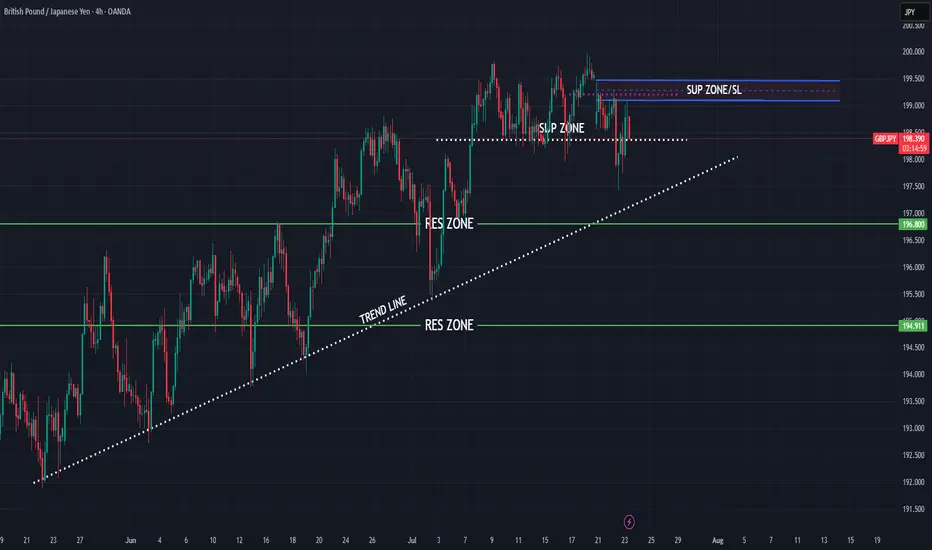
GBPJPY bearish expectations
OANDA:GBPJPY long time bullish trend we are have, currently price in zone, changes on this point expecting
SUP zone: 199.100
RES zone: 196.800, 194.900
GBPCAD new bearish expecting
OANDA:GBPCAD last analysis we are be accurate (attached), currently continuation type, RAISING WEDGE pattern visible, we are have strong bearish push, and still expectations are bearish.
SUP zone: 1.85000
RES zone: 1.83000, 1.82200

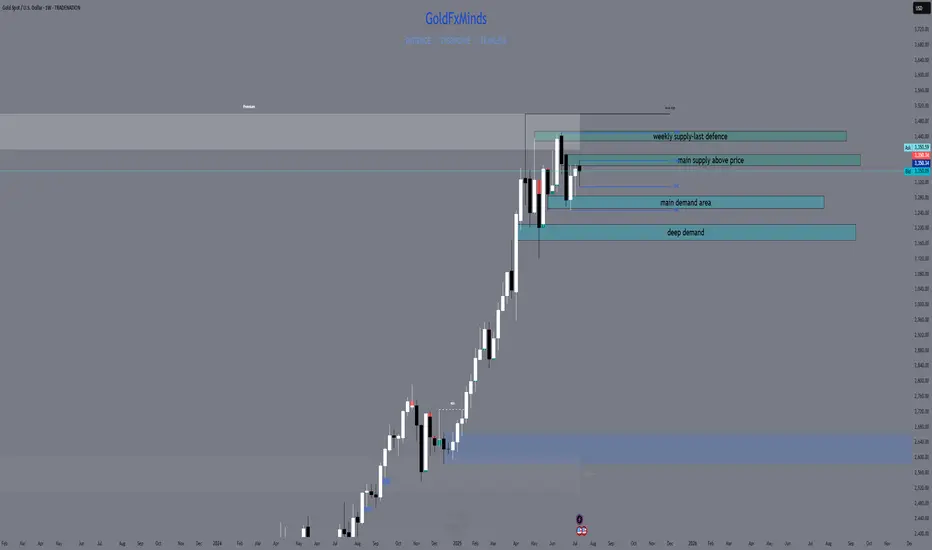
Weekly XAUUSD Outlook | July 21–25GoldFxMinds | Structure-Based HTF Plan
Hello traders,
This week we’re back in key HTF territory. Price is compressing inside a premium structure zone, between clean supply and demand areas. Trend is still bullish, but momentum is weakening — so we focus on structure to guide us.
🟨 Weekly Bias: Neutral | Range Structure in Play
We currently have no confirmed bullish or bearish bias on the weekly timeframe.
Gold remains trapped in a macro range between:
🟥 Upper Resistance Zone: 3355–3380
🟦 Lower Demand Zone: 3280–3240
Last week’s movement created a wick grab near 3375 followed by a strong push down, but without a clean break of structure — meaning we’re still inside a distribution–accumulation trap.
📌 Until we see a clear breakout (above 3380 or below 3280), the weekly bias remains neutral.
This is not a time to force directional trades on the weekly.
Instead, we wait for Daily and H4 confirmation, and position ourselves around the edges of this weekly range.
🔹 Last Week Recap
Weekly candle created a wick into 3377, rejecting just under previous week’s high. No BOS, no liquidity sweep with continuation — just a clear rejection inside supply, confirming premium trap.
Weekly candle closed with a top wick and small body — price is compressing under resistance. Still bullish structure, but not impulsive.
🔹 Weekly Key Structure Zones
🔸 3365–3390 (Supply)
→ Reason: Rejection from prior weekly high (3377), aligned with clean OB and FVG left behind from June breakout.
→ Structure context: No bullish BOS above 3375. This is now an unbroken supply zone with strong wick rejections. Liquidity sits above.
→ Use: Wait for price to tap back in → look for M15–H1 reaction for possible sell if no BOS above 3390.
🔸 3430–3450 (Supply - Last Line)
→ Reason: Unmitigated impulsive candle OB from prior macro swing high. This zone marks the final structure before a full continuation toward new highs.
→ Structure context: If this breaks with a strong BOS, macro structure flips bullish again.
→ Use: Only engage if price clears 3390 with strong volume and closes → watch this for last reaction zone.
🔸 3285–3260 (Demand)
→ Reason: Last bullish OB + FVG combo from early July, unmitigated. Price never retraced to this base since the rally.
→ Structure context: No BOS down yet, so this is still valid bullish origin.
→ Use: If price pulls back aggressively this week, watch this zone for LTF confirmation (CHoCH or BOS bullish). This would be a clean discount buy.
🔸 3210–3180 (Deep Demand)
→ Reason: Higher timeframe CHoCH origin zone, aligns with Fibonacci 61.8% retracement from entire May–July swing.
→ Structure context: Only in play if 3260 fails and we get clean BOS down on Daily.
→ Use: This is your swing buy zone if market breaks structure lower. Strong confluence for reaction.
🔹 HTF Structure Recap
Weekly trend: Still bullish (no BOS down), but compression under resistance
Structure range: Between 3390 and 3260 — price inside premium, no breakout yet
EMA Flow: Bullish but extended. Space for retracement.
RSI: Divergence above 3350 — supporting possible retrace.
🔹 Macro Events This Week
Tuesday: Powell speaks 🗣️ (volatility risk)
Thursday: Flash PMIs (usually directional)
Friday: Durable Goods & Home Sales 🏡
⚠️ Be patient on high-impact days. Let price come into your marked zones — don’t chase inside noise.
🔹 Summary & Plan
We are inside a macro range between 3390 (supply) and 3260 (demand). Structure is not broken — so we play both sides:
Sell Setup: If price taps back into 3365–3390 with no BOS → watch for reaction
Buy Setup: If price retraces into 3285–3260 → look for clean bullish CHoCH to validate
Middle area = chop. Wait for price to get to structure zones — don’t guess.
Thanks for reading 💛
We’ll drop daily and intraday outlooks once price moves closer to one of these structure zones. Until then:
🎯 Trade the reaction, not the prediction.
🔥 If you want these levels and sniper plans every day, follow , like 🚀🚀🚀 and drop a comment if you caught the move!
Stay focused, stay sharp, and never force a trade.
GoldFxMinds
Short Trade - LL LH - Down Trend - Divergence Chart Is showing
- Short Trade
- LL LH
- Down Trend
- Divergence

AUDUSD good structure for higher bullish
OANDA:AUDUSD whats next, we are have DESCENDING CHANNEL breaked, its followed by bullish push, but its not make to much in my op, at end price is make revers, its stop at end on strong sup zone (0.64900).
We are have in last day-two RBA and RBNZ today, price is start pushing looks like zone 0.64900 can be taked for valid zone, from which now expecting higher bullish push in next periods.
SUP zone: 0.65100
RES zone: 0.66300, 0.66600

Weekly XAUUSD Outlook (July 14–19, 2025)Hey team — we're entering a decisive week on gold as macro tensions heat up and price dances inside a key premium range. Let’s dive into what the chart is telling us.
🔸 HTF Bias: Weekly Structure Breakdown
Bias: Bullish with exhaustion signs
Current candle: Bearish rejection forming after last week's lower high inside the premium range
Trend: Still bullish overall, but stalling inside a distribution-like pattern
Weekly structure:
Confirmed CHoCH in early 2023 launched the bullish leg
Break of structure toward Higher High (HH) continues but weak high was created near 3500
We’re currently inside a weekly premium range, rejecting the upper quadrant
🔸 Key Weekly Confluences:
Zone Type Price Level Confluences
🔼 Resistance 3490–3500 Weak High + Premium zone + FVG + RSI divergence
🔼 Upper Range 3450–3470 Historical imbalance fill + EMA5 overextension
🔽 Support 3355–3320 Weekly OB + Discount side of premium leg + FVG
🔽 Deep Support 3200–3170 Last strong demand + BOS origin + RSI oversold risk zone
Fibonacci Range: 3500 = top of the bullish extension; 50% retracement sits around 3250
RSI (Weekly): Starting to curve down from overbought territory — watch for structure cracks
EMAs (5/21/50): Strong upside lock remains but a flattening 5EMA hints short-term slow-down
🗓 Macro + News Context:
This week is loaded with high-impact U.S. data and a parade of FOMC speakers:
Core CPI (Monday) and Retail Sales (Thursday) = critical for short-term inflation outlook
FOMC members speaking throughout the week = high chance of volatility spikes
Pre-G20 positioning (Friday–Saturday) could lead to risk-off flows or safety bids on gold
Watch Crude Oil Inventories and Building Permits for risk sentiment impact
The combination of CPI, retail sales, and continuous Fed commentary could cause abrupt sentiment swings — especially if inflation surprises to the upside again.
⚠️ What to Watch This Week:
Any weekly close above 3470 = potential sweep into weak high (3500)
Failure to hold 3355 zone = opens the door to revisit the deeper OB around 3200
Look for a lower high inside premium to confirm bearish weekly intent — otherwise we remain bullish
Any bounce from 3320 must show strong volume + FVG reaction to confirm continuation
✅ Final Notes:
This week is all about patience. We’re in a premium exhaustion phase, and with heavy macro catalysts on the table, gold is primed for a decisive breakout — up or down.
Stay flexible. Let price show its hand around the major zones. We’ll refine sniper entries on H4 and H1 once the weekly opens fully.
—
📌 If this breakdown helped, hit 🚀🚀🚀 follow @GoldFxMinds🔔 for daily updates as this structure develops and drop a comment:
Will gold sweep 3500 or collapse toward 3200? 👇
📢 Disclosure:
This analysis is based on the Trade Nation TradingView feed. I’m part of their Influencer Program and receive a monthly fee.
⚠️ Educational content only — not financial advice.

EURAUD higher bearish for expect
OANDA:EURAUD bullish trend nearly last two months.
Good structure visible, we have breaked trend line, sup zone (1.79100) breaked and DESCENDINGING TRIANGL is breaked, we are have and RBA and RBNZ in last days.
EUR looks like is start losing power and like cant more pushing, from here expectations are for more bearish.
SUP zone: 1.79500
RES zone: 177500, 177000

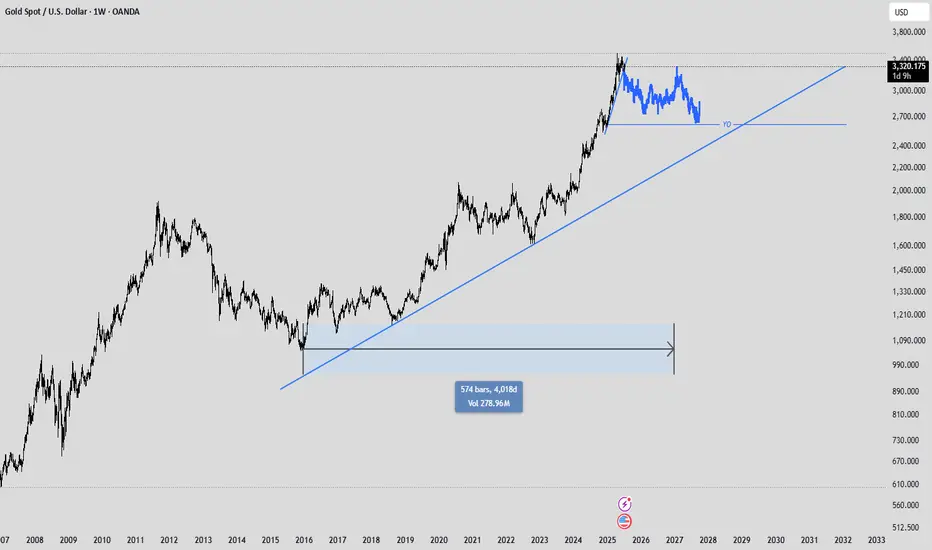
GOLDI believe gold will slowly retreat over the next two years, with a long-term price movement, to around 2625, the opening price of 2025. This movement may be similar to the movement between 2020 and 2022.
Lupin At Best Support !! This is the 4 hour chart of Lupin .
Lupin appears to be forming a potential Three Drives bullish reversal pattern, with both drives terminating at the 1.27 Fibonacci extension level, indicating a possible exhaustion of the downtrend.
Lupin is trading within a well-defined descending channel. It has once again approached the lower boundary of the channel, which lies around the 1865–1880 zone, and is showing signs of a bounce.
If this level is sustain , then we may see higher prices in Lupin.
Thank You !!

EURCHF bullish push expecting
OANDA:EURCHF price u PAu, currently looks like its on good, valid sup zone.
From here expecting bullish push
SUP zone: 0.93400
RES zone: 0.93950, 0.94100

CADJPY: Is the Trap Set?Price swept the liquidity below the previous day’s low and then broke structure to the upside. That’s often a strong sign that smart money just stepped in. I’m now watching for price to pull back and fill the imbalance it left after the break. If it respects that zone, there’s a good chance we’ll see it push higher toward the previous day’s high where more liquidity is waiting.
I’ve also added the 50 EMA on this chart as an extra layer of confluence. It helps me stay aligned with the overall market direction and avoid taking trades that fight the current trend.
It’s easy to get impatient here and jump in too soon, but discipline means waiting for the story to fully unfold. Trust your levels, trust the process, and remember that protecting your mental capital is just as important as protecting your trading account.

AUDNZD still bullish here
OANDA:AUDNZD second analysis on this pair. We have strong zones visible/created, DESCENDING CHANNEL breaked, from first analysis bullish here and still for new week bullish view having.
SUP zone: 1.08000
RES zone: 1.08850, 1.09250

An Inverted head and shoulder pattern gives opportunity-ForexBDAn inverted head and shoulders pattern has formed on the GBPAUD D-1 timeframe. The market has formed a second shoulder, so if the price goes up and breaks the neckline or resistance line, the market will go into an uptrend.
⭕️Risk Warning : Trading on financial markets carries risks!
©FXBD Official Team

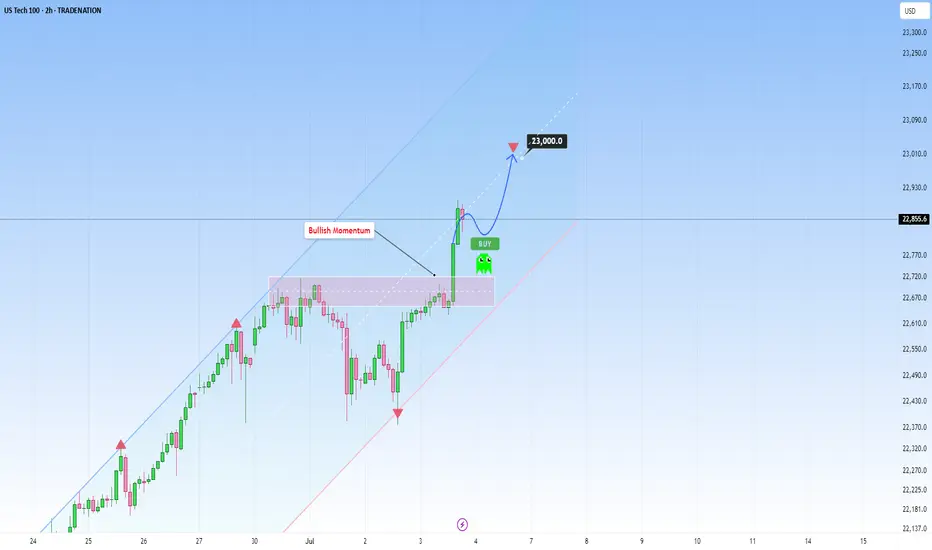
US100 rises sharply, with further upside target of 23,000At this stage, US100 continues to ride a dominant ascending channel structure, maintaining a consistent bullish structure supported by strong fundamentals as well as technical positioning.
The current price action reflects a high-confidence trend environment, underpinned by steady economic resilience in the U.S. tech sector and growing investor optimism surrounding AI-driven growth and corporate earnings. This alignment between structure and sentiment reinforces the strength of the current trend.
What’s especially encouraging is how the price has remained in the upper half of the ascending channel. Every corrective move has been shallow and absorbed quickly as well. This kind of behavior is exactly what you want to see in a strong trend.
From a structural perspective, the recent break of the prior swing high confirmed a bullish break of structure (BOS), reinforcing the broader uptrend. That’s a meaningful move, not just technically, but also psychologically, as it validates that bullish momentum remains intact and market participants are still positioning for higher levels.
No signs of weakness are showing up yet. If anything, the structure is intact and there’s no evidence of a shift in momentum. This makes it a good opportunity for traders who are "late to the party" to consider entering, as the trend still looks strong and continuation is likely.
As for upside targets, the 23,000 level is a natural extension. It aligns with the middle of the channel and fits within the current rate of expansion. If we don’t see any warning signs (like impulsive bearish candles), this target remains both technically justified and psychologically relevant.
Just sharing my thoughts on support and resistance, this isn’t financial advice. Always confirm your setups and manage your risk properly.
Disclosure: I am part of Trade Nation's Influencer program and receive a monthly fee for using their TradingView charts in my analysis.
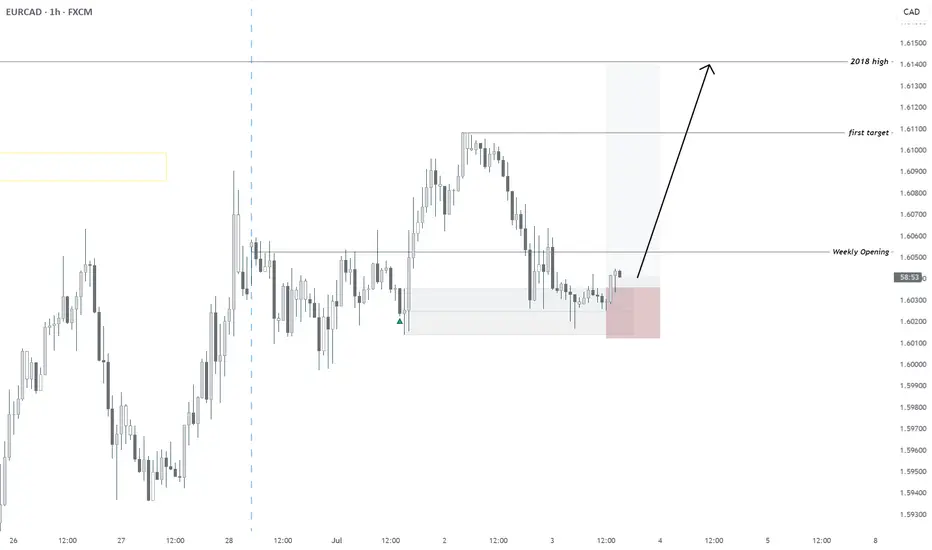
07/02/2025 | EURCAD | BULLISH - REACHING MULTI-YEAR HIGHDaily FX Outlook today:
All timeframes Bullish
Invalidation: 1.60055
First TP: on chart
Second: 2018 High