EURJPYEURJPY is in strong bullish trend.
As the market is consistently printing new HHs and HLs.
currently the market is retracing a bit after last HH, which is also the healthy Fib retracement level and local support as well. if the market successfully sustain this buying confluence the next leg up could go for new HH.
What you guys think of this idea?
Trendtrading

Trade/Market review for 6/26/24Great day today although maybe not the best conditions depending how you trade. I was able to catch a second chance entry for an Anty setup. Although price did not follow through with the trend, I caught the second leg of the attempted continuation.
Price trailed up above yesterdays high and then came to a swift collapse back down below followed by a repeated attempt to break yesterdays high again but failing to do so.
Price continues to bounce between yesterdays high and low.

Quick Update: A 3 Step System To Trade Forex PairsThis just happened right now as i was about to turn off my laptop and go to sleep
and i thought about you and how i could teach you the rocket booster strategy
now in my previous video, i showed you the #1 indicator that i use to
--
Find these rocket prices and watch it using the references below to learn more
also, watch this video as well
--
So you have 3 assignments
--
1. Watch the previous video
2. Watch this video
3. Rocket boost this content to learn more
--
Watching this video will help you understand this powerful 3 step system.
--
Disclaimer:You will lose money from trading please learn risk management strategies

EUR/USD Bullish Setup and Key LevelsThe low of June 14, 2024, created a Trend Changing Pattern making a high of 1.07614. We then saw a discount towards the low but failed to make a new low.
On Monday 24, June 2024 we saw a Bullish break of Structure making a high of 1.07465. The pullback low of 1.06836 before that bullish move is the Key price that gives us a high probability of bullish activity as long as the price stays above 1.06836.
Based on the price information, our high probability trade is to buy a 15Mins close above 1.06994.
Stop Loss: 1.06836
Target 1: 1.07465
Target 2: 1.07614
Think in Probability:
As traders, you must be careful to align your behavior and expectations with the following principles:
- Anything can happen
- An EDGE is only an indication of one thing happening over another
- There is a random distribution between wins and losses
- You don't need to know what will happen in order to make money in trading.

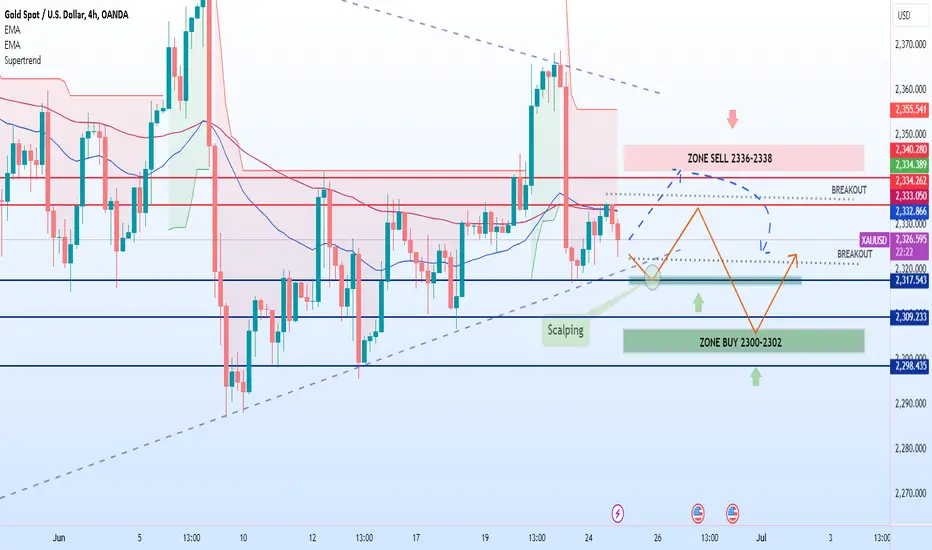
XAUUSD Gold prices continue to trend downPrice range to note:
Upper breakout amplitude: 2334
Lower border breakout: 2323 - 2316 - 2312
Support: 2316 - 2312- 2306 - 2300
Resistance: 2337 - 2341 - 2345 - 2349 - 2354
SELL price range 2336 - 2338
BUY price range 2302 - 2300 stop loss 2296
The scaling strategy will be launched when the above supported resistances signal on command.
Note: Full TP, SL to be safe and win the market.
NOTUSDTsee and watch :)
The price is in a very good support range, which is the intersection of the bottom of two channels... from here we should see a good movement...

Solana - TREND Indicators BEARISHUsing a Technical Indicator here which I use mainly to determine trend swings from a macro perspective. At least for the short term, SOL is bearish.
We've lost a long standing trendline that has held since October 2023, which is around the time that the bullseason started.
This will all largely depend on what BITCOIN does in the short term - more info on that HERE:
___________________________
COINBASE:SOLUSD

IT stockfundamental stock analysis
ROCE 20.6%, ROE 18.2%
P/E RATIO 30.4 low its peers and its average life PE
company has delivered good profit growth of 45.5% CAGR over last 5 years
company has been maintaining a healthy dividend payout of 19.4%
HIGHEST EVER EPS: 59.74
NEGATIVE
PROMOTERS slightly decreases 58.15% to 57.99%
FII decreases 21.59% to 15.83% and DIIS also

Waiting for SELL XAUUSD In The Supply ZoneI see the potential to sell in the drop base drop (DBD) supply zone area, after the sideways market is expected to bull and enter the supply area. My plan is to SELL XAUUSD in that area, with the SL limits that I accept, with a target of 2R I think is quite realistic.
Note: this plan is a XAUUSD trading idea. All risks are not our responsibility.

Gold → Be Ready for a pumping!Gold → Be Ready for a pumping!
hello guys!
Gold touched the bottom line of the channel and started an upward movement for a while!
now the price is forming a QM pattern and the level of this pattern is a great area to get a long position!
on the other side, the gray area assumed a reachable area due to the last engulfing!
so you can enter the blue area and put your target in the gray area!
___________________________
✓✓✓ Always do your research.
❒❒❒ If you have any questions, you can write them in the comments below, and I will answer them.
❤︎ ❤︎ ❤︎And please don't forget to support this idea with your likes and comment

GBPCAD TREND LINE BREAKOUT IDEAPair: GBPCAD
Timeframe: 4H
Analysis: Trend line, volume profile , support and resistance, trend break, reversal
—————
Key Takeaway: Been trending bullish for a good while and now seeing signs of a reversal. Price has broken our bullish trend line and is consolidation between two key levels of support and resistance. If we seen a lot of bearish movement and close below support then we will enter
—————
Level needed: need a close bellow 1.74000
—————
Trade: SHORT
RISK:REWARD 1:8
SL: 1.74200
TP: 1.73400 onward
—————
DO NOT ENTER OUR SETUPS WITHOUT CONFIRMATION

XAU - GOING SIDEWARD BUT STILL IN DOWN TRENDGold rose to around the $2,320 per ounce mark on Monday, rebounding from declines in the previous session, as investors awaited a series of economic reports and comments from Federal Reserve officials throughout the week to gauge the Fed’s interest rate cut timeline. Key focal points include the US retail sales data scheduled for later today, weekly jobless claims on Thursday, and Friday's flash purchasing managers' indices, all of which offer insights into consumer spending and economic strength.
Gold maintains the small frame sideway zone, the price tops create consecutive false breaks
🔴SELL GOLD: 2348 - 2350, SL: 2354
🟢BUY GOLD: 2307 - 2305, SL: 2301
Note: Zone 2300
⛔️Breakout:
📈 Breakout on: 2326 - 2341
📉 Breakout below: 2312 - 2305
🔼Support: 2305 - 2300 - 2291 - 2286
🔽Resistance: 2330 - 2340 - 2350
GOOD LUCK EVERYONE👍

Jayant Agro - A Positional PickAbout the company -
The Company is mainly engaged in manufacturing and trading of castor oil and its derivatives such as oleo chemicals.
The group is the leading player in India for the castor oil and castor-oil based derivative products. Group has over 5 decades of experience in castor industry.
Technical Parameters
1- the price gave a Breakout of Accumulation Range
2- intensity of volume is good at the time of breakout (suggests strength)
3- price looking to reach again at its all time high as monthly time frame suggests uptrend continuation
4- Price formed Flag N Pole chart pattern.
5- All the supporting indicators such as MACD, RSI, Bollinger Bands, are in good mood and suggestion longs.
Trade Plan
-- we can enter at Current Market Price and add when stock give some dip.
-- safe traders can wait for a dip of 5-10%
-- Stop loss is mentioned in chart as around 211
-- As there is a breakout of Flag N Pole Chart pattern, we can expect targets as the length of Pole which is around 550-570.
Disclaimer-
I am not SEBI registered. All the idea shared on this channel are for educational purpose. Consult your financial Advisor for any kind of investment.
Thank you
KARAN DINGRA

ARHS Day TradeARHS looks decent for a day trade here, It has been in a strong daily uptrend and had a gap up this morning that has been filled. Our premium indicator has been showing a potential bottom formation as well

very long termstock breakout its all time resitance level
target and stop loss mensioned on chart
we never recommend any stock to buy or sell
quant mutual fund A/C having 2.94% from last 3 quarters
but no fundamentals in stock very risky stock

Trading Idea: GBPJPY Buying Opportunity and Bullish OutlookIf you're looking for a buying opportunity on GBPJPY, focus on the double bottom retest zone between 199.62 and 199.37. Overall, I maintain a bullish outlook on GBPJPY.
Key Levels:
- Double Bottom Retest Zone : 199.62 to 199.37
Strategy:
- Buying Opportunity : Look for entry points within the double bottom retest zone between 199.62 and 199.37.
- Bullish Outlook : Given the overall bullish sentiment, consider holding long positions for potential gains.
Stay cautious and trade wisely. What’s your trade plan for GBPJPY? Share your thoughts in the comments!

GBPUSD Sideways Consolidation with Potential Upside BreakoutTimeframe : Weekly and 4-Hourly Charts
Predicted Move : Potential Upside Breakout
Analysis :
On the weekly chart, GBPUSD is currently in a sideways consolidation phase. Although the pair is near the top of this range, there seems to be a tendency for the market to break towards the upside. This observation is based on my 18 years of trading experience and intuition.
Key Points :
- Sideways Consolidation : GBPUSD is trading within a defined range on the weekly chart.
- Near Top of Range : Price is approaching the upper boundary of the consolidation.
- Potential Upside Breakout : Market tendencies suggest a possible break to the upside.
- Trading Experience : This analysis is supported by my 18 years of trading experience and gut feeling.
Strategy:
- Retest and Buying Opportunity : If you share my perspective, I'm looking for a retest within the buy zone on the 4-hourly chart at 1.2666 for a buying opportunity.
- Understanding the Buy Zone : It may seem like the buy zone has been broken, but with professional chart reading, it's evident it hasn't.
Note: This analysis is based on my personal trading experience and should not be followed blindly. Always conduct your own research and analysis before making any trading decisions.
Stay cautious and trade wisely!

EURUSD Bearish Trend and Bearish Bat Pattern CompletionEURUSD Bearish Trend and Bearish Bat Pattern Completion
Instrument: EUR/USD
Timeframe: 1-Hourly Chart
Current Direction: Bearish
Analysis:
EUR/USD is currently exhibiting a bearish trend. While the impulse to short immediately is strong, my preferred entry level is at 169.54. This price point aligns with the completion of a bearish bat pattern on the 1-hourly chart.
Key Points:
- Bearish Trend: The overall trend for EUR/USD is downwards.
- Bearish Bat Pattern: Completion level at 169.54, which offers a high-probability short setup.
- Entry Level: 169.54
- Chart Pattern: Bearish Bat Pattern
- Timeframe: 1-Hourly Chart
Strategy:
- Wait for Price to Reach 169.54: Monitor the price action and wait for it to approach the 169.54 level.
- Confirmation: Look for bearish confirmation signals around this level to enter a short position.
Stay tuned for updates and trade wisely!

GBP/JPY - Price is the leading IndicatorToday we are looking at GBP/JPY 5 Minutes timeframe.
Based on the price structure, we believe that the high probability direction in the short term is downtrend.
We have seen an ABC (Corrective) wave after the Low of Friday was made.
Key Structures to note:
Structure 4: 200.022 Downtrend continuation reversal point.
Structure 2: 200.674 Downtrend Violation Structure.
Always Think in Probability:
As traders, you must be careful to align your behavior and expectations with the following principles:
- Anything can happen
- An EDGE is only an indication of one thing happening over another
- There is a random distribution between wins and losses
- You don't need to know what will happen in order to make money in trading.

A Trading Plan Is Important For Success - Here Is MineIn this video we take a look at a trend continuation trading strategy. I explain my approach to trading how I identify a trend and what I look for for high probability trade opportunities. As always the information is for educational purposes only and not to be construed as financial advice.

XAUUSD - GOLD Zone 2322 rebounded💵GOLD PRICE AND ECONOMIC INFORMATION
Gold dropped to around $2,320 per ounce on Monday, following a more than 1% rise last week, under pressure from higher US Treasury yields, while market participants awaited further cues to gauge the Federal Reserve's monetary policy trajectory. Last week's data indicated that US consumer prices held steady in May for the first time in nearly two years, while producer prices unexpectedly declined.
Analysis:
Gold is currently stuck in the price range
Current gold range: 2340 - 2295
Between the 2 EMAs of frame D.
Large frame H4 shows a clear selling trend
🔴SELL GOLD: 2340 - 2342, SL: 2346
🟢BUY GOLD: 2307 - 2305, SL: 2301
⛔️Breakout:
📈 Breakout on: 2340
📉 Breakout below: 2312
🔼Support: 2312 - 2305 - 2291 - 2286 - 2280- 2274
🔽Resistance: 2338 - 2340 - 2350
GOOD LUCK EVERYONE👍

You Need An Edge In The Markets - Tradingview Has The Tools!👉📈 In the video, we look at a EURUSD trade opportunity, but more importantly, we delve into essential features and tools available on TradingView, which can considerably enhance your trading edge. Here’s what we cover:
✅ 1: Multi-Chart Layout:
- TradingView’s workspace allows you to view multiple charts simultaneously. This feature is particularly useful when analyzing currency pairs like EURUSD.
- By comparing different timeframes or related assets, you gain a broader perspective on market dynamics.
✅ 2: Currency Indexes:
- Currency indexes provide crucial insights. They help answer questions like:
Is the EUR (Euro) truly under pressure?
Is the USD (US Dollar) gaining strength?
- For instance, even if the EURUSD pair appears bearish, understanding the individual currency strengths is vital. Sometimes, two currencies may be trending in the same direction with one slightly stronger than the other.. you might look to avoid trading the currency pair associated with this scenario.
✅ 3: Entry, Stop Loss, and Target Levels:
- We explore how to identify optimal entry points, setting a suitable stop-loss, and define profit targets.
📢Leveraging TradingView’s tools, you can fine-tune your trading strategy and gain a real edge in the currency markets.
📢 Remember, steady conservative and consistant trading, along with rigorous risk management, is key. Happy trading! 🛡️🌟

Opportunity to BUY GBPUSD After RetestLook at the GBPUSD chart to find entry opportunities that are supported by several advantages supporting the setup. I saw that after the increase GBPUSD tried to retest its demand zone. This will support the Buy setup with some supporting data if the price:
1. Trend is still bullish.
2. Price enters the RBR demand zone
3. In the demand zone there is support.
4. There is an EMA 200, as a trend reading limit
The most important thing is that every risk setup has been measured.
Note: any risks regarding the GBPUSD idea plan on this account are not our responsibility, please keep your trading safe.
