Future AUDUSD selloff very possible Fundamentals : The RBA (Reserve Bank of Australia) kept interest rates at a 12-year high of 4.35%. The COT (Commitment of Traders) Non-Commercial Report for AUDUSD showed a larger number of participants holding shorts over longs but we’ve had about 15k shorts close their positions since the last COT report so there is that going against the bearish sentiment. Net position overall is still negative but it had a positive change of 13k or 13.51% which also goes against the bearish sentiment. % OI for longs is 18.40% while the % OI for shorts is 55.5%, Open Interest being 224.5k which is -14k lower then last weeks reports
Technicals : We get the 3-EMA crossing-over the 10-EMA to the downside while price action is possibly staying underneath both EMAs. Stochastic is facing down while crossing the 50% mark and the Momentum is negative.
Stop loss above the top trend line, Targeting prominent recent Lows.
Trendtrading

GOLD SELL - 15 Min EntriesGold has broken out of 2 bullish trend lines and I am looking for a retest of the resistance level before entering a sell position.
Price may sweep the highs to take out the liquidity above resistance before moving bearish.
I will be looking for the retest then waiting for a closure below $2321.30 for extra confirmation.

Trends in upward movement facing some exhaustionTrends are mostly in an upward movement stage, looking to remove the violation left of the 12hr / Daily lower high trend indicators.
Trends into today are;
Last Macro Trend Signal Spots (ES Contract)
30m - 5086 Uptrend (5/2/2024) Higher High
1Hr - 5117 Uptrend (5/1/2024) Higher High
2Hr - 5117 Uptrend (5/1/2024) Lower High
3Hr - 5157 Uptrend (5/3/2024) Higher High
4Hr - 5148 Uptrend (5/3/2024) Higher High
6Hr - 5148 Uptrend (5/3/2024) Higher High
12Hr - 5204 Downtrend (4/4/2024) Higher Low
Daily - 5166 Downtrend (4/12/2023) Higher Low
Weekly - 4769 Uptrend (12/11/2023) Higher High
Monthly - 5304 Uptrend (03/31/2024) Higher High
As explained in the video, everything is in a higher high between 30m-6hr except the 2hr, which was part of the Powell Pump reversal.
As I explained my trades over last week were a 70 point gain into the Powell Pump, a 70 point reversal after the Powell Pump, and a Long position from 5080 which I cashed out today as we pushed above the Daily downtrend resistance of 5170 for just over $4000. Additionally those Soybean Meal contracts I acquired around 335 were both cashed at around 372 for about $3700 each (I had 2). I don't say this to brag, but moreso to explain why I am not hungry for another trade, as I'm already financially set for the month of May at just under $20,000. This will be why I may seem overly picky about my trades and what may be a good position I may wait if it doesn't look like a borderline perfect trade.
Economic Calendar is very light this week, just jobs data on Thursday.
Earnings calendar is mostly important to watch tomorrow, especially around Disney from my perspective.
Geopolitical tensions could hit a new tension point as Israeli troops move into Rafah.
Overall, my general sentiment on the short term, and probably most of this week, is sideways at the moment.
Safe trading, and remember your risk management.

hotel stock1) Lifetime high stock
2) The tourism sector is a focus, so pay attention to this stock.
3) fundmental stock is good but small, high PE
4) all target and stoploss in chart
5) 200 TG
no recommendation for buy and sell

PacMan Trend Symbol; Guidance into PCE and Next WeekThe video explains it all a lot better, but basically, we are sitting with higher highs and lower lows on the trend timeframes that brought us here (30m-4hr), otherwise known as the Pac-Man symbol.
Trends into today are;
Last Macro Trend Signal Spots (ES Contract)
30m - 5083 Uptrend (4/25/2024) Higher High
1Hr - 5083 Uptrend (4/25/2024) Higher High
2Hr - 5131 Uptrend (4/25/2024) Higher High
3Hr - 5123 Uptrend (4/25/2024) Higher High
4Hr - 5131 Uptrend (4/25/2024) Higher High
6Hr - 5250 Downtrend (4/2/2024) Higher Low
12Hr - 5204 Downtrend (4/4/2024) Higher Low
Daily - 5166 Downtrend (4/12/2023) Higher Low
Weekly - 4769 Uptrend (12/11/2023) Higher High
Monthly - 5304 Uptrend (03/31/2024) Higher High
If we move directly higher from here, the 6hr is going to be a lower high, but it will be the lone trend calling for a lower movement, as when the 12hr and Daily strike, we will have a higher high.
I did not account for us to drop so harshly from GDP data yesterday, and certainly didn't expect that drop to fizzle out and us to push higher over after this occurred. This is why I almost never short into Earnings season.
Economic Calendar;
PCE Data is today. I foresee it pushing us lower, but not with enough confidence to blindly trade short into it.
Major next issue is the Fed Meeting on Wednesday of next week.
Overall, likely just missed opportunity from not going short at the close of Wednesday and catching most of the move back down yesterday, although I likely would have let at least half the profit reverse before I jumped out anyways.
I expect I'm going to miss out on a drop today, but without trend confirmation I just don't feel strongly enough about shorting into this PCE data at this point.
I made some good trades earlier, so I'm fine with it, and I still have Gold Long from 2305 and my Soy contracts are FINALLY starting to generate some revenue at around $1500 each.
Safe trading, and remember your risk management.

GROK NEW INCREASE VOLUMEGrok showing a new interest volume which could be confirmed in the coming time frames.
GROK is also one of the coins that is green for the cycle
This coin could need some time to find the right levels.

Up trending EurUsd awaiting for the FED decisions Confirming for an already broken Wyckoff structure at the bottom of the fractal, next point is a mitigation of the last point of the last downward trend or maybe a total liquidation of it

USDJPY Analysis: Caution on Strong Bullish RallyUSDJPY is on a strong bullish rally, mainly due to the weakening of the Japanese yen. If you decide to chase the bull, beware of getting caught in the act.
That's because the Japanese Yen has reached the BOJ intervention zone. I think the real worry comes in when the market strikes the 161.93 to 163.26 range, and the intervention would be imminent.
Without any intervention for the next 1 to 2 weeks, I will call the Bluff on BOJ.
Stay away from this pair if you are not a Forex Trading veteran.

GBPUSD Analysis: Trend Trading Opportunity- Trade Strategy: Trend Trading - Sideway Bounce Setup
- Key Levels: Key Support at 1.2461, Target at 1.2502
- Profit Potential: 41 pips (410 USD/lot)
Analysis:
- Trade Strategy: Trend Trading - Sideway Bounce Setup
- Key Levels: Key Support at 1.2461, Target at 1.2502
- Profit Potential: 41 pips (410 USD/lot)
Trade Plan:
- Long Opportunity: Consider going long at 1.2461 for a trend trading opportunity
- Take Profit: Set initial target at 1.2502 for a profit potential of 41 pips
- Risk Management: Implement effective risk management techniques to manage potential losses
Insights:
GBPUSD presents a trend trading opportunity with a Sideway Bounce setup, offering a buying opportunity at the Key Support level of 1.2461. Traders can aim for an initial target at 1.2502, providing a profit potential of 41 pips. It's essential to closely monitor price action and adhere to risk management principles for successful trading outcomes. Share your insights and trade plan below!
📈 Capitalize on the trend trading opportunity presented by GBPUSD, leveraging the Sideway Bounce setup for potential profits within the current market conditions!

Trends in conflict; Earnings Likely to cause a short reboundSo again, I cashed out my trade just above 5000 as we fell last night following the Israel drone strike against Iran. Most of that dip appears to have resolved itself, at least for the moment, but those geopolitical issues will likely be crucial to the potential of a market fall in the coming days.
I go into it in the video, but major Earnings are next week, and I expect the week to be typical which means we will rebound during the Earnings season, especially next week with major powerhouses reporting (Microsoft, Google, Tesla). If NVidia was reporting I'd suggest we could rise back up towards 5300, but they are not until the end of May.
Trends into today are;
Last Macro Trend Signal Spots (ES Contract)
30m - 5040 Downtrend (4/18/2024) Lower High
1Hr - 5220 Downtrend (4/12/2024) Lower Low
2Hr - 5203 Downtrend (4/12/2024) Lower Low
3Hr - 5197 Downtrend (4/4/2024) Lower Low
4Hr - 5197 Downtrend (4/4/2024) Lower Low
6Hr - 5250 Downtrend (4/2/2024) Higher Low
12Hr - 5204 Downtrend (4/4/2024) Higher Low
Daily - 5166 Downtrend (4/12/2023) Higher Low
Weekly - 4769 Uptrend (12/11/2023) Higher High
Monthly - 5304 Uptrend (03/31/2024) Higher High
This shows lots of downward pressure, although several of the trends are a bit oversold as the 30m has managed to run away with the market.
Economic Calendar;
Nothing important today or the start of next week. GDP is next Thursday though and CPE is Friday.
If I was to express some sentiment it would be
Shorter Term - Neutral/Bearish
Short Term - Neutral
Medium Term - Neutral/Bullish
Long Term - Neutral
Longer Term - Bullish
... if the above makes any sense!
Oh, and yes, I still have those Soy contracts. They are worth a whopping $1200 after all this time. I may trade them in for some 6E contracts if I see that look like it could run back up to 1.10 any time soon.
Safe trading, and remember your risk management!
Safe trading, and remember your risk management!

CARVANA $CVNA - Feb. 15th, 2024CARVANA NYSE:CVNA - Feb. 15th, 2024
BUY/LONG ZONE (GREEN): $48.00 - $60.00
DO NOT TRADE/DNT ZONE (WHITE): $40.00 - $48.00
SELL/SHORT ZONE (RED): $25.25 - $40.00
By request. My main focus would be on the range between $40.00 - $48.00, this area has determined the trend five times, which are seen each time price touches and breaks or touches and rejects. Currently I'm looking at a bull trend that was set after a breakout of the range in the $40-$48 zone. Any data before June 2023 I was not considering. If I had to look for an upside target, assuming the trend stays bullish long term once price reaches $60, the next logical point would be $103. Due to the lack of data and because price is trading away from the start of my bullish zone, I personally would not look to enter until there is a reaction to the $60 area or a pullback to the $48/$49 zone.

GBP/USD Follow upA quick Follow-up on the GBP/USD Long Trade.
We have reversed the position at 1.2448 a test of the structure 2.
Technically, the trend is still down and a failure to trade above the structure 2 makes the GBP/USD still bearish.
The last Bullish wave 4 to 5 has given us a short setup using the Fibonacci. This is a high-probability setup for a strong reversal (short) or a downtrend continuation setup.
Initial Target 1.2347, If the price breaks below 1.2330, the downtrend will continue.
Stop Loss: 1.2473

XAUUSD Still Buy TrendDiscover an enticing Buying opportunity in GOLD as it undergoes a critical retest of a key resistance area. With market analysis, technical indicators, and price action as your allies, evaluate the potential upside move. Stay vigilant and informed to capitalize on this precious metal's market dynamics.

OIL BUYOil reached a support level again.
We haven't broken the rising trend yet, we can expect another rise.
I trust that we can also make a small profit with this.

USDJPY Analysis: Bullish Bias Despite Market Volatility- Market Sentiment: Bullish Bias
- Weekly Chart Analysis: Violation of Recent Resistance Indicates Strength
- Trade Plan: Buying Opportunities Favored over Shorting
Analysis:
- Market Sentiment: Maintains Bullish Bias on US Dollar, despite market volatility
- Weekly Chart Analysis: Notable violation of recent resistance level on the USDJPY Weekly chart
- Implications: Market speculation regarding potential BOJ intervention in FX Market
- Trade Plan: Prefers buying opportunities over shorting due to pair's independent behavior
Trade Plan:
- Buying Opportunities: Look for buying opportunities at support levels (e.g., 154.27, 154.12, 153.89)
- Support and Resistance Trading: Shorting opportunity at 154.70 on the 1-hourly chart, although not actively pursued
Insights:
Maintaining a bullish bias on USDJPY despite market volatility, with a focus on buying opportunities over shorting. Preference for buying entries at support levels, while remaining cautious of resistance levels for potential shorting opportunities. Exercise caution and adaptability in response to the pair's independent behavior.
📈📉 Remain vigilant and adaptable in navigating the USDJPY market, prioritizing risk management and flexibility in trade execution!

Buy Low, Sell High: Meta and Nvidia's Opportunity NowBuying NASDAQ:META and NASDAQ:NVDA : Balancing Risk and Reward
Despite the recent market downturn, the long uptrend and strength of Meta and Nvidia remain intact. While short-term market fluctuations may present challenges, the long-term growth potential of Meta and Nvidia outweighs the current market volatility.
Risk-Reward Profile:
While investing in any stock carries inherent risks, the risk-reward profile for Meta and Nvidia appears favorable at current levels. Despite short-term losses, utilizing volatility to compute a close stop-loss level can effectively manage risk in this negative environment while leaving ample room for potential gains. This strategy, frequently employed by seasoned traders, maximizes opportunities in turbulent markets.
Stop level: 480
Weekend Factor:
However, it is important to keep in mind the negative exposure to war-related news associated with any long trade carried before the weekend. There's no guarantee that Monday's open will align with or exceed the stop level, potentially resulting in larger losses than anticipated. Therefore, investors should carefully assess their risk tolerance and adjust their positions accordingly.
***************************
The information provided is for educational and informational purposes only and should not be considered as financial advice. Investing in stocks carries risks, and individuals should conduct their own research or consult with a financial advisor before making investment decisions

Trends in conflict; Signs support "Sell in May and Walk Away"Trends into today are;
Last Macro Trend Signal Spots (ES Contract)
30m - 5111 Uptrend (4/17/2024) Lower High
1Hr - 5220 Downtrend (4/12/2024) Lower Low
2Hr - 5203 Downtrend (4/12/2024) Lower Low
3Hr - 5197 Downtrend (4/4/2024) Lower Low
4Hr - 5197 Downtrend (4/4/2024) Lower Low
6Hr - 5250 Downtrend (4/2/2024) Higher Low
12Hr - 5204 Downtrend (4/4/2024) Higher Low
Daily - 5166 Downtrend (4/12/2023) Higher Low
Weekly - 4769 Uptrend (12/11/2023) Higher High
Monthly - 5304 Uptrend (03/31/2024) Higher High
As explained in the video, the shorter-term trends are calling for lower moves, although the longer-term trends are violated and would be calling for a rebound. In spite of that conflict, I don't expect that rebound in the immediate future at this point.
I go into a longer explanation, but overall I have been shorting the market, and currently have a Short position from 5200. I am looking for this position to hit around the 5000 mark, and then may cash out and wait and see what happens at that 5000 mark. I may look for a reversal position if we head near that area.
The vibe is basically that Inflationary issues persist, geopolitical tension could cause chaos, and ultimately the US Economy is amazing and resilient.
Next week we have major earnings though, so this short move lower could be done for and we could head into a rebound then, before heading lower or at least sideways once again going into May, as we see the old trading technique of "Sell in May and Walk Away" hold true.
General Sentiment - Bearish
Overall Sentiment - Bullish
Safe Trading, and remember your risk management

#ETH seems like is ready for the upside moveAs visible in the chart, we have a well-established bullish trend and market structure in the daily timeframe chart of ETH.
Following the formation of a top on March 12th, 2024, the price initiated a corrective bearish move, corresponding to an ABC zigzag correction and retracing approximately 61.8% from the previous bullish move.
Furthermore, the price has also reached a bullish trendline, which could act as static support.
Additionally, tomorrow, on April 19th, we have the halving event, which has historically brought buying pressure to ETH.
If you've found this analysis helpful, please take a moment to like, comment, or share your thoughts with me.

AUDJPY: Thoughts and Analysis Today's focus: AUDJPY
Pattern – Continuation
Support – 98.90 & 98.35
Resistance – 100.20 & 100.60
Hi, traders; thanks for tuning in for today's update. Today, we are looking at the AUDJPY on the daily.
We could have a new continuation forming as buyers have beaten yesterday's high backing in a second positive session. Australian employment data came in mixed with a decrease in unemployment. This, with a weaker Yen, looks to be supporting buyers at this stage today.
If we see a move below today's low or back below 98.90, this could be a warning, as it will cancel out continuation ideas in the short term.
What do you think? Do you think this is a continuation pattern?
Good trading.

Keltner Bands Pullback StrategyHere we take a look at trading pullbacks using the Keltner Channels. I cover the initial setup, the types of entries, and trades to avoid.
This setup contains 3 parts:
The channel touch
The Pullback
The Entry
The Channel Touch
Here is an example of the beginning signal in our setup, a band touch. The top and bottom bands represent the ATR (Average True Range) of a loopback period. So a touch of the band indicates volatility in the underlying stock or commodity. This also presents us with a chance for a nice pullback with continuation.
The Pullback
The pullback is simple, it is a reversion to the mean. So, the price pulls back to the mean (the ema) that the Keltners are based on. From this point, you can start to determine the entry.
The Entry
Depending on your style, a stop order, or limit order trader, you get to create your style to enter the trade. The following are some ideas: zero line MACD cross, second entry (price action) long or short, a trigger zone (for limit order traders), and an ema touch (limit order traders).
Zero Line Entry
Price pulled back and crossed the zero line on the modified MACD indicator.
Second Entry Long (High2)
The entry is the second attempt to break the previous bars high in a pullback.
The Trigger Zone
I created these based on an internal Keltner channel. You can set your limit orders anywhere inside of them.
EMA Touch
Whenever the price touches an offset ema you can enter. So you can place and move your limit order as the ema moves. I like to offset by one because you are guaranteed a price touch (ema doesn't move). Backtesting is also my accurate with an offset ema.
Conclusion
The Keltner channels offer an extremely powerful way to determine a potential pullback within a trend. They also help define trends (on the first touch) and help objectively identify climatic behavior. This strategy as a whole allows for high-quality setups and the flexibility of entering and exiting trades based on trading style. I like to shoot for a 1:1 based on stop placement.

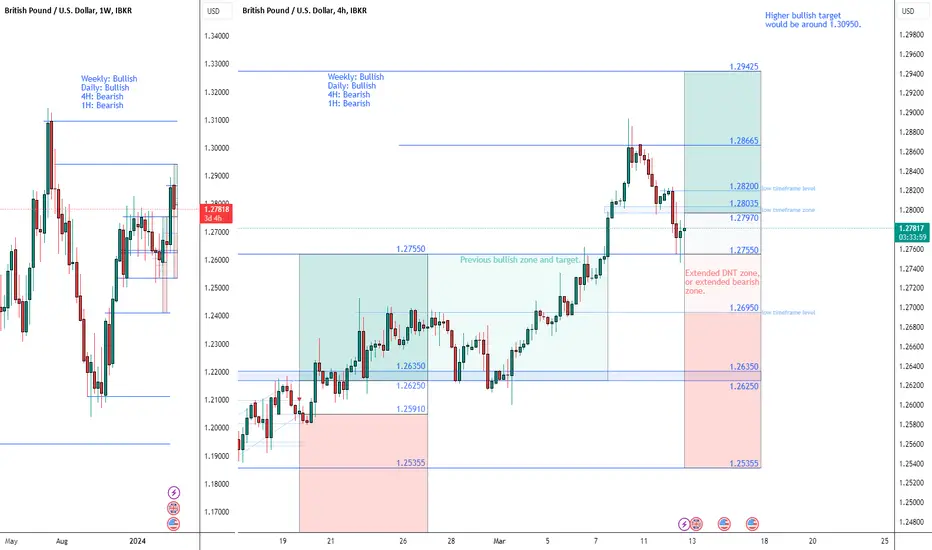
GBPUSD $GBPUSD - Mar. 12th, 2024GBPUSD FX:GBPUSD - Mar. 12th, 2024
BUY/LONG ZONE: 1.27970 - 1.29425
DO NOT TRADE/DNT ZONE: 1.27550 - 1.27970 (Extended area would be 1.26950 - 1.27970)
SELL/SHORT ZONE: 1.25355 - 1.26950 (Extended area would be 1.25355 - 1.27550)
Weekly: Bullish
Daily: Bullish
4H: Bearish
1H: Bearish
Previous bullish target is shown and for the visual I did extend it on the screen. The expanded DNT and bearish zones are shown for either later or earlier entries, just depends on how the lower timeframe structure develops. Some lower timeframe levels and zones are drawn in a lighter blue for some reference areas on when to enter.
There is no indication on the weekly and daily timeframe other than current momentum that the price is going to turn bearish.
Dropping down to the 4H timeframe: structure has turned bearish and has broken down through the zone that was used to determine the bullish zone.
Dropping down to the 1H timeframe: price has created clear bearish structure and is currently holding, with a retest of the previous low, now the current structural lower high.
Bears can enter as soon as 1.27550 or wait for a later entry around 1.26950, both are displayed on the chart.
Bulls should wait for structural reversals to develop on the 1H/4H timeframes and/or for price to break back above 1.27970.
trend analysis, technical indicators, support and resistance, gbpusd, gbpusdlong, gbpusdshort, gbpusdanalysis, gbpusdtrend, trendtrading, pounddollar, gu, gulong, gushort, forex, fx, FX:GBPUSD
Wave STructure Analysis | GBP/USD M15The rally that happened in the Cable due to the news has seen a follow-through that created the Bullish MH3 (Green Wave). This trend however has been weakened by the pullback of Structure 4. This price has traded below the prior Structure 2. Having said that, the price is still firmly trading in the Buy Zone of the Fibonacci measured from the low to the high of 3.
The high probability direction is still bullish based on the current setup. Below 2DL we will stand aside, which also corresponds to the 0.618% retracement of the current bullish wave.
Target 1: 1.2500
Target 2: 1.2529
Stop Loss: 1.2430

#AUDJPY bullish possible continuation movePrice has correctively reached an important medium-term support zone , which is further reinforced by the presence of the 200EMA.
Additionally, we observe that the price has taken out liquidity from the low and formed what appears to be a double bottom pattern.
These indications suggest the possibility of a bullish continuation move, potentially driving the price back to previous highs and beyond.
If you've found this analysis helpful, please take a moment to like, comment, or share your thoughts with me.
