CAKE retesting done. Ready to fly?As we discussed earlier, NASDAQ:CAKE retested the resistance line successfully. Now it is ready to fly. If Bitcoin remains above 100k in the following weeks, we look forward to powerful fundamental news from Pancakeswap team (e.g. launching Pancakeswap V4) to send NASDAQ:CAKE price to the moon. Fill your bags and get ready ...
-------------------------------------
Share and follow me for further updates.
Triangle

ETH - This will take time Part IIAs previously outlined, the fourth wave of the Primary degree in Ethereum (ETH) is forming a large triangle pattern, consistent with the corrective structure observed in XRP. This pattern is likely to extend over time, with the fifth wave of the Primary degree expected to begin around November or December 2025. A potential sharp breakout could occur starting in February 2026, signaling the start of a significant bullish move. If this breakout materializes, ETH could experience a substantial price increase, potentially exceeding current expectations, with a target significantly higher than anticipated.

KHC is going to go lower on finished pullback from triangleThe Pullback from the break from the support of the triangle is completed. This is simply bearish and the price of KHC should go down lower

TRUMPUSDT – RSI Bounce & Symmetrical Triangle BreakoutTRUMPUSDT is showing a strong technical setup on the 8H timeframe, with bullish confirmation from both momentum and pattern breakout.
✅ Key Technical Signals:
RSI 50 Bounce: Price recently bounced off the RSI 50 midline, a classic sign of a continuation of bullish momentum.
Symmetrical Triangle Breakout: We've broken out above the triangle resistance, suggesting a potential trend reversal or continuation to the upside.
📈 Trade Setup:
Entry: On confirmed triangle breakout.
Stop Loss: Just below recent structure at 13 USDT — the price before breakout confirmation.
Take Profit Targets (Fibonacci Levels):
🎯 TP1 – 0.236 Fib: 24.260 USDT
🎯 TP2 – 0.382 Fib: 34.854 USDT
🎯 TP3 – 0.5 Fib: 43.905 USDT
🎯 TP4 – 0.618 Fib: 52.956 USDT
🎯 TP5 – 0.786 Fib: 65.371 USDT
⚠️ Always use proper risk management. Not financial advice – DYOR.

GOLD - Price can rise a little and then fall to support areaHi guys, this is my overview for XAUUSD, feel free to check it and write your feedback in comments👊
Some days ago price grew in a rising channel, where it broke $2975 level and then rose to $3160 level, but next it corrected.
Price exited from channel and entered to triangle, where it made a strong impulse up.
Gold broke $3160 and $3345 levels, reached resistance line, and then made a correction movement, also making a first gap.
Next, price some time traded below $3345 level, and later it at the last time rose to resistance line and then drop.
After this, Gold made a second gap and then exited from triangle, after which it bounced from support level and started to grow.
Possibly, price can bounce from support line of triangle and then fall to $3125 support area.
If this post is useful to you, you can support me with like/boost and advice in comments❤️
Disclaimer: As part of ThinkMarkets’ Influencer Program, I am sponsored to share and publish their charts in my analysis.

Is this a platinum breakout?Using a weekly chart of a platinum ETF.
Breaking out above it's triangle pattern. Needs confirmation though or retrace in the next coming months

GOLD → Need to break Triangle Pattern !!!Gold Analysis
Following a rejection at the 3,120.00 level last Thursday — a key H4 demand zone — gold is currently forming a triangle pattern.
🟢 Bullish Scenario:
If the price breaks above the 3,250.00 level, it may present a buying opportunity with the nearest target at 3,320.00 .
🔴 Bearish Scenario:
If the price breaks below the lower trendline of the triangle pattern, the nearest selling target is seen around 3,055.00.
Best Regard

Inverse H&S + Triangle = Gold’s Perfect Setup for a BreakoutAs I expected in my previous idea , Gold ( OANDA:XAUUSD ) started to rise after a correction and made another attack on the Resistance zone($3,280-$3,245) .
Gold is currently moving near the Resistance zone($3,280-$3,245) and Yearly Resistance (2) .
If we look at the Gold chart from a Classic Technical Analysis perspective, two Classic Patterns are clearly visible.
1- Inverse Head and Shoulders pattern , which is a good sign for a Resistance zone($3,280-$3,245) breakout.
2- Symmetrical Triangle Pattern is also a sign of a continuation of the recent bullish trend
In terms of Elliott Wave theory , Gold seems to have completed the corrective waves , and we can expect the start of an impulsive wave . Breaking the Resistance zone($3,280-$3,245 ) can be a good sign for the start of an impulsive wave and a gold pump .
I expect Gold to trend higher in this week , and the first sign could be a break of the Resistance zone($3,280-$3,245) . The targets are clear on the chart.
Note: If Gold touches $3,179 , we should expect a drop.
Gold Analyze ( XAUUSD ), 1-hour time frame.
Be sure to follow the updated ideas.
Do not forget to put a Stop loss for your positions (For every position you want to open).
Please follow your strategy; this is just my idea, and I will gladly see your ideas in this post.
Please do not forget the ✅' like '✅ button 🙏😊 & Share it with your friends; thanks, and Trade safe.

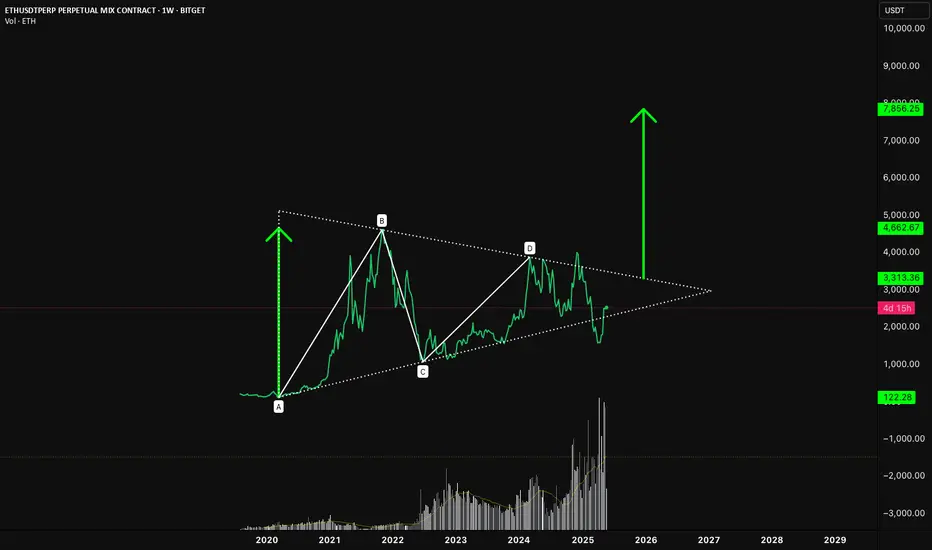
ETH/USDT – The Ethmuda TriangleZoom out.
Since the 2021 highs, Ethereum has spent years grinding sideways, printing what now looks like a textbook symmetrical triangle. Labeled here as an ABCD compression pattern, this structure has been tightening since the macro top (B), slowly building energy within narrowing volatility.
🔺 Structure Breakdown:
• A to B: The explosive bull run from the March 2020 low to the all-time high.
• B to C: A deep correction that shook out weak hands and set the bottom.
• C to D: A multi-year coil of consolidation, forming higher lows and lower highs.
• D to ?: We’re now nearing the apex, where compression typically leads to expansion.
📍 The Trigger Zone
The key level to watch is $4,000–$4,200. A clean breakout above this zone would invalidate the downtrend line and break the triangle to the upside. From a pattern-measured move perspective, the height of the triangle (A to B) projected from the breakout point suggests potential upside into the $7,800–$8,000 region.
🧠 Why This Matters
• Volume has been tapering throughout the structure — classic behaviour in large triangles.
• Market sentiment remains uncertain, making a breakout all the more impactful.
• Ethereum fundamentals are arguably stronger than they were in 2021 — Layer 2s, institutional use cases, and new ETH ETF speculation all add fuel.
📊 Potential Target:
• Immediate resistance: $3,300
• Breakout trigger: $4,000–$4,200
• Projected move: ~$8,000
🕰️ When? Well.. who knows but it does sort of line-up with my previous idea using a SOL/USDT chart that says early next year.. and not this year.
This is the type of setup plays out pretty well on lower timeframes, why not a massive one? The real question is: Are we on the verge of expansion after compression?
Let the chart do the talking.
⚡️ Not Financial Advice
Gold Long: Update on Elliott Wave CountsI suggest that we have seen wave 1 of 3 and wave 2 of 3 completion and is now going into a wave 3 of 3 that is expected to break out of the ascending triangle.
The stop loss is now adjusted to 3200 and the most conservative target gives us $3300 even though we are still aiming for >$3500.
Good luck!

GOLD (XAUUSD): 2 Strong Bullish Patterns
As I warned you earlier, Gold is resuming a growth.
After completing a bullish accumulation, the price
is currently breaking both a neckline of an ascending triangle
and an inverted head and shoulders formation on a 4H.
I think that the price will rise more and reach 3320 resistance soon.
❤️Please, support my work with like, thank you!❤️
I am part of Trade Nation's Influencer program and receive a monthly fee for using their TradingView charts in my analysis.

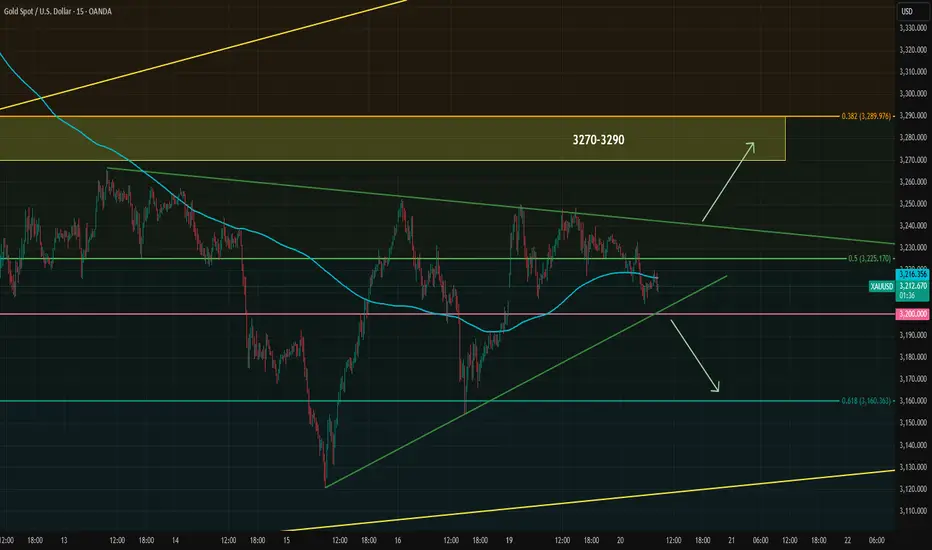
Gold Volatility May Increase with Ongoing NewsflowGold has formed a triangle pattern on the 15-minute timeframe. Given the recent flow of mostly gold-positive news, there is a chance that gold may attempt a breakout from this formation today.
From a demand perspective, the aggressive gold hoarding phase appears to be over, and "managed money" is gradually taking profits without triggering significant downward pressure. As a result, the medium-term outlook remains “sell the highs,” assuming current conditions persist. However, several short-term developments are providing support:
1- A dovish rate cut by the RBA
2- Jamie Dimon’s warning on market complacency amid stagflation risks
3- No Ukraine ceasefire in place, and Trump appears to be backing off threats against Russia following a call with Putin
4- Japan saw one of its weakest 20-year bond auctions
5- Several euro-positive headlines yesterday that could weigh on the dollar index
If these factors are enough to keep gold above the 3,200 support level today, a breakout above the 3,245 resistance could occur, potentially opening the way for a test of the major 3,270–3,290 resistance zone. Key levels to watch today are 3200 and 3245.
GOLD → Short squeeze before a drop to 3150?FX:XAUUSD is consolidating. The market needs a driver, but due to the unstable fundamental background, traders have switched to a wait-and-see mode. Consolidation could turn into strong movement at any moment. But in which direction?
Gold under pressure: the market is waiting for signals from the Fed and negotiations. The dollar is putting pressure on the market amid expectations of trade negotiations with India, South Korea, and Japan, as well as statements from the Fed.Earlier, the metal was supported by the weak dollar after Moody's downgraded the US credit rating, but growing interest in risky assets and hopes for peace between Russia and Ukraine reduced demand for gold. Key factors — negotiations and comments from the Fed — will continue to influence the dynamics of the dollar and gold.
Technically, the price is in a downtrend and within consolidation. A breakout from consolidation could be accompanied by strong momentum, but I believe that there will be no countertrend movement and that a retest of resistance could end in a decline...
Resistance levels: 3265.5, channel resistance
Support levels: 3206, 3153
The most likely scenario within the bearish trend is a short squeeze and a downward breakdown from the triangle (the fundamental background and economic risks are slowly but surely declining, and gold may lose value). A false breakout of 3250-3265 could trigger a continuation of the trend towards 3150-3120.
Best regards, R. Linda!

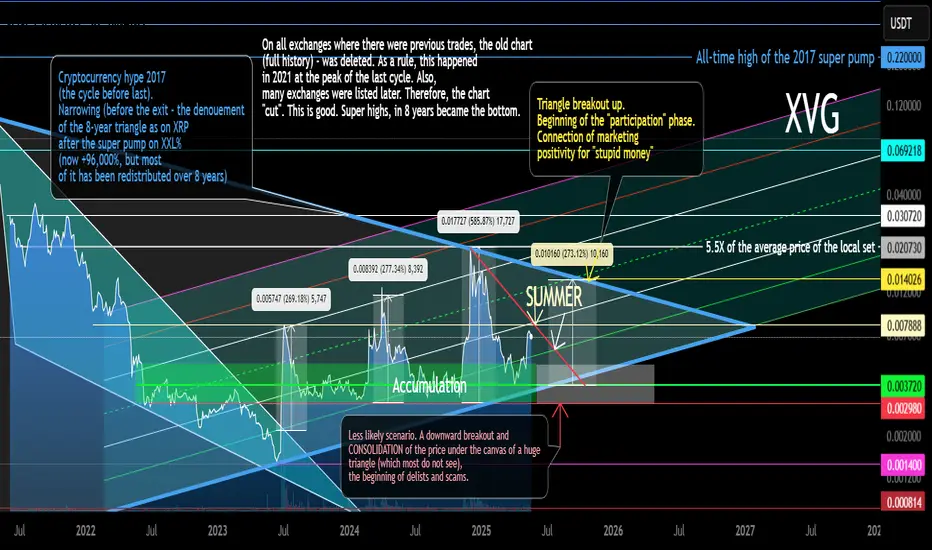
XVG Secondary Trend (Part) Triangle Resolution 8 years 05 2025Logarithm. Time frame 3 days. Linear instead of candlestick specifically for clarity. This is the longest chart history on tradingview that could be found. It does not display everything as is. Where this cryptocurrency was previously traded, the exchanges deleted the entire trading history. Listing on new exchanges does not display the whole picture. I described and showed everything on the chart. More in the channel, screenshots and comparison with XRP, here the site does not provide an opportunity to make such a comparison, as there are simply no charts of such history.
Verge (XVG) like XRP identical chart of the main trend, and the same 8-year triangle after the pumping of 2017. The only difference is that XRP came out of its triangle half a year ago, in alt season #2 of this cycle, and this cryptocurrency is still in the canvas of its triangle. But the price is gradually being driven into a corner. In alt season #3, most likely, the denouement of this story lasting 8 years will occur. More up than down (at the beginning).
Verge (XVG), like XRP, is an asset of the super pump of 2017 and the price retention is -96-98% from the super pump by hundreds of thousands of percent (I am not mistaken exactly so), which forms a huge triangle on XXX (8 years). This is all inherent in the assets of the hype of 2017: XVG XRP NEM XLM ZEC XMR DASH LTC and so on ... Some of them, over the past 2 years, have become on the path of hype (XRP XLM), and some on the path of scam (I do not want to make anti-advertisement).
Most likely, everything will repeat on XVG, as on XRP, but only at the right time, in the final alt season of this cycle. "XVG captains" do not have as much money and a powerful state behind them as XRP, to go against the market and the general trend, therefore, they need the market hype to distribute "a little higher". And so with most of these altcoins. Do not forget to get rid of them on the pump. Remember, the more down-to-earth goals, the more likely you are to earn over the long term. Observe risk and money management.
Remember, there is a big alt season ahead, provided that you are an adequate person and your goals are appropriate.
USDJPY → Support retest. Is the trend continuing?FX:USDJPY is storming key support within the local downtrend. Pressure is intensifying the dollar's decline...
The dollar index is beginning to fall, which is also reflected in the currency pair.
Selling pressure is intensifying. A local downtrend is forming, with an attempt to break through key support at 144.82, below which the path to 143.4 - 142 opens up. Consolidation of the price below 144.82 could intensify the sell-off.
Resistance levels: 145.34, 146.07
Support levels: 144.82, 143.44, 142.35
Global and local trends are downward, and the fall of the dollar can only provide additional resistance, which will intensify the sell-off. A break of key support and consolidation of prices below 144.82 will trigger further sell-offs.
Best regards, R. Linda!

BITCOIN → Consolidation in a triangle amid a BULLISH TRENDBINANCE:BTCUSDT is consolidating. A symmetrical triangle is forming against the backdrop of a bullish trend. Given the current technical nuances, we can bet that this consolidation is forming with the aim of continuing growth...
Fundamental nuances have gradually improved over the past few weeks, and the cryptocurrency market has revived slightly. Technically, I like the market structure on D1. After strong growth, the price is not going to fall, consolidation is forming. The market is bullish, after 2-3 weeks of consolidation, a bullish distribution is forming. The cycle has repeated itself twice. On D1, you can see how long tails are forming downward within the consolidation, indicating that whales are buying up all attempts to fall, keeping the market away from risk zones. Accordingly, at the moment, I would say that consolidation may continue for some time, and I do not rule out an attempt to retest the triangle support before growth, or entry into a deeper zone to retest the distant liquidity zones of 101400 and 100700 before continuing growth.
Resistance levels: 103.6, 104.4, 105.0
Support levels: 102.5, 101.4, 100.6
A decline can be considered if the price breaks the triangle support and sticks to 101400, forming a pre-breakdown consolidation (if there is no upward rebound).
However, at the moment, intraday trading can be considered, i.e., from the consolidation boundaries. A signal to exit the consolidation upwards and continue growth will be consolidation between 103.5 and 105.0 and compression towards the upper boundary.
Best regards, R. Linda!

AUDCHF: More Growth Ahead 🇦🇺🇨🇭
AUDCHF strongly reacted to a rising trend line on a daily.
The price formed an ascending triangle pattern on a 4H time frame
and is now breaking its horizontal neckline.
I expect a bullish continuation to 0.540 / 0.543 levels.
❤️Please, support my work with like, thank you!❤️
I am part of Trade Nation's Influencer program and receive a monthly fee for using their TradingView charts in my analysis.

Euro can continue to decline in channel to buyer zoneHello traders, I want share with you my opinion about Euro. Earlier, the Euro formed a symmetrical triangle, where the price squeezed between resistance and support lines before breaking out with a strong impulse move. After this breakout, the pair quickly climbed toward the 1.1420 - 1.1455 resistance area, a major seller zone, but failed to hold above it. Since then, the price structure shifted into a well-defined downward channel. Within this channel, we’ve seen repeated rejections from the upper boundary and controlled declines toward the support line. Recently, EUR rebounded again from the resistance line, confirming that sellers remain in control. Now the price is heading lower once more. Given this repeated rejection and the prevailing bearish structure, I expect the decline to continue toward the next key area, the 1.1070 - 1.1035 buyer zone. This level aligns with the channel’s support and has acted as a reaction zone in the past. That’s why I set my TP at 1.1035, the bottom of the buyer zone and a logical target within this bearish setup. Please share this idea with your friends and click Boost 🚀
Disclaimer: As part of ThinkMarkets’ Influencer Program, I am sponsored to share and publish their charts in my analysis.

JINDALSTELNSE:JINDALSTEL
Note :
1. One should go long with a Stop Loss, below the Trendline or the Previous Swing Low.
2. Risk :Reward ratio should be minimum 1:2.
3. Plan your trade as per the Money Management and Risk Appetite.
Disclaimer :
>You are responsible for your profits and loss.
>The idea shared here is purely for Educational purpose.
>Follow back, for more ideas and their notifications on your email.
>Support and Like incase the idea works for you.

MarketBreakdown | GOLD, USDCAD, GBPNZD, GBPJPY
Here are the updates & outlook for multiple instruments in my watch list.
1️⃣ #GOLD #XAUUSD 4H time frame 🥇
I see some clear signs of bullish accumulation on intraday time frames.
The price formed an ascending triangle pattern.
Its neckline represents a significant resistance.
Its violation and a 4H candle close above will provide
a strong bullish confirmation signal.
A growth to higher structures will be expected then.
2️⃣ #USDCAD daily time frame 🇺🇸🇨🇦
Do not forget that today is the official banking holiday in Canada.
For that reason, CAD pairs might be slow.
USDCAD is currently consolidating within a narrow range on a daily.
I believe that for now, a consolidation is likely to continue.
3️⃣ #GBPNZD daily time frame 🇬🇧🇳🇿
The price successfully violated a falling trend line - a
strong vertical resistance last week.
We see a strong bullish reaction to that after its retest.
I believe that the pair will continue growing, it will likely
test a current high first and violate that, setting a new one then.
4️⃣ #GBPJPY daily time frame 🇬🇧🇯🇵
The pair is trading in a strong bullish trend on a daily.
The price is texting a significant support cluster at the moment,
probabilities will be high that a growth will resume from that.
Do you agree with my market breakdown?
❤️Please, support my work with like, thank you!❤️
I am part of Trade Nation's Influencer program and receive a monthly fee for using their TradingView charts in my analysis.

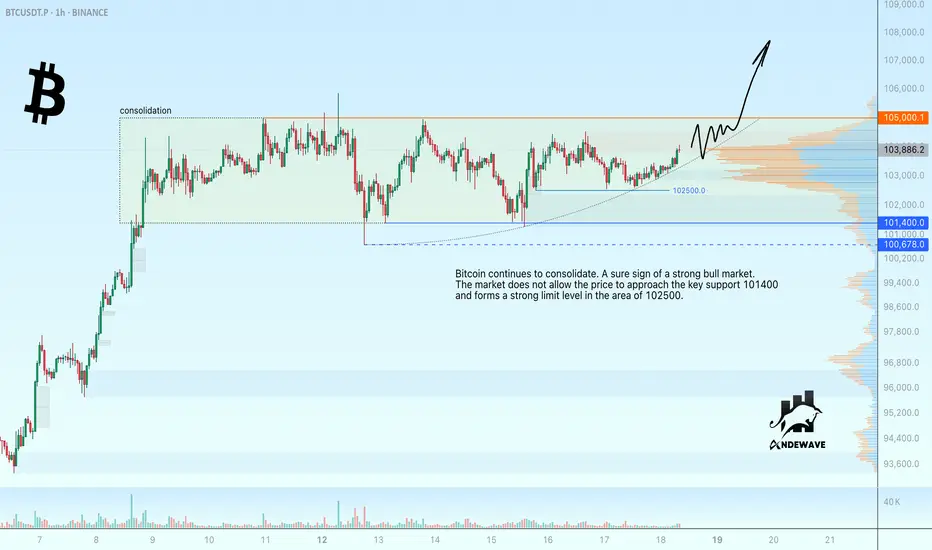
Bitcoin tests 105,000 with a view to breakout Bitcoin continues to consolidate. A sure sign of a strong bull market.
The market is not allowing the price to approach the key support 101400 and is forming a strong limit level in the 102500 area.
Scenario: I am waiting for a retest of 105000 resistance and if bitcoin remains consolidated above 103500 - 103800 and continues to test 105000, another retest of consolidation resistance could lead to a breakout and a rise towards ATH
An additional condition may be the consolidation of the price above 105000.
DOGE → Retest of the panic zone. One step away from a downtrendBINANCE:DOGEUSDT.P is facing selling pressure. After distribution (pump), the price enters a correction phase (dump) and storms the panic zone, a breakout of which could intensify an uncontrolled decline.
DOGEUSDT squandered all the potential accumulated in late April and early May. The distribution ended in the 0.2600 zone, after which the coin entered a correction phase. At the moment, the coin is testing the panic zone of 0.21400
All attention is on the base of the triangle at 0.21400. This is the panic zone. When the support breaks, buyers will be liquidated, and sellers may increase sales, which could trigger a bearish momentum.
Resistance levels: 0.222, 0.2307
Support levels: 0.2145, 0.2135
The main idea is a continuation of the decline. The trigger is a breakdown of support at 0.2135 and consolidation of the price below this zone, only in this case will the price continue to fall.
!!! The structure will be broken if the price reverses and consolidates above 0.222 and confirms the bullish sentiment with price consolidation above 0.23, in which case we will again consider growth.
Best regards, R. Linda!

Descending triangle in SilverMicLooks like SILVERMIC1! is forming descending triangle on chart.
A decisive break below 94000 mark can cause further downfall in the commodity.
In the start of April 2025, Silver fell drastically and recovered later. The rise was on the back of low relative volume which is not good for buyers.
Now it is rangebound and forming descending triangle on chart and taking support multiple times near the 94000 price zone but never closed below that level. Hence a decisive close
below the 94000 mark can cause further downfall and will be a good short opportunity. Fingers crossed!
