MAGIC Breaking Out – Next 100% Move on the Horizon?🚀 MAGIC Breakout Alert – 100% Potential Incoming?! 👀🔥
Hey Traders! If you're all about high-conviction plays and real alpha, smash that 👍 and tap Follow for more setups that actually deliver! 💹💯
MAGIC has finally broken out from a long-standing symmetrical triangle on the 4H chart — a classic bullish reversal pattern. After consolidating tightly, it's now flashing signs of a strong upward impulse! ⚡
📌 Entry: CMP ($0.200) and add more on dips up to $0.195
🎯 Targets: $0.25 / $0.29 / $0.33 / $0.39
🛑 Stoploss: Close below $0.176
⚙️ Leverage: 5x (Max)
✨ Previous breakout delivered over 100% gains — this one could be next!
Chart structure + volume looks perfect. If BTC stays calm, we might witness another explosive move in MAGIC.
💬 What are your thoughts on this setup? Drop your opinions below and don't forget to like & follow for more high-conviction trade setups! 💥
Triangle

ROKU Close to Key Support After the Selloff Roku fell after its earnings report and updated guidance. Despite reporting EPS that beat expectations by 27.14%, Roku lowered its revenue guidance to $4.55 billion, down from the previous estimate of $4.61 billion. However, the sharp decline in price may present a buying opportunity for a medium-term swing trade.
Roku’s EPS is expected to turn positive in the third quarter, supported by increasing revenue in each quarter. The 12-month analyst consensus price target is $83.76, which is approximately 38% above the current price.
From a technical perspective, an ascending triangle formation appears to be developing at the bottom. While ascending triangles are typically continuation patterns, and rarely form at bottoms, it is still a positive sign for Roku. The lower line of the channel, which is near the 52 level and aligned with key horizontal support, can be viewed as solid support. As long as this support holds, an upward move toward the 200-day SMA and then to the 82.50 level is possible.

GOLD → Retest resistance before fallingFX:XAUUSD is forming a correction and retesting a strong resistance and liquidity zone within a downtrend. The global trend is one step away from a reversal...
Gold stabilized ahead of the release of US inflation data. After falling 3%, gold is holding steady at around $3,200, consolidating against a weaker dollar. Investors are awaiting US CPI data, which could set a new direction.
Optimism about the US-China trade agreement, geopolitical détente, and profit-taking on the dollar are holding back the price decline. The market is assessing how inflation data will affect Fed policy and demand for safe-haven assets.
Globally, the market doubts that the upward trend will continue, and there are reasons to look for points from which the price could start to fall sharply...
Resistance levels: 3269, 3284
Support levels: 3246, 3200, 3167
The news may cause a shake-up, but if there are no surprises, a false breakout of 3260-3270 and consolidation of prices in the selling zone could trigger a decline to 3200-3150.
Best regards, R. Linda!

SUIUSDT → False breakdown of support before growthBINANCE:SUIUSDT has entered a consolidation phase within a bullish trend. The chart shows a zone of interest and a trigger area that are worth paying attention to...
The coin looks quite positive. An upward trend is forming, which is also supported by the growth of Bitcoin and a relatively positive fundamental background.
Technically, SUI is consolidating between 4.110 and 3.811. Below the support level, a huge liquidity pool has formed, which has not yet been tested. There is a high probability of a false breakdown before the growth continues, but if the market turns out to be more aggressive, buyers may not let the price fall to 3.811, in which case we can consider a breakout of the resistance at 4.11-4.275 and consolidation of the price above these levels with the aim of continuing growth.
Support levels: 3.811, 3.667
Resistance levels: 4.11, 4.275
The movement of Bitcoin shows that the market is gathering liquidity as part of a local correction against the backdrop of a bullish trend. Yesterday, we all witnessed a local liquidation, but there are no reasons for a decline yet. SUI, in an ideal scenario, may test support at 3.811 and form a false breakdown before continuing to grow.
Best regards, R. Linda!

AUDUSD: Bullish Move After Breakout 🇦🇺🇺🇸
AUDUSD broke and closed above a key horizontal resistance yesterday.
Retesting the broken structure, the price formed a tiny ascending
triangle pattern on an hourly time frame.
I expect a bullish continuation now.
Goal - 0.6492
❤️Please, support my work with like, thank you!❤️
I am part of Trade Nation's Influencer program and receive a monthly fee for using their TradingView charts in my analysis.

Nasdaq-100 Wave Analysis – 13 May 2025- Nasdaq-100 broke resistance area
- Likely to rise to resistance level 21500.00
Nasdaq-100 index recently broke the resistance area between the resistance level 20220.00 (which has been reversing the index from March) and the resistance trendline of the Ascending Triangle from April.
The breakout of this resistance area accelerated the active short-term ABC correction 2 from last month.
Nasdaq-100 index can be expected to rise to the next resistance level 21500.00 (target price for the completion of the active wave 2).

Bullish BO of a descending channel and triangleJD has been pulling back for quite a while, and has just recently broken from the descending channel, after touching a higher TF dynamic support level, reacting from it and today with volume, obviously, every trade has their risks, plus tomorrow is it's earnings release so keeping that in mind... Need to act quickly if investors don't like the results and actually pull the market back down, however, it could go positively and allow us to capitalize on the uptrend as well.
So it is a slight risky trade, however, never invest the whole lot in one go, and accumulate as the price allows you to do it!

Gold outlook: inflation, tariffs, and the key level to watchI'm long-term bullish on gold. With Trump pushing for 10% tariffs across the board, inflation risks are rising. Add tax cuts and already low unemployment, and you have a recipe for more upside. But why is there a risk that the price drops first, before heading higher? Watch the video to learn.
This content is not directed to residents of the EU or UK. Any opinions, news, research, analyses, prices or other information contained on this website is provided as general market commentary and does not constitute investment advice. ThinkMarkets will not accept liability for any loss or damage including, without limitation, to any loss of profit which may arise directly or indirectly from use of or reliance on such information.

CAKE is retestingAfter a successful breakout of triangle pattern from the top side, CAKE is now going to retest the resistance line.
So far so good.
Golden long is coming soon ...
-------------------------------------
Share and follow me for further analyses.

Ethereum Is Quietly Preparing for a Massive Move !Hello Traders 🐺
In this idea, I want to show you one of the coolest charts I’ve ever seen in my life — seriously!
These kinds of patterns, especially on the monthly time frame, take multiple years to form, and that’s exactly why they are extremely valid. When a structure develops on higher time frames, we can rely on it more confidently and make smarter decisions 📊
As you can see on the chart, ETH price is moving inside a very clear ascending channel, and its reactions to the channel lines are simply beautiful. Let’s take a closer look:
In addition to the top and bottom of the channel, we also have a “make or break” level, shown by the blue dotted line (which is the middle line of the channel).
Price reactions to this line throughout different time periods have been amazing. And here's the more interesting part:
👉 Price is currently above the middle line, and on its way up, it’s approaching one of the most critical resistance levels — the orange descending trendline.
If we zoom out, we’ll see that ETH is actually squeezed between this descending resistance and the ascending channel's middle line, forming a beautiful triangle 🔺
If ETH can break above this triangle, we could see a massive surge, possibly taking price all the way up to the top of the channel, which in my opinion is somewhere around $15,000 🚀
Now let’s talk about RSI:
If you take a closer look at the RSI below the chart, you’ll notice a repetitive pattern.
Each time ETH enters a major bull run or makes a new all-time high, RSI touches the upper resistance in the overbought zone.
We’re still in the early stage of this cycle — and both technically and indicator-wise, there seems to be plenty of room to grow.
Hope you enjoy this idea — I’ll be happy to answer your questions in the comments below 👇
And as always, remember our golden rule:
🐺 Discipline is rarely enjoyable, but almost always profitable 🐺
🐺 KIU_COIN 🐺

EPT/USDT Breakout Alert – Triangle Resolved, Targets Set!🚀 EPT Breakout Alert – 100% Potential Incoming?! 👀🔥
Hey Traders! If you're all about high-conviction plays and real alpha, smash that 👍 and tap Follow for more setups that actually deliver! 💹💯
EPT has just broken out from a symmetrical triangle on the 2H chart, indicating the start of a potential bullish wave. After weeks of consolidation, this breakout looks strong and is supported by increasing momentum.
📌 Entry: Current Market Price (CMP) – $0.0110
📉 Add More on Dip: Down to $0.0104
🎯 Targets:
TP1: $0.0138
TP2: $0.0165
TP3: $0.0194
TP4: $0.0223
🛑 Stop Loss: $0.0092
⚙️ Leverage (Optional): 3x–5x
A clean structure, breakout confirmation, and tight invalidation level make this setup attractive for short-to-mid-term swing traders.
💬 What do you think about this move? Are you in? Drop your thoughts below!

GOLD - Price can break support level and continue to declineHi guys, this is my overview for XAUUSD, feel free to check it and write your feedback in comments👊
Recently price entered to triangle, where it at once bounced from support line, which coincided with support level.
Price rose to resistance line, breaking $3400 level, but soon turned around and dropped below, breaking this level again.
Next, Gold made a gap and continued to fall in a triangle, and later it reached $3215 level, after which bounced up.
Then price exited from triangle, rose to $3400 level and made fake breakout, after which started to decline in falling channel.
In channel, price fell to $3215 level, where at the moment continued to trades close and trying to break this level.
I think Gold can break this level and continue to fall in a falling channel to $3140
If this post is useful to you, you can support me with like/boost and advice in comments❤️

How to manage an entry in AvaxA few days ago we covered an entry in AVAX. The entry was triggered, and in this video we show how the stop could have been managed and what to watch next.
This content is not directed to residents of the EU or UK. Any opinions, news, research, analyses, prices or other information contained on this website is provided as general market commentary and does not constitute investment advice. ThinkMarkets will not accept liability for any loss or damage including, without limitation, to any loss of profit which may arise directly or indirectly from use of or reliance on such information.

VIRTUALUSDT can derail support with momentumVIRTUAL is consolidating after the rally, but it cannot continue its growth yet. A descending triangle with a clear base support and a fourth retest relative to 1.877 is being formed, which in general only increases the chances of support breakout and decline
Scenario: if the compression of this format (within the descending triangle) continues and the price continues to compress to the support at 1.877, then in this case it will be possible to catch a breakout through a limit order. A sharp impulse is possible. As the first target I will wait for a decline to 0.5 fibo (1.73)

EURJPY → Storming the resistance. Ready for the rallyFX:EURJPY is rising amid a stronger dollar and positive news about the de-escalation of the trade war. The currency pair is storming the resistance of the range.
The currency pair is forming a retest of resistance. A breakout and consolidation above 164.19 - 164.50 could support the market amid the dollar's growth.
The dollar is strengthening after positive news related to the de-escalation of the trade war. Against this backdrop, the Japanese yen is losing ground, which is generally affecting EURJPY.
A move above the key level will confirm a breakout of the resistance of consolidation, which could trigger a distribution phase...
Resistance levels: 164.19, 166.7
Support levels: 163.15, 162.38
The price has already entered the buying zone, meaning that resistance has been broken. All that remains is to wait for confirmation that the bulls are ready... Consolidation above 164.19 - 164.5 will confirm this, and in that case, we can expect distribution towards 166.7.
Best regards, R. Linda!

BITCOIN → Consolidation before the rally. 106K - 110K?BINANCE:BTCUSDT , after breaking out of consolidation at 97,860 and distributing to 104,300, has returned to a consolidation phase, which is generally a positive sign for possible continued growth.
The growth of Bitcoin is linked to several reasons:
General improvement in the global market situation — easing of trade conflicts; Expectations of a US Fed rate cut; Influx of investment into Bitcoin ETFs
Technically , we see the price breaking out of its local downtrend and entering a strong distribution phase. The northern train continues to pick up passengers.
At this stage, I would like to draw your attention to the consolidation at 104300 - 102300. A rebound from resistance is currently forming, and we need to monitor the levels of 103300 - 102300 - 101700. These are quite important areas of interest. A false breakdown (liquidity capture) may form before further growth. A return to resistance and the formation of pre-breakout consolidation, for example between 104300 and 103300, will only increase the chances of a breakout of resistance and growth to 106-107K.
Resistance levels: 104300
Support levels: 103300, 102300, 101700
The trend is bullish, with Bitcoin consolidating. The coin is not going to fall (at the moment), but to build up potential, the price may form a false breakdown of support (a deceptive maneuver) before continuing to rise. Retesting the 104300 level could lead to a breakout and upward distribution.
Best regards, R. Linda!

WCT Breakout Confirmed – Ready for Lift-Off?🚀 WCT Breakout Alert – 80% Potential Incoming?! 👀🔥
Hey Traders! If you're all about high-conviction plays and real alpha, smash that 👍 and tap Follow for more setups that actually deliver! 💹💯
WCT has finally broken out of its long-standing symmetrical triangle on the 4H timeframe 🔥. After weeks of consolidation, we’re seeing a fresh move building up, hinting at strong momentum ahead.
🔎 Chart Insights:
✅ Breakout above resistance zone ✔️
📈 Retest happening around the breakout zone ✔️
📊 Previous pump: 81% surge! Will history repeat?
Trade Idea:
Entry: Current Market Price (CMP) and add more in dip
Targets: $0.44/$0.48 / $0.56 / $0.68 🎯
Stop Loss: $0.35 🚨
Lev: Use low leverage (Max 5x)
The chart looks clean with solid structure—keep an eye as this can build up for a big move 💥.
💬 What’s your take? Drop your analysis or ride along with this setup!

BITCOIN - Price can correct to support line of rising channelHi guys, this is my overview for BTCUSDT, feel free to check it and write your feedback in comments👊
Some days ago, the price entered a triangle, where it dropped to the support line, after which it rose briefly to the resistance line.
Then, price exited from the triangle pattern and made a retest at once, after which it corrected $81500 level.
Next, price some time traded near this level and later fell below, but soon turned around and started to grow inside a rising channel.
In channel BTC broke the $81500 level and later rose to the $93000 level, which broke soon too, and then made a retest.
Later price bounced and continued to grow, and now it trades near the resistance line of a rising channel.
Possibly, BTC can grow a little more and then make a correction movement to $99000
If this post is useful to you, you can support me with like/boost and advice in comments❤️

Ethereum (ETH) XABCD Pattern – $3,000 Target Ahead?ETHUSDT is at $1,759 and we’ve got an XABCD harmonic pattern in play!
▸ From $1,516 (X) to $4,147 (A), then slow retracement to $2,120 (B), then a big spike to $4,120 (C), and crash to $1,385 (D).
▸ Now, the chart is eyeing $3,000 as the next big target!
▸ Watch $2,100 and $2,500 as resistance on the way up. $1,500 is key support – let’s see if it holds!
✉️ What’s your take?
Will ETH hit $3,000, or are we dipping first? Drop your thoughts! ⬇️

Gold 8H – Probable Scenario Until the End of May 2025Briefly today!
Greetings, let’s take a look at the current situation for gold.
Technically, we can see a classic symmetrical triangle forming on the 8-hour chart, with a support zone established in the 3291–3300 range.
I'm expecting a move towards the 3440–3450 area, followed by a retest and an upward push toward the 3833 level.
Fundamentally, we take into account Trump's policy stance and the ongoing conflict between Pakistan and India.

SUI Elliott Wave Meets Fibonacci: Wave 5 Setup ExplainedSUI has once again delivered a textbook display of wave structure, Fibonacci precision, and anchored VWAP interaction. After finishing Wave 4, price surged upward, tagging key fib levels and now consolidating at a critical decision point. The next high-probability trade opportunity is forming — and it’s one worth watching closely.
📈 Recap of the Current Move
After completing Wave 4, SUI surged right into the golden pocket — the 0.618 Fibonacci retracement of the entire 90-day downtrend (measured from the $5.3687 high to the $1.7174 low). That golden 0.618 sits at $3.9739, with price currently hovering just below at around $3.965.
In our previous analysis, we noted SUI’s tendency to respect trend-based Fib extensions. That pattern is holding beautifully.
Projecting from Wave 1 to Wave 2 of the current impulse wave, price once again nailed the 2.618 Fib extension — at exactly $4.10. That extension aligned perfectly with the 0.65 retracement of the 90-day wave at $4.0907, forming a significant resistance confluence.
2.618-1.618 fib:
The result? A healthy ~7% rejection, pulling SUI back into a support zone formed by three previously broken swing highs — $3.875, $3.8121, and $3.7666 — now acting as support.
🔺 Wave 4 Structure: Triangle Formation & Key Retest Levels
SUI has now been consolidating for ~1.5 days, and price structure shows a developing triangle — a classic Elliott Wave Wave 4 pattern.
But while triangles often resolve higher, we can’t ignore the Fibonacci roadmap:
The 1.618 trend-based Fib extension (drawn from Wave 1 → Wave 2) sits at $3.7619.
This level aligns almost perfectly with the key swing high at $3.7666.
In the previous Wave 3–4 sequence, price also retested the 1.618 extension — a pattern that could repeat now again.
So, despite the bullish triangle breakout potential, there’s still a high likelihood that price dips slightly to retest the 1.618 Fib zone at $3.76–$3.77.
📊 Anchored VWAP Confluence: Even More Support
To further strengthen this thesis, we’ve anchored VWAP from the recent swing low at $3.12. That VWAP (yellow line) now sits at $3.745 — just beneath the 1.618 Fib and in perfect confluence with the swing high cluster.
This creates a tight demand pocket between $3.74 and $3.77, where four technical tools align:
→ 1.618 trend-based Fib extension
→ Anchored VWAP from $3.12
→ Broken swing highs now acting as support
→ 0.382 Fib Retracement of Wave 3
This is where smart money looks to accumulate — not at the top of the triangle, but where liquidity gets transferred.
🧠 Outsmarting the Crowd: Trap & Trigger
Many breakout traders are positioning within the triangle, with stop-losses just beneath. If price dips into the $3.74–$3.77 range, it would sweep those stops and fill orders from traders waiting patiently at this confluence.
This creates a classic “switching hands” moment: breakout longs are stopped out, and Fibonacci-aligned buyers step in just as price hits the sweet spot.
To be part of the 1% in trading, you need to be thinking one step ahead — not where price is now, but where it needs to go to trap the many and reward the few.
🎯 Long Trade Setup
Entry Zone:
$3.77 preferred
Laddered from $3.76–$3.74
Stop-Loss Options:
Tight: Below $3.70 (2% buffer)
Loose: Below $3.52 (golden pocket of previous Wave 3)
Targets:
Conservative: $4.28
Primary: $4.41
Aggressive Extension: $4.5873 (0.786 retracement of full 90-day move)
R:R Potential:
Tight SL: ~2.5:1
Loose SL: 6:1+
📆 Weekend Trading Note
We’re currently in weekend session flow — often thinner liquidity and more prone to wicks. While the structure is strong, wait for confirmation and avoid FOMO entries at the top of the triangle.
✅ Wrapping It Up
SUI remains in a clean, bullish market structure and continues to respect Fibonacci and trend-based extensions to the letter. With price above key swing highs, holding structure, and anchored VWAP adding confluence, the $3.74–$3.77 zone is setting up as a high-probability entry for the next wave.
Smart money doesn’t chase — it anticipates. Be the 1% who sees beyond the triangle and understands where the real opportunity lies.
Happy Trading!
___________________________________
If you found this helpful, leave a like and comment below! Got requests for the next technical analysis? Let me know.

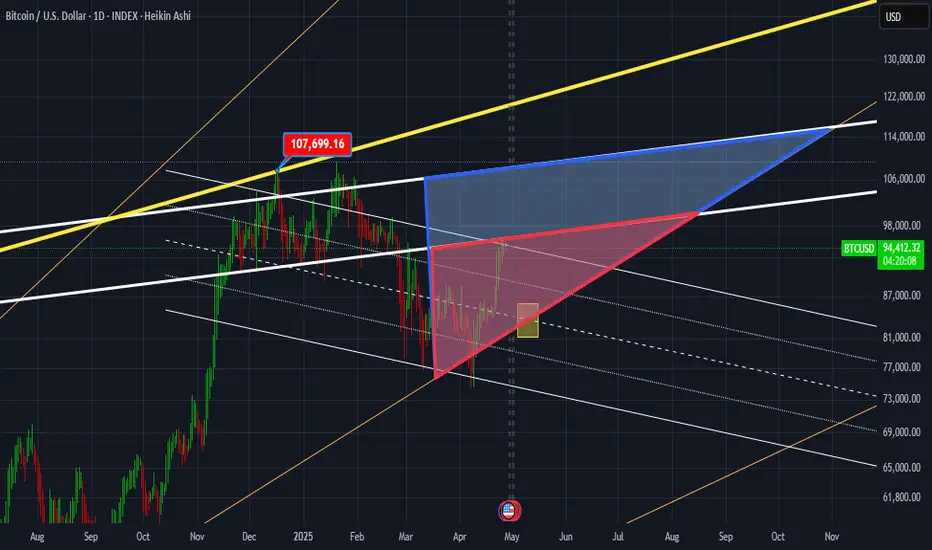
BTC in Bermuda triangle!I love shapes. Shapes have a rich and deep philosophy and give you an idea of what's going on in the mind of market's major players. BTC is no longer an infant, in fact, just like you, it's getting older and older everyday! "Now" the market movements are far beyond simple pump and dumps. No more slides in the park for baby bitcoin! Watch the small red triangle and the big blue one. The lovely yellow rectangle waves hands!
Will $cake blove minds?The NASDAQ:CAKE , which is the official token of the most familiar decentralized exchange on BSC (Pancakeswap), is now broke the symmetric triangle on its USDT chart from the top side. Taking into account exciting fundamental news about launching Pancakeswap V4 in a couple of weeks, I think it will reach higher price levels.
My golden target level is: $6
