STOCK NAME { RAINBOW } SWING TRADEtake trade when nifty turns bullish swing trade perfect symmetrical triangle short term opportunity for upside take trade after breakout from the trendline according to own risk this is not call just a analysis.
Trianglebreak

STOCK NAME { TAJ GVK HOTEL} SWING TRADEtake trade when nifty turns bullish swing trade perfect symmetrical triangle short term opportunity for upside take trade after breakout from the trendline according to own risk this is not call just a analysis.

XAUUSD CONSOLIDATION CHANNELThe 1970s is the peak of the consolidation triangle. Serious concerns about the rate hikes due to OPEC+ output cuts might drive the precious metal price to new highs in the 2050s - 2100s range from March 22. Gold remains the safe bet for inflation, economical instability, and war, currently, we are living in a combination set of all mentioned.
Risk Disclosure: Trading Foreign Exchange (Forex) and Contracts of Difference (CFD's) carries a high level of risk. By registering and signing up, any client affirms their understanding of their own personal accountability for all transactions performed within their account and recognizes the risks associated with trading on such markets and on such sites. Furthermore, one understands that the company carries zero influence over transactions, markets, and trading signals, therefore, cannot be held liable nor guarantee any profits or losses.

FTM trading inside of a Triangle The price of an asset moves within a narrowing range over time, forming a shape that resembles a triangle. Given the possibility of a breakout in either direction, one trading strategy is to wait for a clear break of the triangle pattern in either direction before entering a position. This could be done by setting up buy and sell orders on both sides of the triangle, with stops and limits placed accordingly to manage risk.
It's worth noting that trading within a triangle pattern can be risky, as there's no guarantee that the breakout will occur in either direction or that it will be sustained. Therefore, traders should use proper risk management techniques and be prepared to adjust their positions quickly if the market conditions change.

DOTUSDTAssalamualikum everyone i hope all is well
Market is going to bearish but dotusdt break triangle pattern.
so according to technical analysis market will be going up.
there are some reason for taking this trade
* break triangle pattern.
** market retest triangle line.
**************GUD LUCK******************

USDCAD: Strong Buying ZoneThe USDCAD has successfully broken out of a triangle pattern and also breached a local resistance line at 1.375, but it faced strong rejection after the break. It seems that the price will undergo a correction towards the last support level at 1.375 or even down to 1.370, which I consider a strong and ideal buying zone for the price to continue its upward move towards 1.385.
-------------------------------------------------------------------------
Let me know your thoughts in the comments, and show your support by liking the idea.
Please follow if you're interested in more ideas like this.
Your support is greatly appreciated!

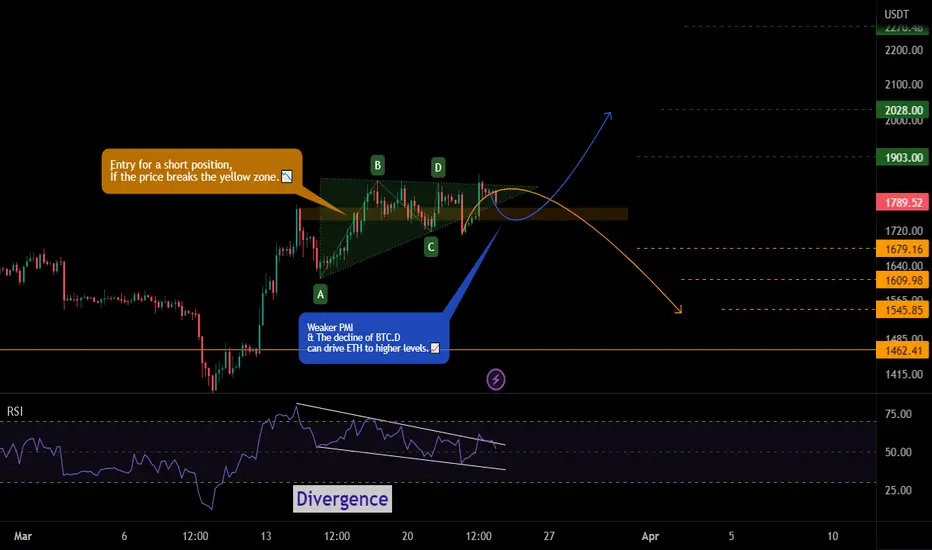
📈ETH analysis near release of PMI data📉BINANCE:ETHUSDT
COINBASE:ETHUSD
Hey everyone, first take a look at my previous analysis and positions.
For long targets & short trades, targets are on the chart.
Don't forget to risk-free your position.
Please share ideas and leave a comment,
let me know what's your idea.
CrazyS✌
USD/CAD: a familiar pattern formed. Time to drop?As it can be inferred from the graph, the price has formed a nice descending channel pattern and is on the verge of breaking the lower boundary of it. If a breakout happens, we will see an impulsive drop. However, we are expecting for a one more re-touch of the descending trendline of the triangle before a full-scale “jump off the cliff” mission can be commenced.

USDJPY Maybe a Triangle? 16.03.2023USDJPY has entered in to a consolidated state and it looks like is forming
a triangle.
Looking forward for a triangle breach downwards instead of upwards.
If it breaks upwards there are too many resistance points that might slowdown
the momentum.
Breaking downwards has more potential for a rapid drop.
__________________________
Information Regarding Important News and Figures can be found here in our Economic Calendar: mau.bdswiss.com/economic-calenda...
Risk Warning: Trading in CFDs is highly speculative and carries a high level of risk. It is possible to lose all of your invested capital. These products may not be suitable for everyone, and you should ensure that you fully understand the risks taking into consideration your investment objectives, level of experience, personal circumstances as well as personal resources. Speculate only with funds that you can afford to lose. Seek independent advice if necessary. Please refer to our Risk Disclosure.
BDSwiss is a trading name of BDS Markets and BDS Ltd.
BDS Markets is a company incorporated under the laws of the Republic of Mauritius and is authorized and regulated by the Financial Services Commission of Mauritius ( FSC ) under license number C116016172, address: 6th Floor, Tower 1, Nexteracom Building 72201 Ebene.
BDS Ltd is authorized and regulated by the Financial Services Authority Seychelles (FSA) under license number SD047, address: Tenancy 10, Marina House, Eden Island, Mahe. Payment transactions are managed by BDS Markets (Registration number: 143350).

USDCAD - Broken Resistance Becomes Support !The USDCAD Price Reached a daily Resistance Level !
Currently, the Price is in Strong Support Level (Broken Resistance) and he is testing a support line !
I Expect a Bullish Move 📈
i'm waiting for a confirmation...
TARGET: 1.38250🎯
...
if you agreed with this IDEA, please leave a LIKE, SUBSCRIBE or COMMENT!

{ SAKSOFT } SWING TRADEtake trade when nifty turns bullish swing trade perfect symmetrical triangle short term opportunity for upside take trade after breakout from the trendline according to own risk this is not call just a analysis.

{ NELCAST } SWING TRADE take trade when nifty turns bullish swing trade perfect symmetrical triangle short term opportunity for upside take trade after breakout from the trendline according to own risk this is not call just a analysis.

{ MOLD TEK } SWING TRADEswing trade perfect symmetrical triangle short term opportunity for upside take trade after breakout from the trendline according to own risk this is not call just a analysis.

Bitcoin at Triangle Pattern #Bitcoin 1hr. #TA at @binance
Right now as per 1 hour chart #BTC movement is slowly following #TrianglePattern and pattern will break soon on 13th March at 5:30 AM with 80% chance to Downtrend but 20% chance to $21.5k Can also retest..!

EURCHF Triangle Breach? 07.03.2023The pair seems to have broken a triangle upper limit.
The next resistance estimated to be 0.9965.
__________________________
Information Regarding Important News and Figures can be found here in our Economic Calendar: mau.bdswiss.com/economic-calenda...
Risk Warning: Trading in CFDs is highly speculative and carries a high level of risk. It is possible to lose all of your invested capital. These products may not be suitable for everyone, and you should ensure that you fully understand the risks taking into consideration your investment objectives, level of experience, personal circumstances as well as personal resources. Speculate only with funds that you can afford to lose. Seek independent advice if necessary. Please refer to our Risk Disclosure.
BDSwiss is a trading name of BDS Markets and BDS Ltd.
BDS Markets is a company incorporated under the laws of the Republic of Mauritius and is authorized and regulated by the Financial Services Commission of Mauritius ( FSC ) under license number C116016172, address: 6th Floor, Tower 1, Nexteracom Building 72201 Ebene.
BDS Ltd is authorized and regulated by the Financial Services Authority Seychelles (FSA) under license number SD047, address: Tenancy 10, Marina House, Eden Island, Mahe. Payment transactions are managed by BDS Markets (Registration number: 143350).

DAX/GERMAN40 BEARISH SCENARIOOver the past week, inflation data and rate expectations have remained at the leading position of risk sentiment, adding pressure to stocks. With the Core inflation rate in the Euro area rising to a fresh record high of 5.6%, market participants shifted their focus to the European Central Bank and the hawkish repricing of higher rates. On the 4H chart, we have a big triangle formation and we are looking for price action around 15800-15850.
From this resistance area, we can be looking forward to selling confirmation.
Risk Disclosure: Trading Foreign Exchange (Forex) and Contracts of Difference (CFD's) carries a high level of risk. By registering and signing up, any client affirms their understanding of their own personal accountability for all transactions performed within their account and recognizes the risks associated with trading on such markets and on such sites. Furthermore, one understands that the company carries zero influence over transactions, markets, and trading signals, therefore, cannot be held liable nor guarantee any profits or losses.

USD/CAD: a potential build-up for a 100-pip dropLooking at the 2D timeframe chart of USD/CAD, we may observe that a descending triangle pattern has been formed and that the price has successfully broken the upper boundary (the descending trendline) of it. Using the Fibonacci retracement tool, we might identify that the 38.2% key Fibonacci level nicely lines up with a crucial area of previous resistance that now acts as support that is identified on the graph.
We are expecting for the price to continue its short-term bearish movements and reach the price level highlighted on the graphic. From there, due to the fact that our bias remains bullish, we will possibly look into executing long positions and riding the next up-trending wave.

{ GREAVES COTTON } SWING TRADEswing trade perfect symmetrical triangle short term opportunity for upside take trade after breakout from the trendline according to own risk this is not call just a analysis.

STOCK NAME { EVEREST IND } SWING TRADEswing trade perfect symmetrical triangle short term opportunity for upside take trade after breakout from the trendline according to own risk this is not call just a analysis.

GBPJPYA fast descending drive with a triangle correction.
If this triangle is broken down, it can create another downward kinetic wave.

FET/USDT Soon to break from triangle?This is how i would trade FET/USDT. The chart shows that the price movement occurs within a bullish triangle.
Enter a long position when/if the price out of the triangle to the upside.
--------------------
Targets:
1: 0.47
2: 0.5
3: 0.52
4: 0.55
5: 0.57
6: 0.59
Trade safely!
--------------------
About Fetch.ai:
"Fetch.ai is an AI-backed blockchain environment that helps users create a decentralized digital economy within a single ledger. Users can create agents that act on the behalf of individuals, organizations, devices, and services. All these agents are connected and can make transactions and communicate with one another." Source: kriptomat.io

Short on TataMotors (Triangle Pattern) SL-451Triangle Pattern Formation in Tata Motors .... But Still Wait For Close of Candle Below Trend line
SL will be Around 451.....Agressive Traders can jump in now....

BANK NIFTY ANALYSIS - 27/02/2023Sorry In Chart i was forgotten to change the date 24th to 27th...
Buy Above - 39980
SL - 39900
Targets - 40040,40140,40350,40530
Sell Below - 39820
SL - 39900
Targets - 39700,39600,39400,39200
Trade Safe & Happy Trading Guys
This is only for educational purpose so TAKE YOUR OWN RISK REWARD
