jubfoodJubfood made triangle on hourly charts with above average volumes.
Could be bought with mentioned stoploss & target.
Trianglebreak

ELON breaking triangle will fly 300%#ELON/USDT
$ELON pumped today and try to break out from triangle pattern.
🐮 if price going to close above descending resistance it will have potential to increase 300%.

Cardano to 0.78Hello Traders!!
That is my new idea:
ADA is looking bearish at mid term with target 0.78
I will consider to enter a short position in ADAUSDT due to the following reasons:
-Ema 21 is crossing 55 in daily time frame
-Broke 1$ support last week
-Formed a bullish triangle in 4h time frame, it broke the lower triangle(bearish sign).
-Now the price is currently retesting the lower trend line, this points out a great entry point.
Procedure :
Entry now at 0.95
Stop order at 0.972 or 0.985
Targets 0.913 | 0.864 | 0.781
I will be glad to see what do you think in the comments.
Regards.
I express only my opinion, do always your own research before risking your capital.
This is not a financial advice.

EUR/NZD BREAK ABOVE THE TRIANGLE AND TOUCH 200EMAOn Friday, EUR/NZD traded slightly higher after hitting support at the 1.5845 barriers. However, the advance continued somewhat today as well. It remained limited near the 200-EMA after the price break through the upper triangle line and the 1.6075 key resistance zone, which stopped the rate from drifting further north on Thursday and back on March 31st. The traders prefer to wait for a break above 1.6075 before getting confident about further advances, but they are looking for a potential upside movement after the triangle break.
Such a break will confirm a forthcoming higher high on the 4-hour chart and may pave the way towards the 1.6330 zone. The bulls may decide to take a break after testing that zone, thereby allowing the rate to correct lower. However, if they are willing to recharge, the investors would expect the forthcoming positive wave to overcome the 1.6330 zone, and perhaps extend towards the 1.6775 territories or higher to 1.7164.
Our short-term oscillators see that the RSI is above 50 but has just ticked down, while the MACD stands slightly above both its zero and trigger lines. Both indicators detect positive speed, supporting further advances, but the fact that the RSI ticked down makes us care that a small retreat may be on the cards before the next leg north.
To start examining the bearish case, the traders would like to see a fake breakthrough of the triangle and an apparent dip below 1.6000. The bears may initially target the 1.5711 zone. Another break below that zone or 1.5620 would confirm a forthcoming lower low on the daily chart and perhaps aim for the 1.5500 zone.
Risk Disclosure: Trading Foreign Exchange (Forex) and Contracts of Difference (CFD's) carry a high-risk level. By registering and signing up, any client affirms their understanding of their own personal accountability for all transactions performed within their account and recognizes the risks associated with trading on such markets and such sites. Furthermore, one understands that the company carries zero influence over transactions, needs, and trading signals. Therefore, it cannot be held liable nor guarantee any profits or losses.

Cult Dao - I'm still bullish! Here's why?Traders,
Are we late to the party on this one? Mmmm... I don't think so. In fact, as many of you already know, I entered into this trade yesterday. I'll explain in this video my rationale as well as cover 3 additional technical factors that caused me to make my decision.
⛓️ 🔗 Useful Links 🔗 ⛓️
(see below)

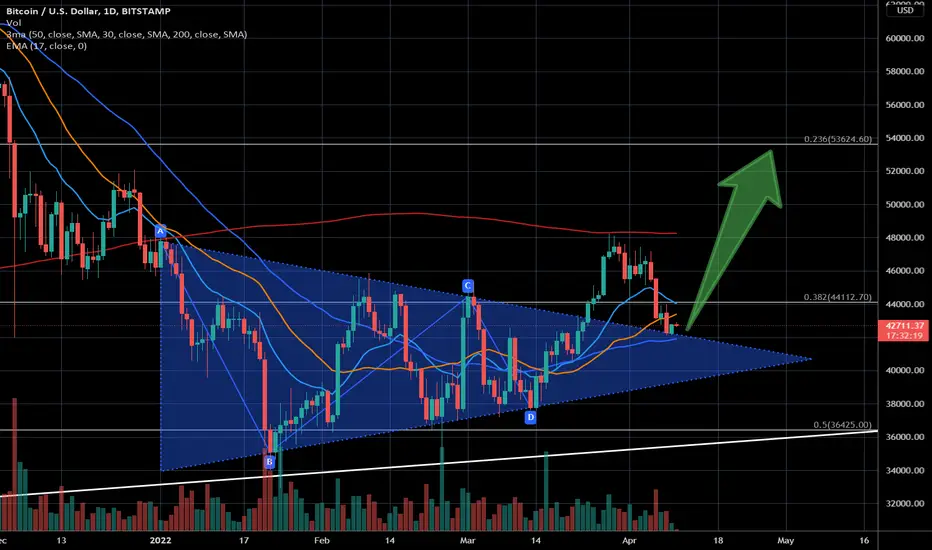
Pure technical analysis quick and simple 📈Looks like we can open the bullish case.
Triangle formation has broken to the upper side
Re-Test of the triangle on the upside on Friday
Price above still above the 50 SMA
Short-term MAs are bullish aligned (17 EMA > 30 SMA > 50 SMA)
Could be a nice long setup. Valid on the daily and weekly timeframe. If the price drifts further down, I would see this setup invalidated.

divislabdivislab made triangle pattern & broke out of it with decent volumes on an hourly charts.
could be bought with mentioned stoploss & targets.

BTC - ON THE RAZOR'S EDGE !!!WEEKLY (W1)
The last weekly closing was @ 39'691, just below the bottom of the weekly clouds support area !!!
As already mentioned several time the CLOUDS SHOULD NEVER BE UNDERESTIMATED on both sides, either on the UPSIDE as a RESISTANCE area and on the DOWNSIDE as a SUPPORT area.
Therefore, ongoing price action which will take place this week will be very important to monitor very closely and most important its weekly closing which will either validate or invalidate this downside breakout, which if confirmed will put the focus on lower levels.
DAILY (D1)
TRIANGLE PATTERN , in progress to breakdown (wait for the first confirmation of today's closing - target 37'235, ahead of the primary uptrend support line, currently @ 36'379.
RSI should be watch also closely as there is potentially a BULLISH DIVERGENCE in progress too !!!
LAGGING LINE is also attempting to cross under the daily clouds bottom level.
In order to invalidate this triangle pattern, the BTC should at least, firstly recover and hold on a daily closing basis above 39'750 and secondly, quickly reenter in the clouds area.
4 HOURS (H4)
As for D1, watch closely RSI price action and especially next H4 closing which, potentially, may trigger a RSI bullish divergence.
1 HOUR (H1)
No RSI bullish divergence detected yet ; for the time being this indicator is still converging to the downside, meaning that any reversal should be seen as a corrective move only.
As already mentioned in D1, a recovery above 39'750 in this hourly time frame would, temporary, neutralise the ongoing downside risk
Your comments are welcome.
Have a nice week and all the best
IRONMAN8848 - Jean-Pierre Burki

NZDUSD - Descending TriangleAlthough I'm waiting for my Bearish Shark Pattern on both 4-hourly and Daily Chart. I am more interested to wait for a shorting opportunity in this descending triangle setup.
Either a retest of the descending trendline or a break and close below the support line could be a sign for me to get involved in this shorting opportunity.
With that said, rules of filter and candle formation is just as important.

BTC exploding soonEMA 25 has been strongly considered as support and resistance in bitcoin(4 hour chart) and currently it is acting as a support for bitcoin in 4 hour chart .
after correction i btc is going to be above 45000$ soon .. Don't take too much leverage as whlaes will try to liquidate your trade ..
Take a proper leverage upto 10x ..Thankyou

EURAUD Triangle Breakout higher probability for a SHORTTriangle Breakout will probably see a fake breakout to the upside on 4HR chart then will proceed to breakout short for the higher probability. Targets and SL are noted on the chart for either way. Remember to trade on the third candle after breakout on 4HR TF. Good Luck!

SHIB/USDT : Moving into a triangle !BINANCE:SHIBUSDT
Hello everyone 😃
Before we start to discuss, I'll be so glad if you share your opinion on this post's comment section and hit the like button if you enjoyed it !
SHIB has formed a symmetrical triangle and now it's moving near to the higher trendline.
Despite of that it's reaching near to the apex of the pattern; There're few possibilities to look for !
- Bullish case; If we get the breakout above the pattern and hold above S/R zone ( mentioned Grey zone ), Then we can aim for $0.00003432 and $0.00004230.
- Bearish case; If we get the rejection below the pattern and hold below S/R line ( mentioned Green line ), Then we can aim for $0.00001866 and $0.00001514.
Hope you enjoyed the content I created, You can support us with your likes and comments !
Attention: this isn't financial advice we are just trying to help people on their own vision.
Have a good day!
@Helical_Trades

BANKNIFTYBanknifty broke out of triangle pattern on smaller time frame charts.
Could be bought with mentioned stoploss & target.

BTCUSD Ascending TriangleBitcoin continues to make a push to the upside meanwhile price action continues to trade within an ascending triangle. Typically, this is a continuation pattern to the downsize although there can be many fakeouts in the market place. Play both sides of the market here with shorts or longs on the break of the triangle!

KCSUSDT is ready to explode?On the daily timeframe, the price is testing the upper trendline of the big pennant, exactly 19.5$ on 0.618 Fibonacci level and the price is going to create a Cup and handle as well.
On the 4h Timeframe the price had a rejection from the 21.2 Resistance and now it's testing the previous weekly support.
How to approach?
the price could have a false breakout of 19$. In that area the market finds the liquidity for a new bullish impulse.
the price needs to have a breakout from the 21.2 Big resistance.
So, IF the price is going to have a breakout from 21.2, According to Plancton's strategy , we can set a nice order
–––––
Keep in mind.
🟣 Purple structure -> Monthly structure.
🔴 Red structure -> Weekly structure.
🔵 Blue structure -> Daily structure.
🟡 Yellow structure -> 4h structure.
–––––
Follow the Shrimp 🦐

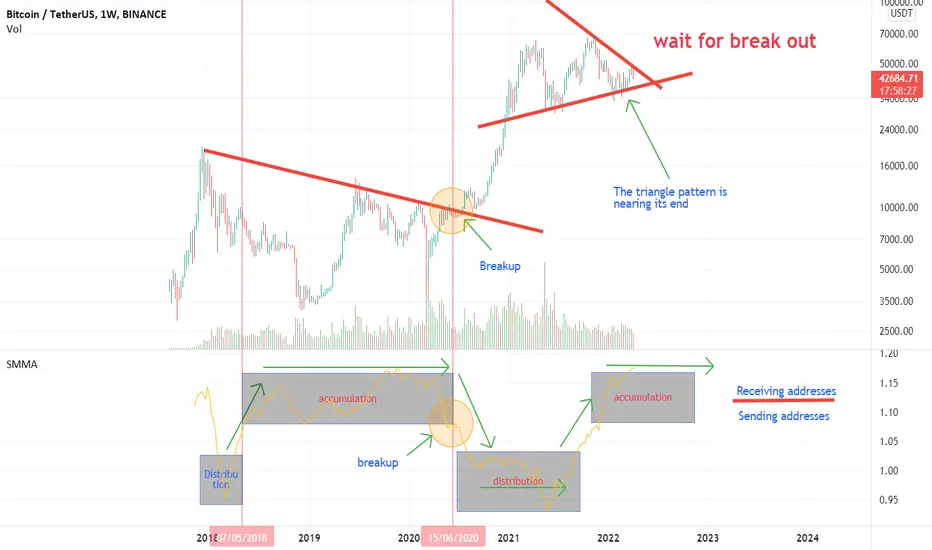
The triangle pattern is nearing its endBitcoin is creating a triangular pattern in the weekly time frame. Although the direction of the breakout is not clear, bitcoin seems to be close to the end of the pattern. the direction of the breakout will be the direction of the next trend
Is the BULL MARKET still on? Plus scalping areas for SHIBA INUIn this video I go over some ideas about current patterns and price movement possibilities on Bitcoin. I also try to answer the question... is the bull run still on? There is also some good info on current scalping spots for SHIB :)

XAUUSD [GOLD] POTENTIAL FALL As you can see in the chart there is a TRIANGLE FORMATION on gold at the 1D timeframe. It suggests that its VALUE COULD DROP in the coming days. So keep an eye out
Bear in mind that this IS NOT a financial advice, rather an expert analysis. If you find it helpful, please give a review and comment. Happy trading guys !!

APLLTDAPLLTD made a triangle pattern as well as inverse head n shoulder pattern & broke out of both patterns with more than average volumes.
Could be bought with mentioned stoploss & targets.

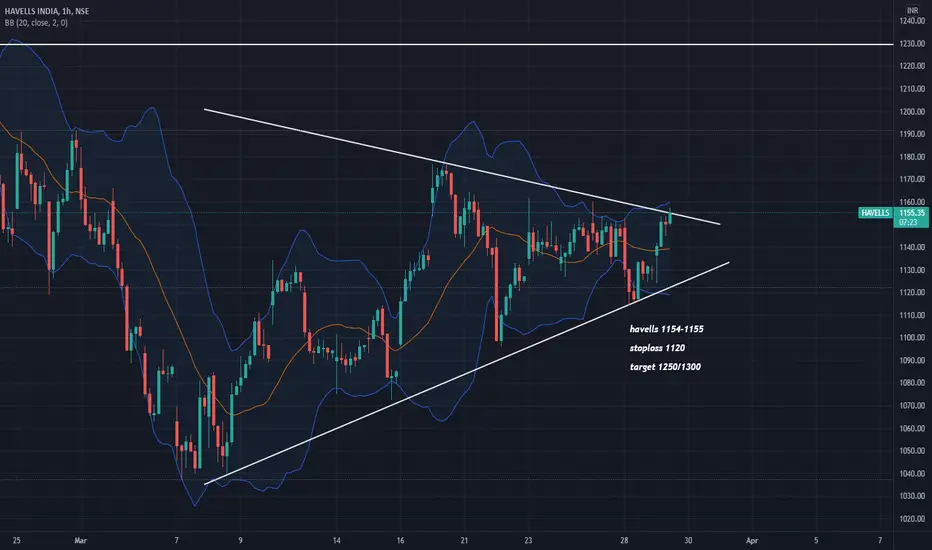
HAVELLSHavells made triangle pattern on an hourly charts & broke out of it & comfortably trading above break out with decent volumes.
Could be bought with mentiones stoploss & targets.
LUNAUSDT m15 - 07/04/2022Luna is having a great triangle here. According to bitcoin, I believe in the next few candles, Luna will make a move toward 110 ~ 112 before another sell occurs.
Good luck.

colColpal broke out of triangle pattern on hourly charts with decent volumes.
Could be bought with mentioned stoploss & targets.
