ZEEL positional target of 337/384/400+One can enter @CMP or wait for the stock to get support from green trendline or you can enter after breakout, I'm not a SEBI Registered analyst and I'm not responsible for your profit or losses.
Share your thoughts on this.
Trianglepattren

daily analysis of BTCaccording to the chart, one can see that BTC is under the yellow and pink trend. both descending trend lines make a triangle pattern with the middle of the ascending channel. BTC is also confined between two moving averages 100 and 50.
In my opinion, the price tend to reduce and touch the lower moving average. then the next target might be the orange line


SKLUSDT massive triangular patternShort term target: $0.5
Long term target: $0.84
#not a financial advice

AAPL area to watchApple rejected from the above line and so far we see 4hr reversal candle. Watch the triangle area, soon it will lead down or up.

XVGUSDTsee and watch :)
It seems that the triangle pattern is breaking upwards and will have the potential to grow up to the specified range ...


SHIB Priming for Blast OffThe triangle pattern has changed slightly and it looks like we could be breaking out sooner rather than later.

SHIB Update - Ready for Blast OffFingers crossed this actually happens! If so we should see a bearish pattern for the next day or two before bouncing again.

NSE:BCLIND formed Triangle patternNSE:BCLIND
#BCLIND trading @ 230 levels by forming triangle pattern.
Bouncing may result good momentum upside.
Good Above 237 with SL 226

Nifty in Triangle - Bulls Breathing Hi
It is just observation that nifty is consolidating in Triangle......Bulls are just trying to take breath after big move.
Negation of this view if Index will go below 17440.
Best of Luck....!!!

DJI LONG Until January 2024? *TrickyTriangle Gannzilla 35741.16 Bermuda Bahama bears run from the drama! Bull Market has picked up more steam a bull breeding pen in Pamplona. Watch out brittle European Bear, the American Bull will not be sitting dinner.
Combined with Gann technicals and weekly triangle pattern, the current, uptrend is on. Macro setup from higher lows on the monthly chart indicates promise for a MAJOR 3 year continuation of the current (11 year bull swing ) on Dow Jones Industrial Average $DJI
WOW. Bull market in full swing 2021.

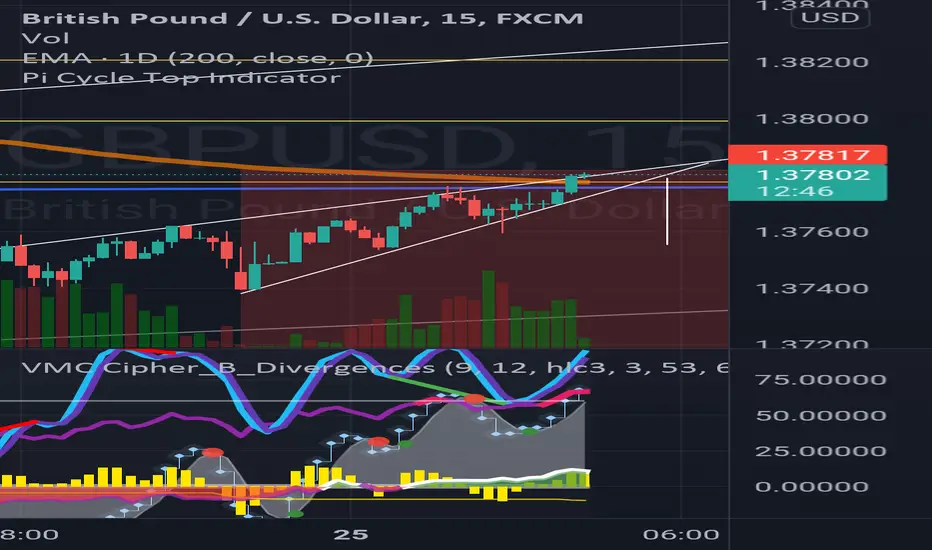
COOL POSITION TO SHORT OR LONGThe rising triangle would be a great opportunity to short
or long GBPUSD after a breakout either upward or downward.
Stop loss should be obeyed and profits should be secured early enough.
Trade wisely😎
GOLD Buy and Sell ideasGold closed below the triangle as shown in the analysis showing that gold could potentially go lower. However we could also see a fake breakout from gold with the news that sent the price of gold up on Friday. These are my ideas and where profits can be taken regardless of where the direction of gold.

Long $GLBE CMP $74.64Long $GLBE CMP $74.64. Possible triangle breakout. Will create new all time high soon. MACD turning positive. Trading above most of the moving averages.

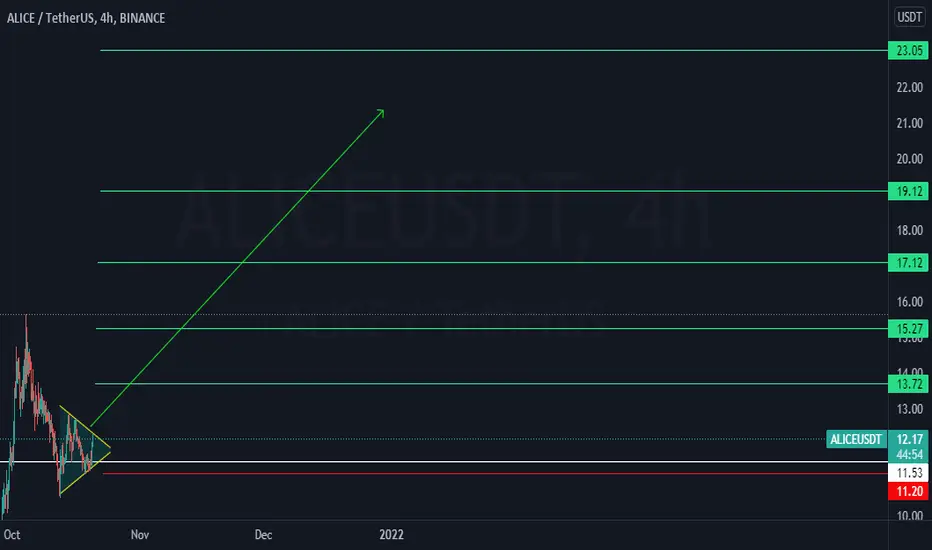
ALICE is going to moon soonas we see
The triangle pattern
you can buy from current price until 11 $
with stop 10.5 $
Targets ; green lines
BANKNIFTY - Triangle formationBanknifty has been trading sideways for the past 3 trading sessions.
At higher levels, it is facing supply pressure and at lower levels, demand is coming in.
Now for tomorrow
It can move in any direction, and there is a possibility of a trending move tomorrow, hopefully.
Support levels - 39428-39462 - opening and sustaining this level, might open a breakout probability from the triangle pattern.
However, gap down opening below 39420 or break below this level, could also mean a selloff, which can extend up to 38630 levels.

ApollotyreApollotyre breaking out of triangle on 15 min chart.
Can b bought for tgts of 250/255 with sloss below 238

A beautiful short move for Dow Jones A beautiful short move for Dow Jones if resistant levels keep holding

ICICIGI nice breakout and retest MY FAV trading setup !!!!!!!!NOT A TIP OR CALL ONLY FOR EDUCATIONAL PURPOSE
* Triangle breakout
* Retesting
* Nice quality stock
* high volume
NSE:ICICIGI

RAMCOCEM IN A TRIANGLE WATCH !!!!NOT A TIP OR CALL ONLY FOR EDUCATION PURPOSE
* Triangle pattern
* Taking good support and resistance from the trendlines
NSE:RAMCOCEM

MINDACORP nice triangle breakout !!!!NOT A TIP OR CALL ONLY FOR EDUCATIONAL PURPOSE
* Triangle breakout
* High volume
* Retesting
NSE:MINDACORP

ESABINDIA triangle breakout 13% TARGET!NOT A TIP OR CALL ONLY FOR EDUCATIONAL PURPOSE
* Triangle breakout
* High volume
* Retesting
NSE:ESABINDIA
