BITCOIN (BTC/USD)Bias: Bullish
This idea is based round the idea of a long ranging period, which then leads to a large push higher.
bias change
If bias was to change, then a push below 92-90k would be expected.
Unless specifically timed with a low chance of alteration by external forces, anticipating the exact timing of events is unrealistic.
Trianglepattren

CRUDEOIL READY FOR ALL TIME HIGH...MCX:CRUDEOIL1! trade at 6770 level. Crude oil trade in a triangle range since last 3 years. This week gives a strong breakout above 6400 level. Now you can watch for all time High level.

Long Signal for Ripple (XRP) | 300% Profit by March 2025!📉 Analysis: Ripple (XRP) has beautifully completed a triangle correction pattern and is now ready for a strong bullish move. This high-potential setup offers a **300% profit** with an impressive 1:8 risk-reward ratio. Are you ready, dear buyers?
📌 Key Levels:
- 🔹 Entry Point: 2.7700 USD
- 🔹 Stop Loss: 1.8000 USD
- 🔹 Take Profit: 11.2000 USD
📊 Outlook: The completion of the triangle pattern signals the beginning of a massive upward wave. This is a golden opportunity for long-term investors aiming for significant gains.
📢 Let us know your thoughts! Share this analysis with your friends and drop your feedback in the comments.

$NASDAQ:AEHR Breaking out of a triangle patternNASDAQ:AEHR is breaking out of a triangle pattern with positive news and earning coming.
Things to consider:
Earnings - Monday 1/13, they've been posting wins quarter after quarter, and I suspect this quarter will be no different. I'd expect a positive boost for the stock price.
News - They've made recent announcement about new product offerings which will help increase their revenue stream. See:
www.tradingview.com
www.tradingview.com
Entry Point:
Current Price ~$17/$18
Stop Loss Target:
Since the stock appears to be in an upward trajectory, setting a close stop loss should be ok something like $15/16. That would mean the price starting dropping back below the breakout point.
Price Target:
$35.99
Back Story:
I have a love/hate relationship with AEHR, it was one of my first big wins in trading stocks - It was my first pennant pattern that I bought ~$6. I then continued taking profits and looking for new entry points. I bought low, sold high (rinse and repeat) and finally got burned by not selling when it hit ~$50's! Lesson learned... Stocks do come crashing down, take profits and accept losses.

LTC/USDT Descending Triangle Breakout with Retest OppurtunityKey Observations
1. The chart illustrates a Descending Triangle breakout, where the price has successfully moved above the descending trendline, confirming a bullish continuation.
2. The breakout has brought the price above the horizontal resistance zone at $115, which now acts as support.
3. A retest of the breakout zone ($115–$116) could provide an ideal entry opportunity for buyers.
Strategic Implications
Monitor the price action closely around the $115–$116 level for signs of a successful retest. If the support holds, it may lead to further upside, with the next target zone around $130–$140, aligning with previous highs. Use a stop-loss below $110 to manage risk effectively, as a breakdown below this level would invalidate the bullish setup. Look for volume confirmation during the retest to reinforce the strength of the breakout.

ARB/USDT Symmetrical Triangle Breakout with Pullback OpportunityThe chart depicts a Symmetrical Triangle pattern, indicating a phase of consolidation followed by a confirmed breakout to the upside. Currently, the price is undergoing a pullback, presenting a potential opportunity for entry within the retracement zone.
Key Observations
1. The Symmetrical Triangle structure has already been breached, signaling the continuation of bullish momentum.
2. The price is retracing towards the $0.85–$0.84 zone, which aligns with key support and represents an attractive area for accumulation.
3. The projected target post-breakout is approximately $1.00, consistent with historical resistance levels and the triangle's measured move.
Strategic Implications
Focus on the pullback as a buying opportunity near $0.85–$0.84. Ensure the pullback holds within this range to confirm support and validate the bullish setup. Look for signs of reversal, such as bullish candlestick patterns or increased volume, to reinforce confidence in the trade. Set a stop-loss below $0.80 to mitigate downside risk, while aiming for the $1.00 target as the primary profit zone.

4020: LONG AFTER BREAKOUT OF SYMMETRICAL TRIANGLE PATTERN4020: Saudi Real Estate had a successful bullish breakout of a symmetrical triangle pattern. Target price can be set as SAR 30, around 17.5% from the point of breakout. Set SL according to your risk management plan. Enter a long position once price retraces and retests the triangle pattern's upper side.
Best of Luck!!

Next target for ETH!BINANCE:ETHUSDT
Ethereum has formed an ascending triangle which is a bullish pattern, but we see no break out. that means the price has no confirmation of a bullish movement.
however when it happens, the price shall increase to 3700$ easily.
⚠️ Disclaimer:
This is not financial advice. Always manage your risks and trade responsibly.
👉 Follow me for daily updates,
💬 Comment and like to share your thoughts,
📌 And check the link in my bio for even more resources!
Let’s navigate the markets together—join the journey today! 💹✨

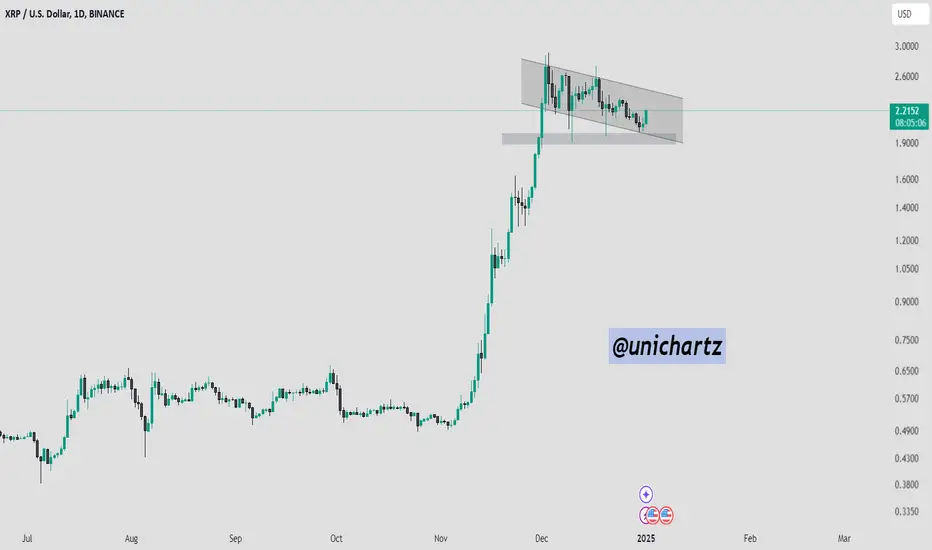
XRP Price Prediction: Breakout Above $2.25 or Further Downside?The XRP/USDT chart is displaying a descending channel following its impressive rally. The price action is consolidating, respecting both the upper and lower boundaries of the channel.
The support zone around $1.89 to $1.98, as previously highlighted, remains intact.
DYOR, NFA
RAMCO CEMENT READY FOR ACTION...NSE:RAMCOCEM trade at 830 level. Stock trade in triangle range. You can watch for next trendline resistance at 1000-1100 level.

Gold Spot Analysis: Crown Pattern Signals Potential ReversalGold's recent price action on the 4-hour chart has unfolded into a fascinating Crown Pattern, hinting at a potential bearish continuation. This pattern, often associated with trend reversals, presents a compelling opportunity for traders to position themselves for the next move. Currently trading at $2,614, gold appears to be forming a consolidation phase within a descending triangle, signaling growing bearish momentum.
Key Observations:
Crown Pattern Formation:
The clearly defined Crown Pattern suggests the exhaustion of the recent bullish wave. The structure follows classic measurements, with XA and DG ratios aligning closely with textbook values.
The neckline at $2,630 has already been breached, solidifying the bearish outlook.
Descending Triangle:
Gold is consolidating within a descending triangle just below the neckline, with lower highs and a flat support line. A decisive break below $2,596 could trigger further declines.
Key Support Zone:
Immediate support lies at $2,554.55, coinciding with the Crown Pattern's projection target. This level will be crucial for bears to maintain their dominance.
Bearish Momentum:
Momentum indicators, combined with volume analysis, show waning buying pressure, further reinforcing the likelihood of a downward move.
-------------------------------------------
Expected Scenarios:
Bearish Continuation: A breakdown below the descending triangle at $2,596 could pave the way for a decline toward $2,554 and potentially lower.
Bullish Reversal Invalidated: If gold manages to break above $2,630 and sustain above this key level, the bearish outlook will be invalidated, opening the door for a retest of $2,670.

is AFFLE ready to move?this will complete symmetrical triangle pattern and once breakout, it will fly
Targets possible:
1360-1490-1590-1690-1780
Disclaimer:- Please always consult with your financial advisor or do your analysis before taking trade

Gold/XauUsd formed a triangle pattern to move FAST!What i see!
Gold/XauUsd: Formed a triangle pattern. We should wait for a breakout to enter this trade. When the pattern is broken, gold will move quickly upward or downward.
It's important to have your own rules on RR and adhere to them. This trading idea is intended to assist you and enhance your knowledge. If you have any questions, please ask me in the comments.
Learn & Earn!
Wave Trader Pro

MKR broke out of channel MKR is the token used to vote on MakerDAO - decentralized autonomous organization controlling DAI. DAI is a stablecoin supposedly controlled by a decetralized organization instead of more cetralized competitors. Currently its market cap is around $2 Bln and DAI mcap is $5.4 bln. In the altcoin market it is quite reasonable to place a bet on stablecoins and one of the limited ways to do it is MKR.
It will most likely reach the green zone which is a nice 20% trade. After that it will reach resistance both Fibonacci and that giant triangle- wise.

Trading opportunity for LOOKSUSDTBased on technical factors there is a Buy position in :
📊 LOOKSUSDT
🔵 Buy Now
🪫Stop loss 0.05050
🔋Target 1 0.06400
🔋Target 2 0.07800
🔋Target 3 0.09900
💸RISK : 1%
We hope it is profitable for you ❤️
Please support our activity with your likes👍 and comments📝

ADA → Bullish Pressure !!!ADA is forming a Triangle on Daily timeframe , Up we go if we do breakout. the price can be bullish and I expect the price to go up to the Fibonacci line of 0.618 = 0.41 Stay tuned for more updates, thanks.
✨We spend hours finding potential opportunities and writing useful ideas, we would be happy if you support us.
Best regards CobraVanguard .💚
_ _ _ _ __ _ _ _ _ _ _ _ _ _ _ _ _ _ _ _ _ _ _ _ _ _ _ _ _ _ _ _
✅Thank you, and for more ideas, hit ❤️Like❤️ and 🌟Follow🌟!
⚠️Things can change...
The markets are always changing and even with all these signals, the market changes tend to be strong and fast!!

CADCHF after long time, changes here expected
CADCHF what's next, we can see SYMMETRICAL TRIANGLE pattern (and possible fake break of same), +price is on trend line. From fundamentals we are have BOC ~two weeks ago and NONFARM from last friday here expecting is have impact.
Currently CHF with many showing weakness, here expecting to see long bullish push
SUP zone: 0.61950
RES zone: 0.63000, 0.63400

Apple in ascending triangle, up to 280$ or down to 200$?Apple had a great move up from 165$ to 237$ in only 3 month, but since then price has been oscillating between 200$ and 237$, this oscillation seem to form an ascending triangle.
Since the stock has been moving up in long and short term, the probability that this triangle breaks out to the upside is higher than breaking out to the down side.
Currently the price is sitting at lower level of this triangle and if the pattern holds, we should see the price move up to 237$ in short term. If the price breaks out from there to the upside, then we will be looking at the price target of 280$. On the other hand, if the price breaks out to the down side, the price target is at 200$ where we have a-formerly resistance-support line.
We should also notice that after the April-July bull run we have already seen a retracement to 0.5 level, and the current movement of the price could be seen as the uptrend after the retracement.

CADJPY higher bearish expectations for this week
CADJPY triangle pattern breakout, price is bounce/test on strong zone, currently price in consolidation zone, trend line is breaked.
Tecnically bearish expectations here for this week.
SUP zone: 110.500/700
RES zone: 108.000, 107.000

Triangle PatternHere we are focusing on 1h time frame for finding upcoming moves on gold. here I have found triangle pattern so when price break this pattern toward downside than i'll execute our sell trade.
Use stoploss for your trade.
Use proper risk to reward ratio.

No one saw it…The pattern no one saw on Neiro. Ascending triangle pattern creating on Neiro.
Let’s wait for potential break out.
This is no Financial Advice. (FA)
Always Do Your Own Research. (DYOR)

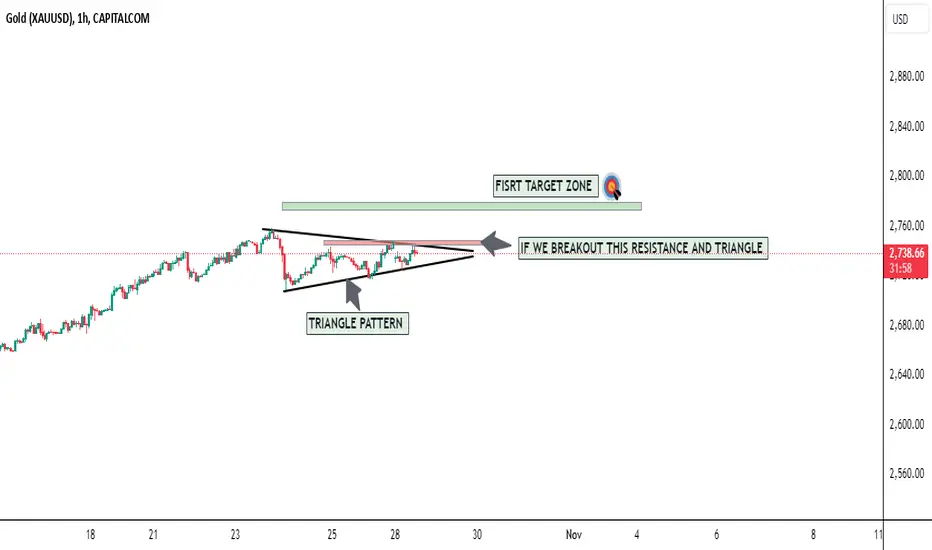
Gold Triangle Breakout! Targeting the Key Pink ZoneGold is forming a triangle pattern on the 1-hour chart, and I’m watching closely for a breakout! 📈 If the price breaks out of the triangle with confirmation, I'll be looking to go long, aiming for the next pink zone as the target 🎯.
Strategy: Enter on confirmed breakout, hold until we approach the pink zone, then reduce my position as it may attract sellers. I’ll update here if anything changes! What’s your take on this trade? Let me know below! 👇
RUNEUSDT Forms Bullish Triangle PatternRUNEUSDT Technical analysis update
RUNE has been trading inside the triangle for the last 30 days and is now moving toward the breakout on the 4-hour chart. If the breakout occurs, we can expect a significant bullish move. The price is trading above the 100 and 200 EMA on the daily chart, which act as support for the current triangle.
