POSSIBLE ASCENDING TRIANGLE ON BTC! THE ASCENDING TRIANGLE PATTERN IS MOST OF THE TIME A CONTINUATION OF THE TREND. WHEN WE MEASURE THE WIDTH OF THE TRIANGLE WE HAVE A PRICE TARGET OF APPROXIMATELY $13500. THIS WOULD BRING US INTO THE GOLDEN POCKET. THIS IS WHY WE WOULD ALSO GO TO THE TOP OF THE GOLDEN POCKET? WHAT COULD GIVE US A PRICE TARGET AROUND $14,000.
Trianglepattren

Triangle or Flag patternThis is an update for my previous analyse, you can check it out. The Trend is Bullish and signs are clear but always beware and don't forget Market Makers maybe have another plan. So I prefer to trade by observing capital management.
Good luck

BTCUSD - Target Achieved - Exit 50%Target is achieved. Hold 50% with a stop loss at buy price..
Hope, you earned nice as I did.
Thanks.

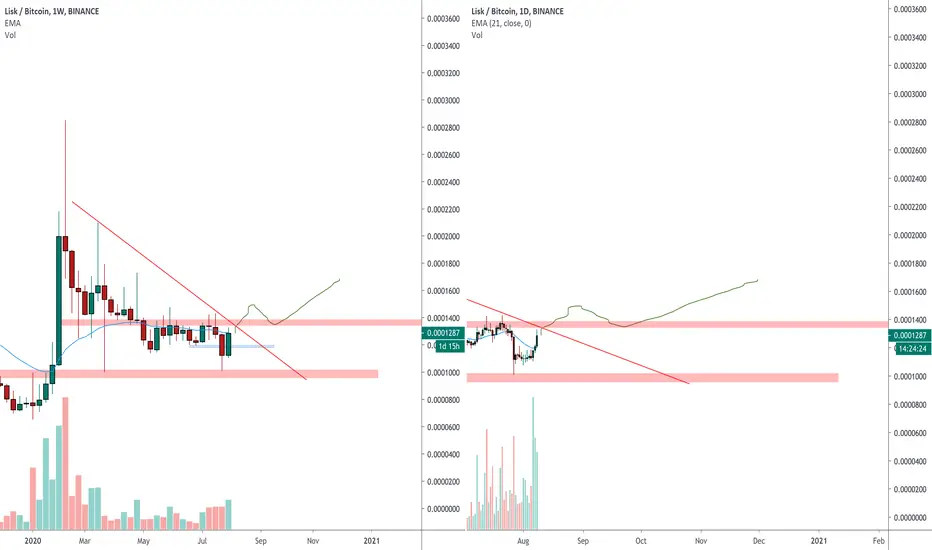
LSKBTC creates a big triangle 🦐LSKBTC creates a big triangle on 1 week timeframe (the left one) and the price is attempting to have a breakout on daily timeframe (on the right timeframe)
IF the price will have a breakout According to Plancton's strategy, we can set a nice order
–––––
Follow the Shrimp 🦐
Here is the Plancton0618 technical analysis, please comment below if you have any question.
The ENTRY in the market will be taken only if the condition of Plancton0618 strategy will trigger.
EUR/JPY could go UP!Hey tradomaniacs,
looks like EUR/JPY could continue its way upwards after the previous retest of the triangle.
LEAVE A LIKE AND A COMMENT - I appreciate every support! =)
Peace and good trades
Irasor
Wanna see more? Don`t forget to follow me.
Any questions? PM me. :-)

XAUUSD, 2hr timeframe, triangle pattern / wave 4 breakout Hello my dear friends,
I spotted a nice triangle forming on the top of XAUUSD. This triangle is an ascending triangle which indicates buyers in control as they are willing to buy in a higher price each time it retrace.
Resistance has already been broken with a solid close, so this downwards movement is only a retest in my opinion.
Triangle pattern usually occurs on the 4th wave of Elliott Wave, so we will assume this 4th wave is now finished. It will be followed by upwards movement which is the 5th wave.
Buy XAUUSD 1970
Stop loss 1958
Take profit 1 @1982
Take profit 2 @1994
Take profit 3 @2006
Take profit 4 @2017
Good Luck
Disclaimer : I am buying xauusd from 1975

MGM - Earnings PlayEntry 16.15 - 16.75
1st Target - 17.61 (sell 20%)
2nd Target - 18.82 (sell 50%)
3rd Target - 19.76 or upper trend line
Stop Loss - 15.35


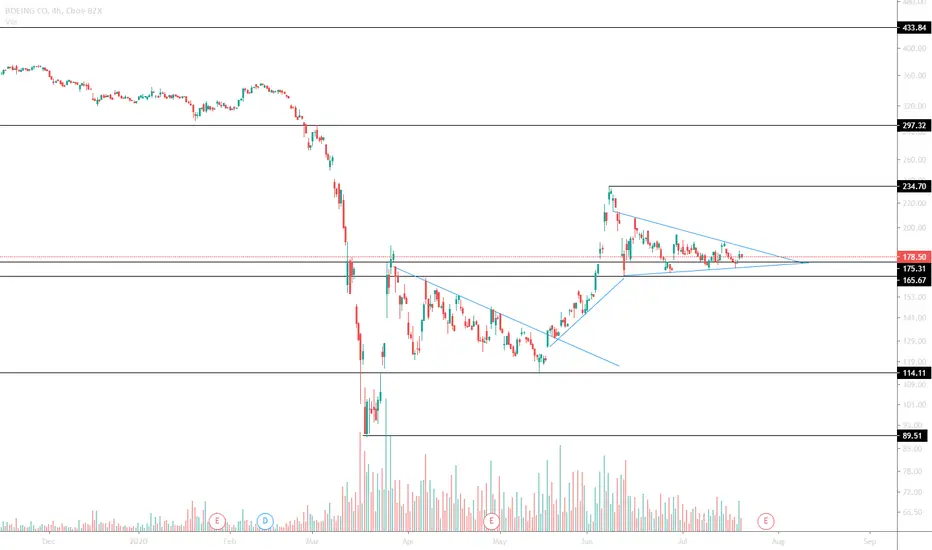
$BA- Boeing - Triangle PlaysClear Support and Resistance Levels with a clean triangle formation. Support below could aid a fake out on the short side and reversal long to $234. Breakout Long from triangle and look to enter retrace. If $234 is achieved I would target $297. If it breaks support at 165 I will look to enter short based on PAs reaction/retrace to noted levels.
Pickup your golden ticketWe have a Triangle Pattern completed on TSX:NGD with confirmation on many fronts. Let's look at the confirmations.
1) MACD Trend Strategy breakout occurring.
I really love this strategy and it has done really well for me in the past. The sell signal here will be when MACD Line crosses back under the signal line.
2) We are trading above the moving volume weighted average price. Since this line is sloping upwards this can indicate that prices will increase.
3) RSI is at a healthy level of 66 and previously broke out of its trend line. RSI hasn't reached over-bought levels so we still have room to move up. Stochastic ties in here since it is also at a healthy level.
4) ADX/DI Trend is strong in the positive direction. We have wind in our sails with this good momentum.
5) Triangle chart pattern confirmed with higher than average volume.
Here is the chart depicting the above confirmations:
With gold on the rise, this stock has the perfect setup to catch this rally.

AAPN - Earnings PlayEntry 46.50 - 47
1st Target - 49 (sell 20%)
2nd Target - 52 (sell 50%)
3rd Target - 55 (ride rest or sell 30% if breaks new trend line)
Stop Loss - 43.90

Inverse Head & shoulder and a triangle pattern.$CLVS looks ready like I have predicted a rally is very close maybe next week. a long triple zig zag pattern with an ending triangle pattern, We should hit the long down trend of 2018, retest the near trend and take off to new highs. Trade at your own risk :)

Which way will the triangle break?? What's your vote, up or dowWhich way will LRCX break out of the triangle? What's your vote?

#BITCOIN - Triangle Pattern In Elliott Wave Theory - Part 2 -BTC Decision Time
Will the $9K Fortress Fall?
There is a seriously crazy amount of stuff happening in the world!.
- Global pandemic.
- A very just and long overdue fight for equal rights.
- Economic turmoil.
The list can certainly go on, but we'll only add one more thing to it — DECISION TIME FOR BITCOIN.
It is very likely that Bears will once again storm the $9K BTC fortress, but will they finally succeed where they have been soundly defeated on several recent occasions?
The Last weeks, bulls were routed, trounced , decimated , by staunch $10K defenders when it blasted clear of the five-digit mark only to violently crash back into the $9,000 region.
Here are a few of the predominant factors holding BTC under.
Focus on Traditional Markets
Retail traders are nowhere to be found, as has been the case since civilians were completely and utterly "REKT" after the 2018 bear market.
That leaves the vast majority of price action up to the pros who have a lot on their hands as of now. Compared with traditional market traders, there are far fewer traders whose sole focus is on cryptocurrency.
Meaning most traders are dabbling across several different types of assets — and not all of them digital . With the irrational-but-widely-accepted ongoing bull market in the Dow Jones; S&P500 and Nasdaq showing little sign of letting up, the spotlight on digital assets has dimmed.
There Is Still a Pandemic.
(In Case You Forgot)
Simply put, there is still a pandemic on. This thing is just throwing a curveball no matter how you look at it.
Currently, it is impossible to say if the pandemic is a boon or hindrance to Bitcoin's fortunes. But, logic might tell us that under such circumstances, an unabated rally to the moon is just not in the cards yet.
From prior experience, Bitcoin always loves a good counter-trend rally, with the recent move from the $3,000s back to $10,000 being another one for the books.
Nonetheless, the insecurity around the economy and the whooping America has taken at the hands of the virus (being the world's leading source of BTC trading activity) means the bull-case is still psyched out.
$10,000 Is a Major Psychological Hurdle!.
Certain numbers are powerful. For Bitcoin, 10,000 is just such a number. Try as it might, BTC hasn't been able to completely break free of the orbit caused by 10,000's gravity.
Even after posting major gains and sustaining prices near the $20K mark, the Bitcoin pendulum has swung wildly even without the myriad forms of turmoil seen today.
Getting near the $10K mark has already been a very wild ride, and breaking through it will be one, too.
The reason we've seen such swift rejection at or above $10,000 recently is that bears need to exert immediate and definitive downward pressure to keep the psychological barrier in play. Too much time spent above $10K will give hope and gather forces on the other side of the equation.
So far, bears have shown more power in defending their fortress, but the longer that fortress remains sieged by prices hovering nearby, the sooner we can hope it will fall.


Bearish Trend After Breaking Trianglethe detail is shown on the above Idea.
this Idea is in Continuation of my Confirmed Previous Idea.


#SIEMENS | NSE | 1D | LONG | #SYMMETRICALTRIANGLE01) Symmetrical Triangle
02) Stock Trading above 20 EMA
03) Breakout Candle - 03-07-2020
04) Check High Volume
05) Target - Check Green Arrow near Channel Top
06) SL - Below Swing Low / Below 20 EMA
-------------------------------------------------------------
Note : This study for educational purpose only.
-------------------------------------------------------------
Please like, share and follow for new positional ideas. Comment if any querry.
-------------------------------------------------------------
Twitter - @bagade_arvind

EURUSD LONG IDEA, still trading on a triangleSaw a double bottom at 15 min time frame.
Wait for breakout and enter for long
At bigger time frame, we have a triangle
so TP is set on the top of the trendline.

VBL continues uptrend Long for profits with a SL !!!VBL is in a strong uptrend. After a fall it took support at 675 and is continuing is steep uptrend. Can go long.

Next 2 weeks crucial for Nifty ???Nifty is making a a rising wedge triangle pattern. It is about to face a very strong resistance at 10700 levels. We may see a fall !!! Just take the opportunity and convert it to cash !!!

Titan touching upper side of triangle Short !!!Titan is making a symmetrical triangle pattern on daily charts. As seen in the 15 minutes charts it is resisted at the resistance line. Great idea to short for a trade.
