Possible rejectionPair just hit a two years old resistance. I'm opening a small short position and I will add if price action confirms the rejection: a double top or some other bearish pattern on lower timeframes. SL above the next resistance. This could be the beginning of a bearish triangle if the pair breaks down the 0.94 support. But let's see how it goes first.
Trianglepattren

Litecoin (LTC): Multiple Selloffs = Potential Downward MovementRecent price movement that has not been able to break above the downward-sloping resistance (upper side of triangle formation) line or fall below the local support area (lower side of triangle formation) shows that markets are getting weaker!
Recent trading sessions have been characterized by multiple sell-offs, suggesting that bears may be gaining strength. However, the lack of a clear break below support keeps the door open for potential reversals. We are looking for a possible break below the support zone around $68.71, which could confirm a bearish movement and initiate a move towards lower support levels, potentially around the $60.50 area.
Conversely, if bulls manage to push the price above the resistance line, it could overturn the bearish scenario and potentially lead to a test of higher resistance levels.

LINK/USDT Long Trade Setup ⬆️ Hello Everyone 🙋🏽♂️
Downtrend
🟠 EP 13.745
🔴 SL 13.182
🟢 TP1 14.325 ⚠️( Close 33% of the trade and Set the SL on EP )⚠️
🟢 TP2 14.870 ⚠️ ( Close 33% of the trade )⚠️
🟢 TP3 15.435 🔥 ( Final result)🔥
We are not responsible of any losses for anyone, our trades are profitable more for long terms and we take losses as everyone,
manage your lot size as well and your SL and TP and my opinion is 0.01 lot for each 500 $.
Don't forget to hit the like bottom and write a comment to support us.
Follow us for more 🙋🏻♂️
Best Regard / EMA Trading .
Disclaimer:
----------------
It's not a financial advise, As everyone we take losses sometime but for long term trading we are profitable traders, so manage your account well with SL and TP and your lot size to keep your account safe and stay in the market

TRXUSDT Weekly TimeframeHello, Hope you all doing well well !
Lets analyse the TRX on Weekly timeframe for a long term investment. :)
It seems that price is making a triangle with 5 waves ABCDE. According to "fib time zone" tool, we have a important time on august 2022 that it can be the end of E wave. ( last wave ). Then price will increase to the targets which I marked on the chart.
Don't forget the TRX burning inception. Be aware of token burning as well. It can help a lot in the market cap.
3/23/2022
**This analysis is not an incentive to buy or sell and is purely educational.**

Goldman Sachs triangle break to downsideGoldman Sachs - Triangle break to the downside on the weekly chart. 279 expected as first level of support.
This is not a recommendation to trade. Do your own research and decide on your own trades.

AUD/USD ↗️ Long Trade Setup ↗️ Hello Everyone 🙋🏽♂️
🔴 0.63080
🟢 0.63790
We are not responsible of any losses for anyone, our trades are profitable more for long terms and we take losses as everyone,
manage your lot size as well and your SL and TP and my opinion is 0.01 lot for each 500 $.
Don't forget to hit the like bottom and write a comment to support us.
Follow us for more 🙋🏻♂️
Best Regard / EMA Trading .
Disclaimer:
----------------
It's not a financial advise, As everyone we take losses sometime but for long term trading we are profitable traders, so manage your account well with SL and TP and your lot size to keep your account safe and stay in the market .

Tesla either forming a triangle or a reversed H&S pattern
Tesla drop stopped right onto what would be its right shoulder of a bullish reverse head & shoulders pattern.
As long as this support holds, the potential is bullish towards the all-time high near $414.50 then $500.
Otherwise, a break below the recent low near $194 would invalidate it and would probably mean that Tesla is in a longer process triangle formation.
Next support would be in the $136 area.

When Madras Fertilizer is set to be a quick Riser.Madras Fertilizers Limited is engaged in the manufacturing of Urea and Complex Fertilizers. It is also involved in manufacturing Bio-fertilizers and trading eco-friendly Agro Chemicals, Organic Manure, and City Compost under the brand name ‘Vijay’
The Co has proposed to set up a 20 MW gas-based power plant with Gas turbine along with Heat recovery by steam generation. It is expected to be funded through the sale of vacant Land in Guindy and Manali and the rest through internal accruals
The Co has changed feedstock from Naptha to RLNG which has resulted in reduction in the cost of production of urea.
The Co is concentrating on product diversification under which two new projects have emerged which are under the study of technical feasibility and financial viability.
Market Cap 1,216 Cr.
Stock P/E 6.56
Industry P/E 10.2
ROCE 26.8 %
EPS 11.5
EPS preceding year 10.1

GBPNZD - Triangle & Wedge Breakout TradeWe've got a triangle, wedge, pennant pattern forming here on the GBPNZD and in this video i want to show you how I use the anchored volume tool to project the levels that price is likely to go to once we breakout from the pattern.
If you have any questions or comments about the idea, or if you just want to share your own views, please leave it in the comment section below.
Akil

QQQ Triangle NASDAQ:QQQ Triangle looks like it sees 325 could keep falling beyond that but seasonality , the fed, and many ether factors can impact the price.

EURGBP: Riding the Bullish WaveEURGBP appears to be on a medium-term uptrend that began on August 23rd at 0.84922. Here's how it's been progressing from Elliott wave perspective:
First, there was a move up to 0.86105 (Wave 1) .
Then, an ABC correction in wave 2 brought it down to 0.85239.
The uptrend continued in wave 3, reaching 0.87094.
After that, a corrective wave 4 formed a triangle pattern and finished around 0.86328 .
Currently, we're anticipating the start of Wave 5, which should break out of the triangle pattern, indicating an upward move. The best approach is to wait for the price to pass 0.86550 and possibly retest it on a shorter time frame before considering a long position.
Our target for this uptrend is 0.87405 . This outlook becomes invalidated if price breach the 0.86103 price level.

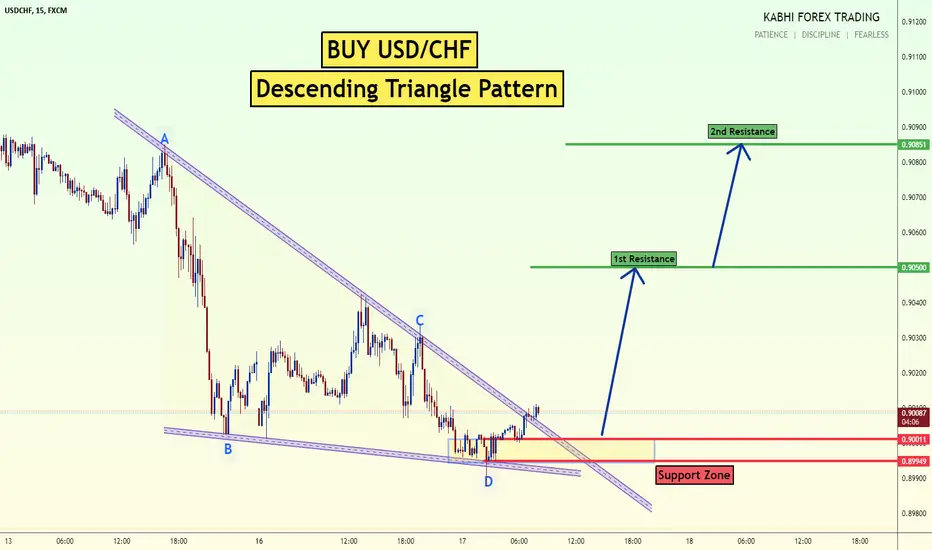
Buy USDCHF Descending Triangle Buy USDCHF Descending Triangle
Chart pattern formation in USD/CHF in m15.
its good chance t o buy
Today Events :
USD - Core Retail Sales
Thank you
The Triangles. With Real-Life Examples.Today, let's back to fairly good known triangle shapes: Symmetrical, Ascending, Descending and Broadening Triangles.
Triangle chart patterns provide valuable insights into market dynamics, representing a battle between buyers and sellers within a narrowing price range. These patterns are often categorized as continuation or neutral patterns indicating that the price is likely to continue its existing trend after the pattern completes.
1. Symmetrical Triangle:
A symmetrical triangle occurs when the slope of the price's highs and lows converge, forming a triangular shape. This pattern signifies a period of consolidation, with lower highs and higher lows indicating a balance between buyers and sellers. As the slopes converge, a breakout becomes imminent, although the direction of the breakout is uncertain.
To take advantage of a symmetrical triangle, we can place entry orders above the slope of the lower highs and below the slope of the higher lows, prepared to ride the price in the direction of the breakout.
2. Descending Triangle:
In contrast to the ascending triangle, a descending triangle consists of lower highs forming the upper line, with a strong support level acting as the lower line. Sellers gain ground against buyers, and in most cases, the support line eventually breaks, leading to a continued downward move.
To trade a descending triangle, we can set entry orders above the upper line (lower highs) and below the support line, prepared for a potential breakout. However, it's important to note that in some instances, the support line may hold, resulting in a strong upward move.
3. Ascending Triangle:
An ascending triangle features a resistance level and a slope of higher lows. Buyers gradually push the price up, testing the resistance level. This pattern often signals a breakout to the upside, as buyers gain strength and attempt to break through the resistance.
To trade an ascending triangle, we can set entry orders above the resistance line and below the slope of the higher lows, ready for a potential upward breakout. However, it's important to remain open to movement in either direction, as sometimes the resistance level may prove too strong.
4. Broadening Triangle:
Now, let's dive into the intriguing Broadening Triangle, also known as a Megaphone Pattern. This pattern stands out due to its expanding price range, creating a unique visual pattern on the chart.
The Megaphone Pattern consists of a series of higher highs and lower lows, causing the price range to widen over time. This pattern reflects increasing volatility and uncertainty in the market, with both buyers and sellers actively participating.
To approach Triangle patterns effectively:
1️⃣ Pay attention to the pattern's boundaries: Identify the upper trendline connecting the highs and the lower trendline connecting the lows. These trendlines define the range of price movement within the pattern.
2️⃣ Watch for breakouts and reversals: Triangles often precedes significant price movements. We can look for breakouts above the upper trendline or breakdowns below the lower trendline as potential trading opportunities.
3️⃣ Confirm with additional indicators: Combine your analysis with other technical indicators or tools to validate your trading decisions. Consider using indicators like moving averages, oscillators, or volume analysis to confirm the pattern's potential direction.
Remember, trading the Triangles requires careful analysis and risk management. It's important to consider the overall market context, fundamental factors, and other technical signals to make informed trading decisions.
Wishing you successful trading journeys guided by these fascinating patterns! 🚀📈✨

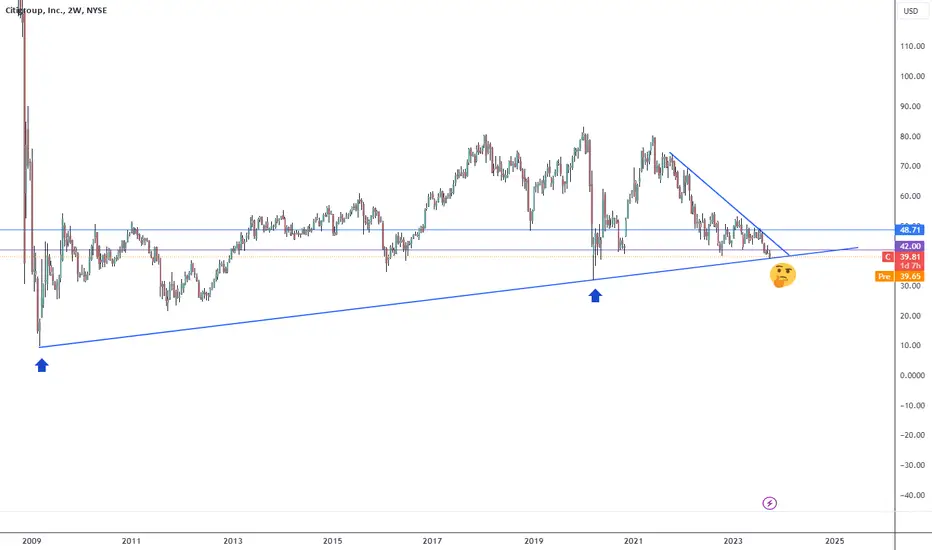
Level to watchBanks aren't sexy these days but check this level. Nothing to do at the moment, if you want to play safe wait until price breaks out the downline. If you are aggressive buy now and very tight SL (~37).
Sell GBPCHF Triangle PatternSell GBPCHF Triangle Pattern
GBP/CHF - M30 Chart - Triangle Pattern Formation.
its good chance to sell today.
Thank you

Triangle Pattern Breakout in ONGC Elliott Wave Analysis.:-
View 1:-
Triangle pattern
In connecting wave triangle pattern seems to be given a breakout and a retracement was taken place. we can accumulate with 1938 as stop loss. .
there are some alternative views. will share in next chart.

Buy GBPJPY Triangle PatternBuy GBPJPY Triangle Pattern
M30 chart - price breaks the triangle pattern
its good chance to buy,
Thank you

Spy Descending Triangle #SPYSpy Descending Triangle
420 to 408 range on the downside with rising rates and seasonality plus the 200 day moving average and the gap fill all point to spy down until October at least.

XAUUSD H4 Triangle PatternXAUUSD H4 Triangle Pattern Formation
Weekly Forecast (Sep 18 - 22)
Must need breakout & wait for conformation in short timeframe .
Thank you.

Dogecoin (DOGE) -> Don't Miss OutMy name is Philip, I am a German swing-trader with 4+ years of trading experience and I only trade stocks , crypto , options and indices 🖥️
I only focus on the higher timeframes because this allows me to massively capitalize on the major market swings and cycles without getting caught up in the short term noise.
This is how you build real long term wealth!
In today's anaylsis I want to take a look at the bigger picture on Dogecoin.
Since May of 2021 Dogecoin has been declining quite significantly and dropped from $0.7 to $0.07 which is more than a 90% correction from the highs.
However Dogecoin is also forming a bullish continuation triangle and after a breakout I think that we will see another bullish pump on Dogecoin with new all time highs in the process.
- - - - - - - - - - - - - - - - - - - -
I know that this is a quite simple trading approach but over the past 4 years I've realized that simplicity and consistency are much more important than any trading strategy.
Keep the long term vision🫡

Correction in Banknifty. Zig Zag, flat, triangle, Elliott Wave Analysis:-
A wave seems to be a Zig-Zag A wave .
B wave to be a connecting wave .
C wave to be extended wave of Zig-Zag C wave
If it didn't break 46369, if broken the 46369 then the flat takes place and zig zag leave the place.
.
View 1:-
Regular flat
If it did not break B wave and breaks the low of A wave then the flat is regular flat and it may be considered as a C wave of previous zig zag wave ..
View 2:-
Triangle pattern
Either the B wave high has crossed or not it the C wave didn't break the low of A wave and it consolidates between A and B wave's .This would lead to Triangle pattern .
I'm not a SEBI registered advisor.
Kindly before taking a trade do your research/ consult your financial advisor.

RELAXO SWING TRADE sept 10
swing trade perfect symmetrical triangle short term opportunity for upside take trade after breakout from the trendline according to own risk this is not call just a analysis.
when nifty turns bullish take trade

A Variation Of The Ascending Triangle On The Weekly TRACETHOrigintrail has a history of outperforming ETH. This looks like a variation of the Ascending Triangle Pattern. With a well-defined horizontal level of resistance.
A very nice looking chart that complements the TRACUSD chart I have also linked to below.
