PC JEWELLER 25% RETURN🔥🔥sept 5
swing trade perfect symmetrical triangle short term opportunity for upside take trade after breakout from the trendline according to own risk this is not call just a analysis.
when nifty turns bullish take trade
Trianglepattren

AKRO, The Triangle LandAn Acropolis was the settlement of an upper part of an ancient Greek city, and frequently a hill with precipitous sides.
We can totally see this pattern here, on $BINANCE:AKROUSDT. Hills with more hills and more hills on top of each hill, the precipitous sides of new and new formations.
Question is, Will we hit the final destination of this move, The Pantheon? The big resistance zone from the older times.
Even if we will, just remember, we're all human beings in these material forms and we don't belong to Pantheon. So sell quickly at the top, protect your belongings and go, cause there will be a bloodbath right after the Elders will smell the tourists on 'em land of Triangles.

INDIABULLS Group stocksHello & welcome to this analysis
INDIABULLS group stocks - Housing Finance & Real Estate - a tale of two triangles
if the lower trend line is saved then upper trend line is initial target and if it breaks above it then a lot more
These are monthly charts so they will take their own sweet time, they are not for short term trading

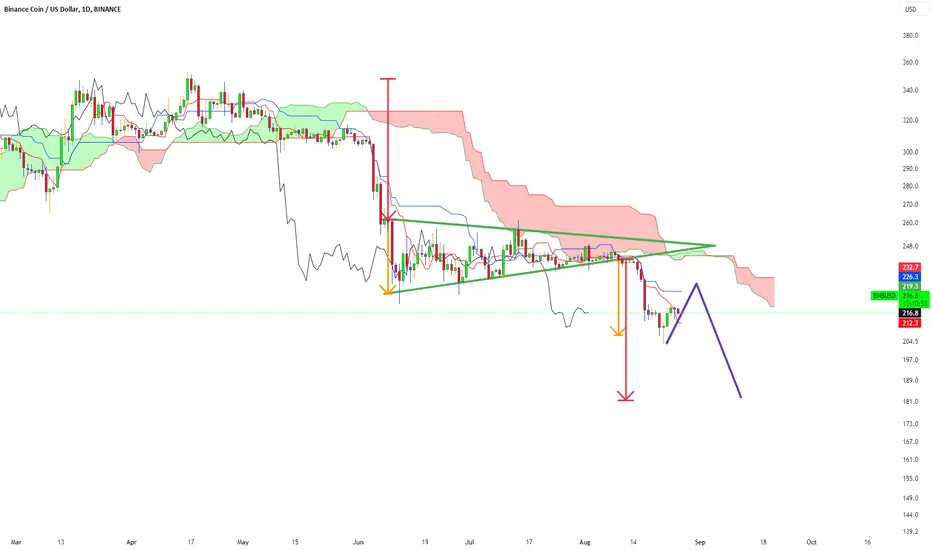
BNB Short-Term Vision !Hello Guys 🙌
Let me tell you something clearly.
it's not financial advice. it's just my vision of the chart of BNB.USD
I wanna share this vision with you. That's all.
Please read it carefully and tell me what you think.
As you see the main trend is still bearish. because we are under the Komo cloud.
The price is far from Kijun-sen.
As we know the price is so eager to be close to Kijun-sen and because of slowing movement In Kijun-sen, the price should be waiting to reach Kijun-sen.
So, we can expect to reach the price of 225-230 USD and then the next scenario will be activated.
So after that, we have to wait for a negative switch between Tenken-sen and Kijun-sen which can lead to further drops.
I specified the short-term target. after breaking the triangle to the price we expect to move. we have two targets. the first one is a Yellow arrow and the second one is a Red arrow. (The last swing)
The main support Zone of around 180-185 USD is everything for Binance coin. I hope Binance Coin never loses this zone. if the price loses that, everything will change for Binance coin and all the market.
Do you agree with me?
do you think Binance coin will lose the main support one and drop?
please do not forget to Like, share, and write your comments below the link.
I'm so eager to know what you think.
and what's your favorite movement in Binance coin?
Share your thoughts in the comments 🙏
Don't Forget To Push The Boost (Like) Button and Follow Me for more!
Best Regards , Ho3ein.mnD
Long term BreakoutThe stock has broken a 4 year downtrend with 7x volumes. Buy ar 112 for a short term target of 158/198/344

Btc sideways #Btc is sideways like Eth is sideways in red and green trendlines. Btc will touch black line support/resistance if it breaks red/green trendline respectively.

Symmetrical triangle on $WOO$WOO is getting ready! Beautiful symmetrical triangle pattern for DLY.
Let’s see how it goes for the next 2 weeks…

NIFTY UP SIDE nifty long trade dont short the market higher tf is bullish so if it breakout from the trend line one can go long and also forming triangle pattern

AGLDUSDTAGLDUSDT is trading in symmetrical triangle.
currently the price is trading a support of symmetrical triangle which is also the previous support.
Will the buyers attack this level and send the price higher again.
What you guys think of it ?

Wipro Intraday Price Action Levels for tomorrowPrice compression is seen in 75 mins time frame, if the price sustains above yesterday's close level, the marked levels can be used for Intraday target sell zones.
The RSI is also moving up from oversold to a strength zone of 60-70+.
The price may move to fill the gap at 414-415 zone.
An intraday trade may be possible with the marked levels, above 410 with an RR of 1:2.

YCA - Yellow Cake breaks triangle Yellow Cake has broken its triangle formation which began in April 2022. There has been a retest at 398 although it is experiencing resistance at 448. The triangle formation in an uptrend is bullish. However, volume is low and, as a result, the breakout is weak.
NOTE: This post if for education only and not a solicitation to buy, sell or hold. Do your own research and trade your own plan.

📈DXY daily chart pattern📉TVC:DXY
CAPITALCOM:DXY
⚡These two scenarios are expected to occur in the dollar index. A break or resistance of the 103.285 level is very important to determine the continuation of the trend.
Please share ideas and leave a comment,
let me know what's your idea.
CrazyS✌

BITCOIN (daily) what is next? 📖💡Hello 🐋
based on the chart, you can see 3 triangle pattern and after each of them the price act as green candlesticks and bluish market 📖💡
so
we expect to see more gain for the price while some red and range candlesticks before huge gain is logical scenario 📖🚀
👌 Notice: pay attention to the price on shortcut chart (located below the main chart with black colour) 📖💡
Please, feel free to share your point of view, write it in the comments below, thanks 🐋


UPL Weekly pattern breakdown.UPL has been consolidating in a range between 850 and 650 on the weekly chart. It has been in triangle type pattern and has broken down on a weekly basis. A close below the upward trendline shows increasing bearish pressure.
Bearish momentum should increase below the weekly low of 673. One could expect greater selling pressure if price closes below the support at 650 and the 200 Weekly EMA which is also around 654.
After the breach of these levels, the following levels could be expected..
Target 1: 621
Target 2: 569
The setup would be invalid if we get a close above 725. Keep watch.

EURUSD short position idea.This is a simple descending triangle pattern. Major trend is down. Simple market structure + major trend = increased win rate.

KAMDHENU SWING TRADE🚀30%swing trade perfect symmetrical triangle short term opportunity for upside take trade after breakout from the trendline according to own risk this is not call just a analysis.

YESBANK Ascending triangleIn Daily Timeframe YESBANK can be seen forming Ascending triangle pattern.
It seems like it is breaking triangle resistance, we can see good move upwards from 17.30
Entry: Above 17.30
Target: T1 - 18.50
T2 - 19.50
Stop Loss: 15.85
Disclamer:
This analysis is for educational purpose only.
This is not a financial advice. Do your own research.
#NFA #DYOR

AAVE will continue his falling?!BITGET:AAVEUSDT touched the Lower High's trendline and immediately went back down for a -4,56% (respect the +11% that was made before).
This means that BITGET:AAVEUSDT rejected the trendline and went back.
This could indicate that BITGET:AAVEUSDT could go short again for some time, in the extreme case it could touch again the blue support.
Or BITGET:AAVEUSDT could retest the trendline and even break it and go up to +100$ or even more.

JSWSSTEEL Triangle Breakout ???JSWSSTEEL Triangle Breakout on Daily Timeframe.
With RR 1:3,
Target till 910
SL = 761

26 ) EURUSD H1 I think it's bullish also it's maybe bearish because a triangle pattern can be seen.
Try to lose less because profits will come
#EURUSD

A Downfall?Another classical descending triangle pattern formation observed in Fin Nifty today. Will it break down further or break out from the contraction? Let's see who drives it up - the Bears or the Bulls?

THIS BREAKOUT WILL CONFIRM THE BEGINNING OF BULL MARKET!!Hello everyone, if you like the idea, do not forget to support it with a like and follow.
Welcome to this Total Market Cap update. Looks very interesting.
As you see in the chart, Total M.cap is verge on the breakout in the weekly time frame. Forming a descending triangle in the weekly time frame. If it gives a clear breakout this week, then this will be the confirmation of the beginning of a bull market. Or if we get a rejection from here then we see some correction in the market.
As of now, wait for a confirmed breakout, and meanwhile, just do quick scalps.
What do you think about this?
Do you also think that the bull market will begin from here or do you think that we see another big drop before the bull run?
Share your views in the comment section.
If you like this idea then do support it with like and follow.
Thank You!
