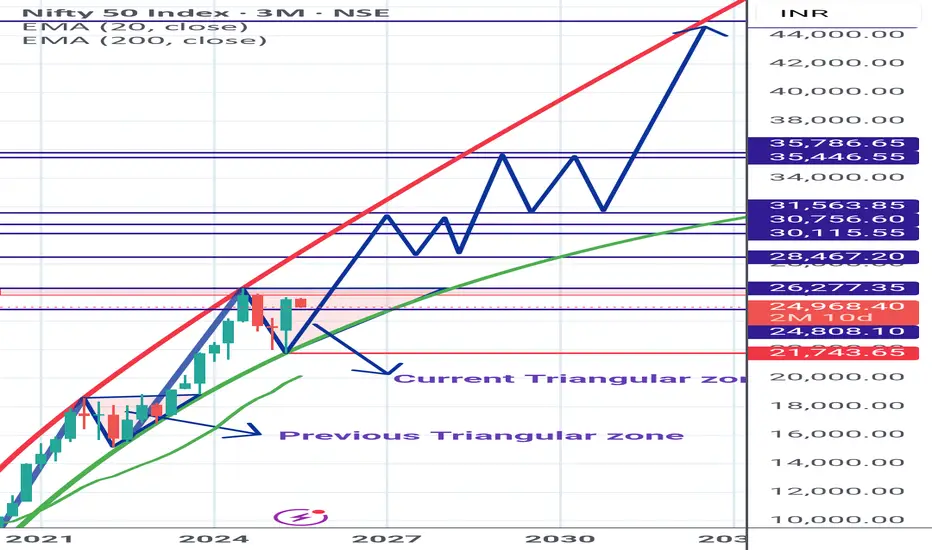
Nifty Spot Longterm View *Nifty Spot* Chart for members Reference.
Currently trading in Parabolic trend and inside Triangular zone.
On closing above the triangular zone, big rally to Begin.
Shared *My Study* based on chart pattern.
Kindly do your analysis from your side too.
Triangular
Bikaji Food Triangular Pattern, Long, 1DBikaji Food is following a triangular pattern. If it breaks the level of 780 with Bullish candlestick patterns like Bullish Engulfing, Hammer & Inverted Hammer, Piercing Line, Morning Star, Three White Soldiers, Tweezer Bottoms or Bullish Harami, then take a long trade on this stock with first target of 815 and second target of 851.
Entry: 780 (on Bullish candlestick pattern)
Target1: 815
Target2: 851

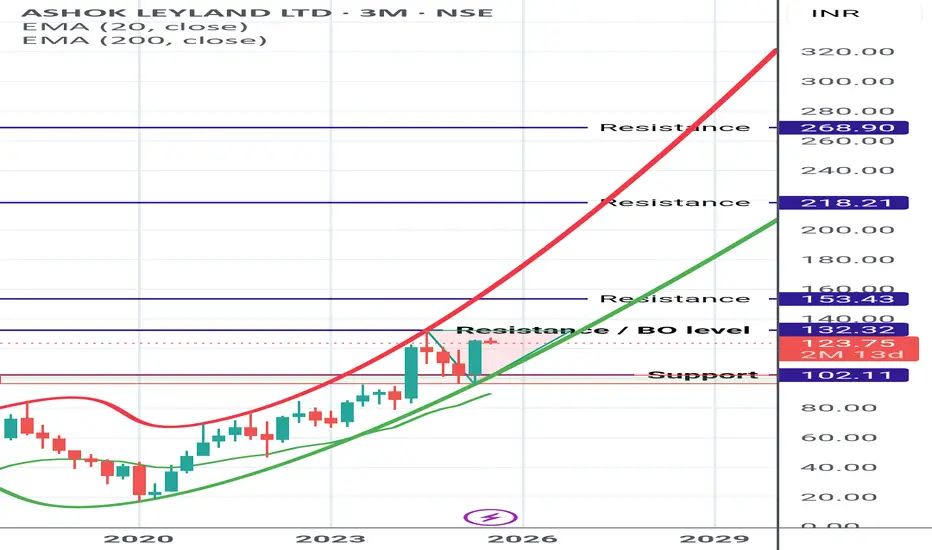
Ashok Ley land updated view Ashok ley land chart updated after price adjustment of bonus.
Currently trading in Parabolic uptrend pattern and inside Triangular zone.
On closing above the triangular marked zone (Breakout level) rest of the marked Resistance can be expected
AMC's decreasing triangle - waiting for its breakoutAMC has been providing fake buying signals since last June, which has ended up creating a decreasing triangle composed of a buying zone and a series of decreasing maxima.
Right now, the price of these shares is placed inside of a buying zone, which in a normal situation could entail a buying opportunity. Nevertheless, as the triangle figure is very close to the appex,it is a better option to wait until the price of the shares breaks the triangle in any direction. Once it breaks, operating in the direction of the new trend could be a potential strategy.
We'll keep track of this share price evolution

Super triangular patternIn the USDSGD currency pair, we are seeing the formation of a continuing triangular pattern, so we expect the price to continue to move down and touch the following targets.
TP1: 1.38322
TP2: 1.37588
TP3: 1.36853
TP4: 1.34584
If the price goes above the triangle, we expect the price to rise to at least 1.40051. But keep in mind that the probability of a price increase is 20%.
The analysis is performed on a daily basis and is long-term.
🔸Signal by Yazdani

Form a triangular patternIn the CHFSGD currency pair chart, we see a continuous triangular pattern. That's why we expect to see a sharp drop in the price of the CHFSGD currency pair if the price goes down from the triangle.
The price is likely to drop to 1.45387 and you can put your target there. If you can't risk much, set your first target to 1.46000.
Note that the condition for activating this signal is the price exit from the triangle pattern to the bottom.


GBP & JPY => GJ with simple indicesAs momentum of JPY and GBP both appear to be directed to the upside and strong, it would feel quite certain to take a short position on GJ wjhen JPY clearly takes the lead on chart of currency strength indices.
However CAD & USD collective selling pressure is lurking and may unexpectedly overpower JPY buying power in the strongest triangle of world economies and cause the three USD, JPY & CAD to flash crash. Then GJ will suddenly turn from a Long to a (fast and big) Short.
Both JPY and CAD send this effect onwards to their respective pairs and trading them should add extra care monitoring the three majors for a possible crash anytime soon.


BEARISH PLAY FOR USDCADSTOP LOSS : 1.3023
TAKE PROFIT : 1.24245
Risk-reward : 2.56
Longer term trend: BEARISH
Current trend: BULLISH
General comments:
USDCAD has been bearish since end 2016. Huge drop followed by a 50-61.8% bullish retracement. Subsequently, another lower low was made and we are in a short term bullish uptrend. Price face strong resistance at the 1.29 mark, which coincides as the 50% fibonacci level.
What I like:
1) With the long term trend. If price hit the shorter term target, and price breaks lower to continue with another bearish movement till about the 1.20 mark, the trade will be very profitable.
2) Excellent R-R
3) Excellent bearish engulfing, with close being at the lower 7/8th of the bar.
What I dislike:
1) Price seems to be moving not in favor at present, signalling the possibility that the trade will not be triggered.
Other things to note:
Optimal entry would be a few pips below the bearish engulfing bar. Entry any earlier will be considered premature.
* Do support by liking and following! All suggestions/feedback welcome!
x,
iskfx

BULLISH BITCOIN PLAYproposed STOP LOSS : ~10,600
proposed TAKE PROFIT : ~17,000
Risk-reward : over 4x
Longer term trend: BULLISH
Current trend: BULLISH
General comments:
Bitcoin has seen bullish movements since the start of February 2018, making higher lows with highs pegged at 11,700. The result is a beautiful bilateral triangular pattern.
A bearish break below the trendline will have my bias be bearish, with a target of around 6,000.
However, a bullish break above the resistance will mean bullish movements are likely. This post will favors and assumes a bullish break in the foreseeable future.
What I like:
1) 3 touches of resistance and bullish trendline. This translates into a
well developed triangular pattern, with support and resistance being highly respected.
2) excellent risk-reward, about 4x.
What I dislike:
1) still quite premature to risk capital for the large play. Fortunately, price hitting the 11,700 resistance is quite likely considering a bullish engulfing pattern formed at the support.
2) A bearish pin formed just after the bullish engulfing bar, showing signs of weakness even for the short term play.
Other things to note:
1) Bitcoin has been bullish for the past month but many other large and mid cap coins are moving sideways. This signals a weak cryptocurrency market and should be taken into consideration should you choose to risk capital for this bullish play.
* Do support by liking and following! All suggestions/feedback welcome!
x,
iskfx

BTC USD just for entertainment, I don't believe in this happeninHi there. I have read some popular threads about BTC patterns here on TV. People say that bitcoin is forming symmetrical triangular and it will go bullish up to 1.618 fib which is at around 15k. What I want to say is that, if BTC is forming symmetrical triangular it is going to dip, Why? because in my knowledge symmetrical triangular in downtrend means bearish price action and taking fibs from All time high, 1.618 is right at the support which is at 4.5k. Anyway I did this research only for entertainment and personally I do not believe that this is going to happen, I'm positive in BTC and still see 50k this year. Learning new things everyday and people having smart advices or who want to share their ideas feel free to comment.
Its just my opinion, don't take it to serious.
This is not financial advice nor a fact that this pattern is going to happen.
(If it would, I would drink till I'd be dead)


Waiting for sell setupcould be a good chance for a nice sell setup. lets see if the market hit the target.


Triangular Moving Average (TRIMA) IndicatorThe TRIMA is simply the SMA of the SMA -- a double-smoothed simple moving average. The end effect of the double smoothing is that greater weight is placed on values near the middle of the lookback period. It therefore reacts relatively slowly to price changes compared to most moving averages.
But why would I want more lag?
One potential use of this moving average that I've found is that it can allow price to run for a bit after crossing the TRIMA before catching up and creating an opposing signal. It therefore creates the chance for the price to "run its course" so to speak, which can make whipsaw signals less common.

Trade with these lines of triangular geometry my friend (NASDAQ)Triangular geometry was designed to take on Keynesian markets.

Trade with these lines of triangular geometry my friend (SPY)Triangular geometry was designed to take on Keynesian markets.

Trade with these lines of triangular geometry my friend (DOW)Triangular geometry was designed to take on Keynesian markets.
