Triplebottom

$TPGY Longterm Bull on EVbox mergerTPGY with an ABCD to finish off its wave 1. Then retraced down to the .786 for a wave 2 completetion. Has now finished a triple bottom consolidation right around the A leg of the ABCD which is the min expected value. Technically this is all very sound, so I have take the time to make PT on its projecting to a Wave 3 (1.618). A lot of upside on this one, but a strict stop loss at the .786 because I think Growth stocks are in a bit of a rut. If it breaks the pennant upwards this one should fly and become a hot name.

USDCAD Bullish Double Bottom/Triple BottomAfter a much rather heavy bullish run, I believe the greenback still has this pair under their control as price may be tempted to accumulate here at this current local support, if a triple bottom is formed, it'll respect our optimal risk to reward for entry as close as we can get price to retest the previous 2 hits on support.

USDCAD Long - 26/3/2021Hello traders !
We have a Triple Bottom formed and also a resistance level breakout. Now we are waiting for a retest so we can confirm this zone, our fibo levels and VWAP -> that means we can see a shift in the market direction. Also fundamentals are more into USD because our 10-y yields are rising and investors are putting their money into USD.
Thank you for reading !

FTSE100 - Triple bottom formedFollowing on from my previous idea, the FTSE has continued to show strength at this level of support.
A triple bottom has formed at what looks like the bottom of the cup in a cup and handle pattern.
If FTSE traders were bearish, the drop from the rising wedge would've been steeper. The news around the vaccine spat with the EU would've also likely caused a steepeer slide. However, because the bad news has been absorbed, we can assume traders are bullish (for now).
I think the only thing stopping the FTSE from moving up is the current fears around lockdown on the continent. Technically speaking, I like how the chart looks. Bulls seem to be defending the 6700 level well. Fundamentally, the fears over lockdowns worries me about this setup, but I'm still confident it will play out.
See chart for entries and exits

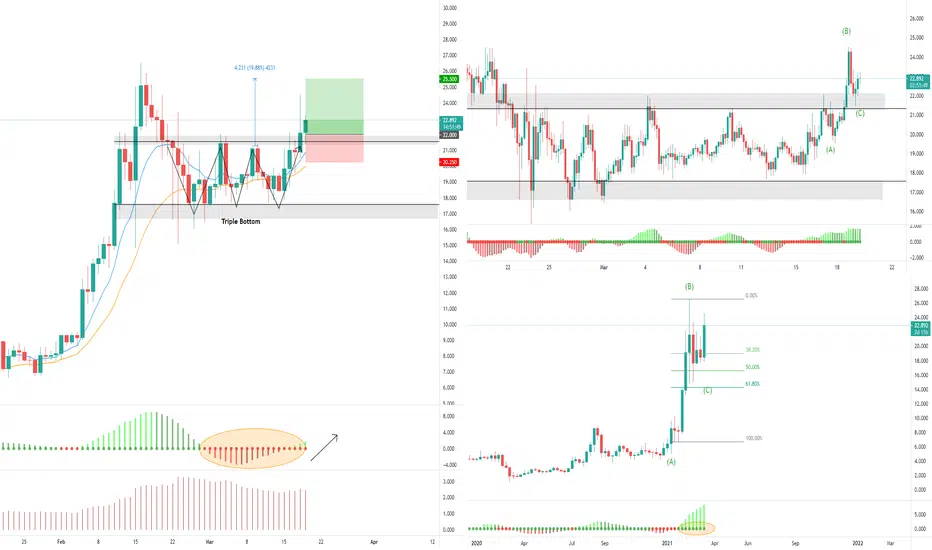
ATOMUSDTWEEKLY
Obvious large bullish momentum after price retraced to the 50% Fibonacci level of the A-B impulse move
DAILY
Price formed a triple bottom between the consolidation zone of $17.5USDT to 22USDT. Squeeze indicator showing momentum shift to the upside
4HR
Price has broken the $22USDT resistance level forming a higher high and has currently pulled back to the former resistance zone now support
ENTRY
22USDT
S.L
20.25usdt
T.P
25.50USDT
USDZAR Triple bottom buying opportunityAnyone who has studied chart anatomy will recognise this trading setup, no surprises here. Prices trade within the range three times (We are heading to or are already on our third bottom, preventing future declines. Will the USDZAR price descend below these prices in the foreseeable future? I don't think so, at-least not in a long time.
Am I saying you should buy the USD?? No, I'm saying DYOR.
Confidence level 8/10
Please like and comment your thoughts. Interested to know what you think about this idea.
Goodluck!

🔥 AVAX Triple Bottom IdeaAVAX has previously seen a strong rebound from the 22.50 area. This trade is based on that same idea.
Before entering this trade wait for the price to touch the Entry line. Higher time frames yield a higher predictive power.
On the chart I’ve marked two potential areas of resistance, R1 and R2. These areas are based on recent swing highs. Do your own due diligence.
Happy trading!


Ocean/USDT 1H. Solid triple bottom - Trend Line Break OutOcean/USDT 1H. I like stacking a few Ocean on the dips. Superb project.
Looking at the 1 hour chart: I see a very good triple bottom that has offered support multiple times, far left is a 4th touch and within the rectangle is a good support zone.
Buyers are not letting OCEAN dip beyond here 78 -80cents. All this and price action is within a larger ascending triangle structure that is bullish in its own right.
Trend B, the blue descending line has been broken and had a retest, I'm a bit early to call this, but I HODL generally and look for dips. That said, I do like the look of this chart. I'm looking and HOPING to see an ATH in the shorter term.
Also note support correlates to the Fibonacci retracement. 0.618.
Fundamentally OCEAN is a good bet. Worth a look.

IDX:PGAS Bullish Triple BottomI found some nice chart pattern (Bullish Triple Bottom) on IDX:PGAS.
hope it will move as predicted.
please comment your thought on this.

Triple bottom XPEV Insta Gurkha.Tradesthis is a long idea on triple bottom xpev chart. tech analysis by Gurkha Trades. Not a financial advisor.
#Gurkhatrades

UMAUSD - Reversal pattern (Bullish)Started to build a triple bottom pattern more visible on the 1 hour chart. If it breaks through neckline, UMA will start a bullish wave pattern which will re-test the all time high's. What are your thoughts?

EUR-AUD Will Go Up From SUPPORT!Buy!
Hello, Traders!
EUR-AUD established triple bottom and is looking bullish
Therefore, we are waiting for the breakout of the resistance
Of the small falling channel
And then we buy on pullback
With 4 targets in sight
Cover half after target 2
BUY!
Like, comment and subscribe to boost your trading!
See other ideas below too!

$slv - getting ready for next legcancel out the noise from wsb and fintwit. technicals were not ready for the forced breakout monday, so chart looks wonky.
25-26 levels are tough, but once we get past them, we will see bigger moves.
triple buttom, cup and handle. call it what you want. it's bullish~

QLGN: INVERTED HEAD AND SHOULDER, BOUNCE PLAYQLGN
The price is retesting the neckline of the inverted head and shoulder . It is potentially a very good support for a long entry.
I'm playing the bounce with the red line as target (swing trade).
I'll close the trade if we break below the neckline.
Trade safe.

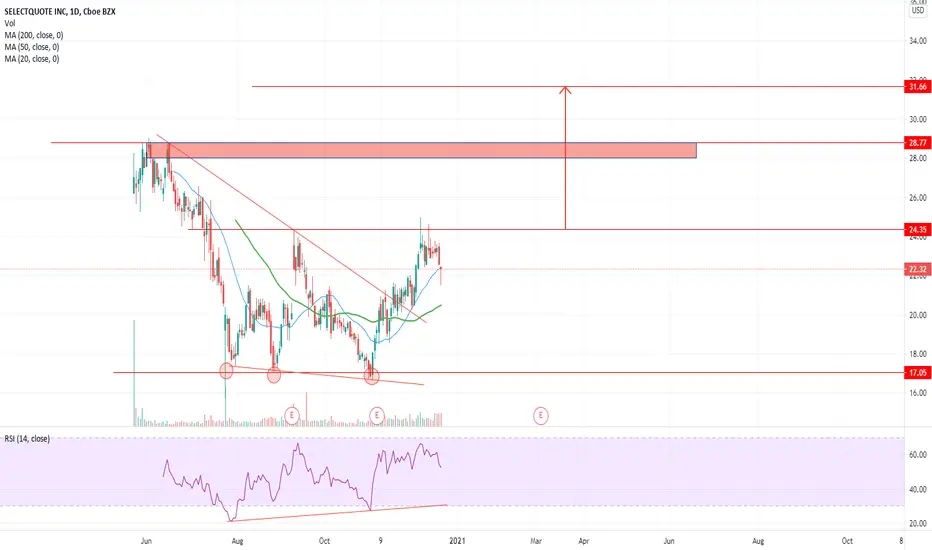
Selectquote is looking interesting after forming triple bottom NYSE:SLQT is close to breaking out of the triple bottom pattern, long the break of 24.36$ level to target the sell zone between 27$ and 27.77$ then 31.66$. Stop a bit far away ideally at 16$.
Hit the like button please if you find this useful :)
This is only my own view and not financial advice, do your own analysis before buying or selling
Happy Trading!
CCO seems to have bottomed outNYSE:CCO traded sideways for a while and formed a triple bottom, break out above 1.64$~1.69$ will target 2.05$ and then 2.43$. Stop level at 1.2$.
Hit the like button and follow if you find this useful :)
This is only my own view and not financial advice, do your own analysis before buying or selling
Happy Trading!


CMCM is showing bullish price actionNYSE:CMCM is break out from the multiple bottom consolidation area and is now target 2.38$, 2.54$ and 2.87$. Any pull back towards the break out level at around 2.15$ is buying opportunity. The move is backed up by positive earning for the past two quarters, it is always convenient to long stocks that are bullish technically and fundamentally. I would place my stop at 1.79$.
Hit the like button please if you find this useful :)
This is only my own view and not a financial advice, do your own analysis before buying or selling
Happy Trading!

$iris USD Falling WedgeIris falling wedge. History repeats and we'll see it bounce back! Lets see how BTC reacts with $Iris. #Iris is oversold on the daily.

InvoCare Limited (IVC) - LONGInvoCare Limited (IVC) - LONG ASX:IVC
InvoCare Limited provides funeral, cemetery, crematoria, and related services in Australia, New Zealand, and Singapore. The company operates 290 locations, and 16 cemeteries and crematoria under various brands. In addition, the company operates MyGriefAssist, an online grief resource Website; and MyMemorial, a Website that provides range of cremation and burial memorial options, as well as provides digital funeral planning services under the Funeral Planner brand name.
Technicals:
An entry could present itself on the break of the cup & handle pattern and establish a continuation of the preceding trend since September. Although TL has not been confirmed on the weekly, the 50 EMA has recently crossed the 100, with the 100/200 about to do the same. Back-testing similar pattern setups occurring on the break of the 200 has seen a handy upside profit in a short period of time. On the break of S2 with a reflection in buying pressure, the gap from back in March could be filled @ $13.00. It looks like it could possibly head to $14 at the extension.
This trade would be void if IVC does not break through S2.
Fundamentals:
Earnings are forecast to grow 35.91% per year
Forecast earnings growth (35.9% per year) is above the savings rate (2%).
Earnings (35.9% per year) growing faster than the Australian market (17.8% per year).
Earnings are expected to grow significantly over the next 3 years.
IVC's revenue (8.2% per year) is forecast to grow faster than the Australian market (4.9% per year).
Trading at 13.9% below it’s current fair value estimate.
Debt is well covered by operating cash flow (26.3%).
The CEO’s (Martin Alistair) total compensation is below average for companies of similar size in the Australian market and has been consistent with company performance over the past year.
Never take stock tips. Educate yourself and always DYOR while implementing a rigid risk management plan before investing your own money.
