GOLD Long Gold hit the 1453.40 level for the third time on Friday before that huge move up to 1466.30 forming a Triple bottom formation. Now it is retracing to retest 1458.00. we will be going long at this level if it gives us a raison gud enough to engage.
Triplebottom

EURCAD Update and AnalysisThis buy has been a long wait. Now price has formed a TRIPLE BOTTOM and formed what looks like a miniature IH&S as it has failed to break above the area around 1.4631. Price could attempt to retest and hopefully break above it or just CRASH further down towards 1.45....
Gud Luck


Good week for #XPT/USD Can it break out?Still has to break 2 big resistance areas of 86 and 90 (200 EMA) before it heads skyward
Triple bottom lasting 14 months about to comlpete

AUD CHF Triple bottom- A Triple bottom has occurred and as we can see price has come to retest the neckline of the Triple bottom pattern.
- Will be looking to go long providing we can get a Bullish candlestick formation such as the Engulfing or Bullish hammer.


CLSD - Triple Bottom. Huge Analyst Prediction Clearside Biomedical, Inc. is a clinical stage biopharmaceutical company, which engages in the development of drug therapies to treat blinding diseases of the eye. Its pipeline includes Suprachoroidal CLS-TA, Suprachoroidal, Suprachoroidal CLS-TA, and gene therapy. The company was founded by Samir Kumar Patel, Vladimir Zarnitsyn, Mark Prausnitz, Daniel H. White, and Henry F. Edelhauser in May 2011 and is headquartered in Alpharetta, GA.
Average Recommendation: OVERWEIGHT
Average Target Price: 5.50
SHORT INTEREST
2.26M 07/15/19
P/E Current
-0.48
P/E Ratio (with extraordinary items)
-0.72

HKEX:958 Potential profit 35%HKEX:958 has formed three bottom now. If it can successfully break the 2.5, the target would be 3.05, which will be around 35% return.
Now it has a bottom head and shoulder pattern with target 2.5. Let's see if it can break this resistance and head to our final target.
Cut loss @2.05
Target @3.05
Buy in @2.25

NZDUSDPerfect time for one 0.3 position. On W chart we have triple bottom, RSI at dissent level for action. D chart is even better for same call. On top of tgat, swap is positive. I'll live this baby to grow. Eventually after 75pip will ad one more

USOIL triple bottom completedUSOIL triple bottom completed
and pulled back to structure
around 56.80 will be a good area to long
SL : 55.90
TP : Follow arrow

Intraday setup: USD/CAD analysisfocusing on the smaller time frame, the price has created its 3rd drive into that consolidation zone, the price has overextended into a key psych region. Am expecting a retracement towards the 1.32500 area
- Also, GDP for CAD is expected to be lower than previous stat, that could be the catalyst for the price to pick up momentum
great risk/reward of 1:4

Will ARK hold the triple bottom? Chart speaks for itself, can ARK remain in the horizontal channel?
Retesting the yearly lows between 650-700 sats

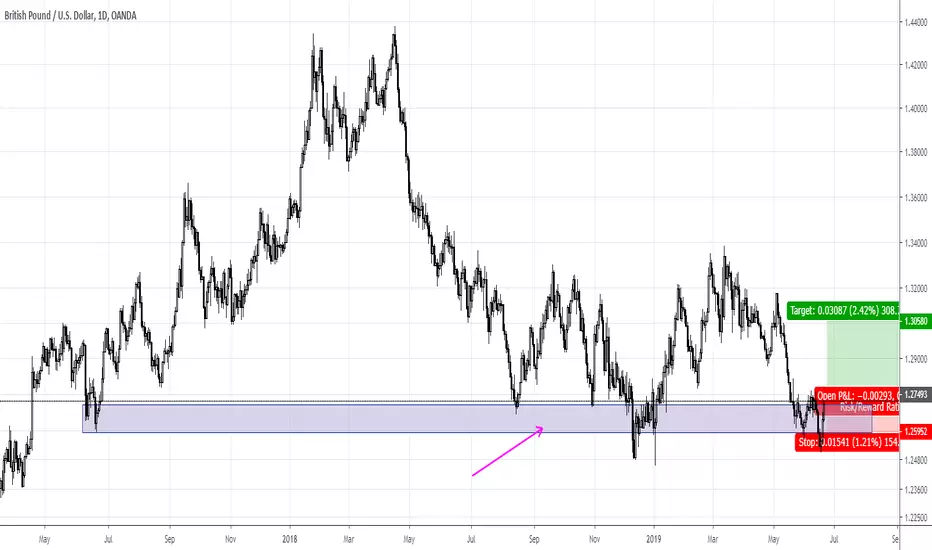
Found Support?It looks like price has found a comfortable level of support and may return to recent highs. Enter at 1.27521, Stop: 1.26023 Target: 1.30580
happy trading?
DRCBTC Is it a dream come true? Is it Near to break a bullish triple bottom pattern? MACD is positive from 2 days and I can see a bullish pattern on 2-4 hours frameset.

AUD/CHF - Triple Bottom - 1HRTriple Bottom on AUD/CHF - 1 HR timeframe. Appears at the bottom of a downtrend. Possible reversal to the upside. Would set a buy limit order between Fib level 38.20% and 50%.

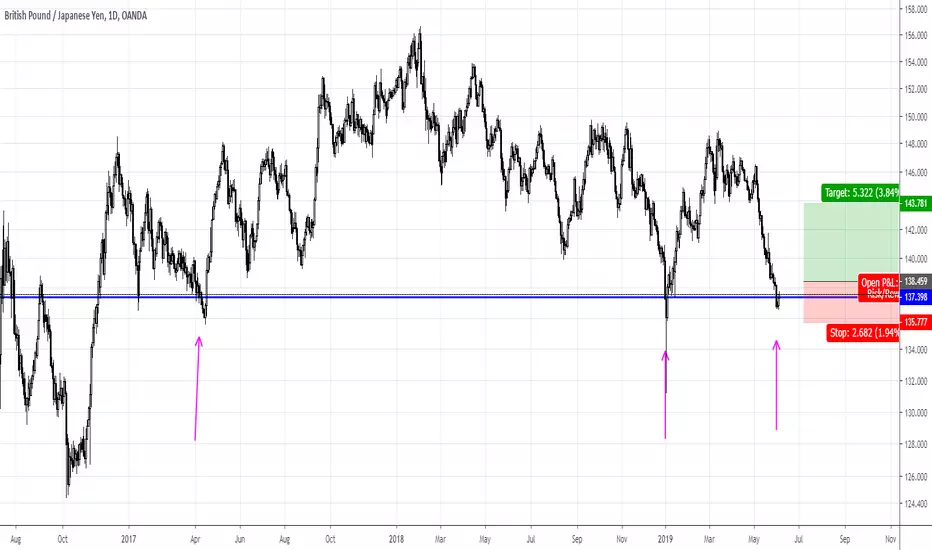
A third bounce?Price has bounced sharply off this price level twice before, it may do it again. look for entry at 138.520 Stop: 135.918 Target: 143.841
Happy trading
Ethereum going to test $300?A daily chart which shows the resistance that ETH is likely to test. I have been long from $164, and believe we are going to test $300.
What do you think? Are we going to test and potentially break the $300 mark? Share your ideas!

LRC may provide 25-50% near term upsidePattern looks very familiar to the ETHUSD triple bottom pattern. LRCUSD third bottom seems to be forming with decent short term upside.
Not financial advice. Do your own research.


ETHBTC Ready to Make Up Ground!!Hello,
Just as I stated in my XRP analysis, that BTC pump caught me off guard just as it did many of you I'm sure.
BUT alts won't play. They are there for a reason.
Crypto veterans aren't going to sit around and hold all of their BTC and not capitalize on the pump.
They will look for good alts to gain even more wealth off of.
Expect ETH and XRP to get some love, as they are actually top players in crypto and on all major exchanges with the most liquidity in BTC pairs.
They are both showing signs of bottom against the BTC bleeding, so take a look!
Or who knows, maybe BTC pumps to 1 million and alts get left in the dust.
Seems... highly unlikely.
Good luck!
- CA$HLESS

Trade Ideas Analysis: EURJPY Triple Bottom2 ways of reading this trade setup, trend traders will read it as the bearish flag and counter-trend traders as triple bottom with RSI Divergence.
As a born counter-trend trader, I'm more into with the latter. I have already engaged the trade and see how this play out.
Great Reward: Risk and not all my decision is just based on that, for this trade there is no recent support level to allow me to have my sell targets to, hence, I will stick with my triple bottom.

XBTUSD 4H/1H charts (4/25/2019)Good morning, traders. Imagine thinking price hit the high and shorting already. Or worse yet, remaining short and not buying the dip yesterday. Of course this is only a sad predicament if you believe price will head higher before heading lower. I continue to remain long at this time. Nothing has changed, in the larger picture, to warn me that I need to exit my long yet.
The 4H chart shows price doing what it was expected to do as part of the re-accumulation scenario. RSI continues to be supported by the ascending line and Stoch RSI has crossed bullishly but is still well in oversold territory. Price is currently testing the top of the resistance level, which marks the top of the TR as shown, while printing a flag. If we take the flagpole as the length from the ST Area to the SOS, then a breakout through the flag's resistance would set up a target at purple ascending channel's resistance around $6300.
The 1H chart shows a potential triple double bottom in the local TR with a target of ~$5615. A close above $5485 would confirm the pattern. This triple bottom is printing after the recent triple top and marks the target of that triple top pattern. Once price clears the descending channel's/flag's resistance, that opens up the much higher target mentioned earlier. With shorts continuing to rise, we can assume that a break above the horizontal red line will begin a short squeeze that could propel price toward the upper target. That $5690 level is the swing high of the supply created in November after price broke down through $6000, and there is little-to-no market interest until around $6300 which aligns with the flag's target.
The vertical red line denotes tomorrow's CME April Bitcoin Futures expiry, with the blue vertical line denoting May's, and the green vertical line denoting June's. As mentioned yesterday, bearish divergence is printing on the daily chart. This would seem to suggest that price should be headed down, however wave structure, patterns, the large ascending channel, and the re-accumulation zone seem to suggest the final pop up before a retracement. It does not guarantee it though. In either case, if you are already in a trade or are thinking about entering one, you should have two plans: the first is your exit if price takes the path you think it will and the second is your exit if price takes the path you don't think it will. If you do not have both plans in place, then you shouldn't be in a trade because you will most likely trade emotionally, especially if price moves against you, and trading emotionally loses money.
Every day, we have a choice to act positively or negatively, so if you get a chance, do something decent for someone today which could be as simple as sharing a nice word with them. You just might change their day, or even their life.
Remember, you can always click on the "share" button in the lower right hand of the screen, under the chart, and then click on "Make it mine" from the popup menu in order to get a live version of the chart that you can explore on your own.
