Initiating a long term bullish position in goldThis is an analysis that I hope that it ages well, as I am starting a long term position in gold today and adding this asset to my investment portfolio. Therefore, this is not a post about an isolated trade, with a specific expiration date or focused on the short-term.
In fact, from a trading point of view I have already lost some great entry opportunities, since November 2022, which the asset provided. Looking back on the chart, I could see four previous entry opportunities that fit my setups. Unfortunately, I wasn't psychologically prepared to trade them and I was left out, but I will try to take some advantage of this situation and later write a study post pointing out these entries. Another post on trading psychology, This is an analysis that I hope that it ages well, as I am starting a long term position in gold today and adding this asset to my investment portfolio. Therefore, this is not a post about an isolated trade, with a specific expiration date or focused on the short-term.
In fact, from a trading point of view I have already lost some great entry opportunities, since November 2022, which the asset provided. Looking back on the chart, I could see four previous entry opportunities that fit my setups. Unfortunately, I wasn't psychologically prepared to trade them and I was left out, but I will try to take some advantage of this situation and later write a study post pointing out these entries. Another post on trading psychology, fears involved, strategies to control them and analysis paralysis may also be written later (spoiler: risk sizing and embracing the risk consciously helps to tame the beast) .
However, from an investment point of view, with a long-term perspective and also taking advantage of some hedging to reduce risk, it is better to buy gold late than never, or as I prefer to say, better late than too late. Because if a strong bull run starts after this breakout, I would regret not buying at the $2000 quote level. And, yes, there are indications that this may become a reality.
The first indication comes from the analysis of the chart, gold prices have been stuck into a multi-year congestion between $1700 and $2000. Tipically, the longer the congestion is, the more intense its breakout and further away the target, and historically gold has been king of this setup. The $2000 level is where the price peaked during the covid crisis and the russian invasion of Ukraine. I mean, this price level is imposing a very strong limit on quotations. But we're now facing the threat of a future interest rate and expected inflation much higher than we've been used to over the last decades (since the 90s, specifically), and these things could be a real game changer for the market scenario. So, here the gold quotes are, back at the $2000 resistance level and showing strong volume near it. Of course, resistance can work once again, but we have to trade probabilities and deal with risk, and that means grabbing a good entry opportunity like this one, and accepting a loss if the signal deviates.
The second indication comes from the analysis of the market cycle. All clues point to the fact that we may already be at the beginning of a secular bear market cycle, which means that expected future returns for the next years (10y average) can be near zero, single digit, or even negative. I'm not predicting some kind of crash here, it's different, this is not a single intense bearish movement, but a future outlook of low stock market growth. Using the model published by Ed Easterling in his book, Unexpected Returns, the top (thus the beginning of the end) of a secular bull market comes with high P/E's, low dividend yields, low inflation and low interest rates. This was just the scenario we had few years ago and it started to crack, first inflation got out of control (2021), then interest rates started to rise (2022) and P/E's just began to fall with last year falling quotes, but it's still on a high level, so this could just be the beginning of this cycle of low returns.
With this in mind, it is important to notice that gold is often the best secular bear market asset par excellence (see the returns in the 2000s and in the 1970s periods), but so far in this newborn bear cycle, gold has yet to shine, despite the very bearish year of 2022.
Considering the secular bear market hypothesis and the very long chart congestion, added to the habit of this asset to make strong breakouts, I decided to initiate a long term bullish position in gold. I made my entry using the ETF GLD. I bought the shares today, March 20th, 2023, at the market opening, @184.17. To manage my risk I also bought a bear put spread with strikes 166/165. I intend to stop the loss if this entry reaches a -6.5% loss. I've bought enough options to pay back my losses if that happens. The protection has cost me 0,8% of the position. Hopefully in the future I will post more about this position, and then I will use the GLD chart. For now, for a general approach, I prefer to do my analysis using the future contract chart.
Triplebottom

MCUSD - Triple Bottom TestMCUSD has formed some nice down channels
Expect more downward movement if the triple bottom along the dashed horizontal line does not hodl

KDAUSD - Triple Bottom TestTriple Bottom along the horizontal dashed line
Price is currently within down channel so it may continue trending downward but this is a good chance for the bulls to show their dominance
4Hr chart

Triple BottomEmbracer may be forming a triple bottom here. Confirmation above the neckline, targets on the chart for 1x, 1.5x, and 2x measured moves up if confirmed.

GOLD/USD triple-bottom confirmed? move to $1840-1850 expectedsimple idea, if a little ugly.
the market is ugly too. when everything else is dangerous, gold starts to look good. this could be a relatively low-risk trade here, even with some low leverage. NFA.
How do you like to get exposure to gold?

INTC - Breaking out of BaseINTC had been basing in sideway range between 24-31 since mid September 2022. It tested the neckline region between 30-31 at least 3 times and similarly the lower range between 24-25+ also 3 times (formed an imperfect triple bottom).
Yesterday it gapped above the neckline on strong volume and in the process, managed to close above the 200 day MA for the first time in a year. It is likely that the stock is now slowly emerging from it's base and any dips in the near future, especially back towards the neckline @30 +/- could be an 2nd opportunity to accumulate. Expect to see the 200 day MA flattening out and a Golden Cross materialising in the coming weeks.
Disclaimer: Just my 2 cents and not a trade advice. Kindly do your own due diligence and trade according to your own risk tolerance and don't forget that money management is important! Protect your trade with stop losses. Take care and Good Luck!

Is INTEL CORP exhibiting signs of a major bottom?INTEL stock has been decimated the last few months, due to growing competition, decelerating revenue and decrease of dividend.
Is it dead though?
Here is what the chart is saying:
Big downtrend since April 2021. On October 2022, the stock has started a consolidation/base in form of a range between 24.90 and 30.85.
This range could be a bottom formation . See also the double bottom on the chart.
Note that bottoming pattern takes time and this one could continue for a few more weeks/months. However a break out of the range (31) could confirm a change of trend and a long trade/investment.
Keep monitoring this stock in the next few days/weeks, set an alert at the top of the range. If it breaks out of the range, it will be time to initiate a long position.
Note that there was a lot of institutional buying in February 2023.
On watch.

BYND - 50% GAINOn the chart, we can see a triple bottom for BYND, which is at its all time low.
Because of these facts, we expect a huge upside for BYND 50% gain from its current price.
RSI is showing a bullish divergence.
More details are shown on the chart.
Good luck!

GOLD - Triple Bottom Pattern !The XAUUSD Price Reached a Support Level and 0.5, 0.618 Fibonacci Retracement Levels !
on the 1Hour Time Frame, The Price Formed a Bullish Triple Bottom Pattern ✔
the Neckline is Broken 🔥
so, I Expect a Bullish Move 📈
i'm waiting for a retest...
-----------
TARGET: 1787.628🎯
___________
if you agreed with this IDEA, please leave a LIKE, SUBSCRIBE or COMMENT!

SCHAND triple bottom breakout with volumeCMP 214.60
Recent Results : Growth in Operating Profit with increase in operating margins (YoY)
Near 52 Week High
Stock gained more than 20% in one month
Strong Momentum: Price above short, medium and long term moving averages
Highest Recovery from 52 Week Low
*Not recommendation. Do your due diligence
S. Chand Group is an Indian publishing and education services companies, founded in 1939 and based in New Delhi. The publishing house prints books for primary, secondary and higher education sectors. It was the first company in India to get the ISO 9001:2000 certification

GBPJPY I Potential bounce from demand zone 🚀
Welcome back! Let me know your thoughts in the comments!
** GBPJPY Analysis - Listen to video!
We recommend that you keep this pair on your watchlist and enter when the entry criteria of your strategy is met.
Please support this idea with a LIKE and COMMENT if you find it useful and Click "Follow" on our profile if you'd like these trade ideas delivered straight to your email in the future.
Thanks for your continued support!

WTBA - Multiple BottomOn this weekly chart, we can see a multiple bottom and are now expecting a huge move to the upside.
From our analysis, we expect a take profit of 24% and target of 50% ROI.
More details are shown on the chart

Weekly RSI DIVERGENCE + TRIPLE BOTTOMWhat more can you ask? :)
* 𝗧𝗵𝗲 𝗶𝗻𝗳𝗼𝗿𝗺𝗮𝘁𝗶𝗼𝗻 𝗮𝗻𝗱 𝗮𝗻𝗮𝗹𝘆𝘀𝗶𝘀 𝘀𝗵𝗮𝗿𝗲𝗱 𝗶𝗻 𝘁𝗵𝗶𝘀 𝗽𝗼𝘀𝘁 𝗶𝘀 𝗻𝗼𝘁 𝗳𝗶𝗻𝗮𝗻𝗰𝗶𝗮𝗹 𝗮𝗱𝘃𝗶𝗰𝗲. 𝗔𝗹𝘄𝗮𝘆𝘀 𝗰𝗼𝗻𝗱𝘂𝗰𝘁 𝘆𝗼𝘂𝗿 𝗼𝘄𝗻 𝗮𝗻𝗮𝗹𝘆𝘀𝗶𝘀 𝗮𝗻𝗱 𝗿𝗲𝘀𝗲𝗮𝗿𝗰𝗵.

AUDJPY - New Breakout!The AUDJPY Price is in 0.6 FIB LEVEL & Double Bottom Pattern 🧐
the key level (Lower high) is broken.
so, i expect a bullish move 🚀
i'm waiting for a retest...
TARGET: 92.580
...
if you agreed with this IDEA, please leave a LIKE, FOLLOW or COMMENT!

GBPCAD - Important Breakout 📈The GBPCAD price is in Bullish Triple Bottom Pattern 🧐
The Daily Resistance Line is broken 🔥
so, i predict a bullish move 📈
i'm Waiting for a retest 🧐
TARGET 1: 1.64434
TARGET 2: 1.66624
...
if you agreed with this IDEA, please leave a LIKE, FOLLOW or COMMENT!

RNDRUSDT, Wait for PullbackHello guys,
Triple bottom TF 1W,
Breakout Neckline,
Wait for Pullback Neckline

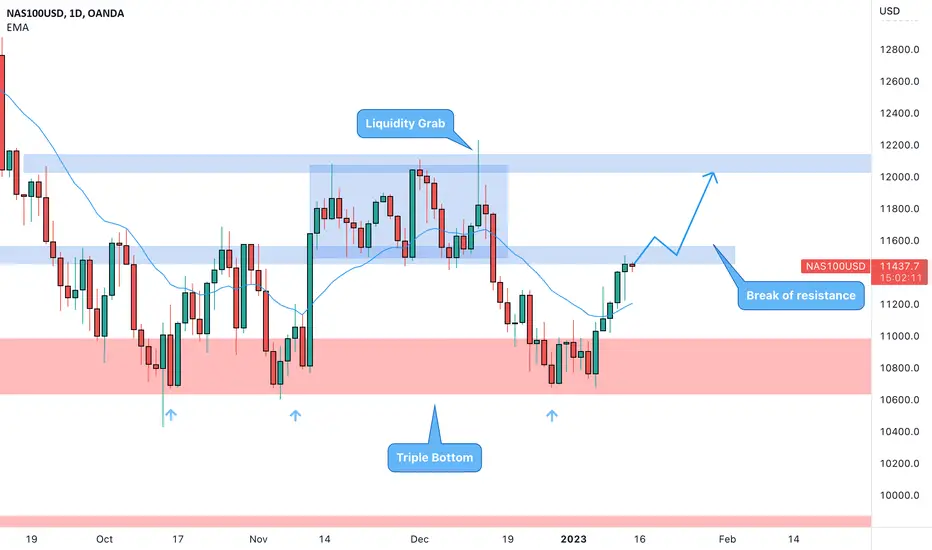
NASDAQ can move higher? 🦐NAS100USD on the daily chart has created a triple bottom.
The market tested a few times the weekly support at the 10700 level and we notice how after the first 2 tests the market went up for a distribution phase.
It is interesting to see the liquidity grab before the next bearish leg to the support where, also thanks to the recent news we had a new inversion at the support level.
How can i approach this scenario?
Being Friday it will be risky to open a position but IF the price will break above the resistance area we can set a nice long order according to the Plancton's strategy rules.
–––––
Follow the Shrimp 🦐
Keep in mind.
🟣 Purple structure -> Monthly structure.
🔴 Red structure -> Weekly structure.
🔵 Blue structure -> Daily structure.
🟡 Yellow structure -> 4h structure.
⚫️ Black structure -> <4h structure.
Here is the Plancton0618 technical analysis , please comment below if you have any question.
The ENTRY in the market will be taken only if the condition of the Plancton0618 strategy will trigger.
USDCHF Long Position: Bullish WaveUSDCHF is ready to go bull.
I am anticipating a Motive Wave on the up-side.
Because of how it started, I am expecting an Ending Diagonal in Intermediate (C)(turquoise).
GOLD (XAUUSD), EURUSD, USDJPY and DXY are all showing Reversal Patterns.
Time to trade Wave Jedi!
My Swissie Technicals:
* Ending Diagonal in Intermediate (C) (red)
* Flat Correction in Intermediate (B)(turquoise)
* Hidden Bullish Divergence
* Harmonic Pattern: Bullish Cypher in Minute b (white)
* Triple Bottom Pattern
* 88.6% Fibonacci Retracement
* 127.2% Fibonacci Extension
USDCHF LONG Signal:
* Entry @ 0.9220
* SL @ 0.900
* TP1 @ 0.9560
* TP2 @ 0.9700
* TP3 @ 0.9785
* Safety Measure: when in the green, moving SL to BE.
* BUY Stops on the way up, after pull-backs.
Many pips ahead!
Richard, the Wave Jedi.

NAS100 Simple Chart Analysis Nas100 - Rst 12180 Supp 10674
During a year period of downtrend, we notice that 10674 is the only area being strongly supported with trip bottom pattern. If this area does not broke, i do believe market wave will continue to move towards a big rounding bottom back to highest rst 16590 area.
The risk to fail this recovery pattern will be the rise of CPI data. That's the only concern.
My 2023 Pick For US Counter as below
META
TQQQ
NETFLIX
AMD
BA

GBPUSD | Perspective for the new weekThe last year closed on a sour note for the British pound as hopes of a significant recovery during the last quarter diminished to close at the 1.21000 zone. In this video, we looked at the chart from a technical standpoint where we identified a simple structure within the 1.21000 and 1.20200 zone as price action transitioned into a reversal pattern on the 4H timeframe hereby presenting us with bullish opportunities in the new week. And as all eyes focus on the first NFP of the year coming up this week, we shall not ignore the option of a bearish move if price actions break below the 1.20200 level.
Disclaimer:
Margin trading in the foreign exchange market (including commodity trading, CFDs, stocks etc.) has a high risk and is not suitable for all investors. The content of this speculation (including all data) is organized and published by me for the sole purpose of education and assistance in making independent investment decisions. All information herein is for your reference only and I take no responsibility.
You are hereby advised to carefully consider your investment experience, financial situation, investment objective, risk tolerance level, and consult your independent financial adviser as to the suitability of your situation prior to making any investment.
I do not guarantee its accuracy and is not liable for any loss or damage which may result directly or indirectly from such content or the receipt of any instruction or notification therewith.
Past performance is not necessarily indicative of future results.

MY VIEW ON GOLD/XAUUSDMy view on OANDA:XAUUSD
Gold has been in a Bear Run for a while, printing LLs and LHs, following the significant trend.
Now:
Gold has broken its significant trendline with a big green candle showing the heavy buyers in charge, and RN it is around the Neckline(check analysis).
Plan A:
Sell from the neckline if see any bearish signal
Plan B:
Buying after the neckline breakout or when it gets retested after the breakout.
Trade your levels accordingly.
Your feedback would be appreciated and you can also share your analysis on Gold.
Best of Luck!

Ford is sitting on multiple supportFord is in critical situation sitting on both 50 EMA and 100 SMA in weekly time frame. There is clear support below this moving average lines

ULTA BEAUTY has had a long uptrend with good strength relative and excellent recent earnings.
On the chart, price has risen persistently and consistently
from a triple bottom in late September through October
The stay-at-home economy is over. Beauty and so cosmetics are back.
ULTA should benefit from holiday buying and gifting
Looking at long time frame charts. ULTA is now at its
all time high. nothing but blue sky above
Looks like a decent candidate for call options to me.
