$BHTG TRIPLE BOTTOM$BHTG TRIPLE BOTTOM
Patterns repeats...
BioHiTech Global, Inc., through its subsidiaries, provides technological, biological, and mechanical engineering solutions of organic and municipal waste worldwide. Its suite of technologies includes on-site biological processing equipment for food waste, patented processing facilities for the conversion of municipal solid waste into renewable fuel, and proprietary real-time data analytics tools to reduce food waste generation. The company also markets Revolution Series Digesters, an aerobic digestion technology solution for the disposal of food waste at the point of generation; and High Efficiency Biological Treatment Resource Recovery Technology to process waste at the municipal or enterprise level. In addition, it offers BioHiTech Cloud and Cirrus mobile applications for digester customers. Its principal customers include producers of food waste. The company serves healthcare, grocery, prison, retail food service, education, and hospitality sectors, as well as food distributors, convention centers, hotels, restaurants, stadiums, municipalities and academic institutions, and stadiums. BioHiTech Global, Inc. is headquartered in Chestnut Ridge, New York.
Triplebottom

BTC BULLISH BAT PATTERNBitcoin has been consolidating around the 88.6 fib level of the bat pattern. If you notice it has hit that area 5 times and every time it gets rejected(BULLISH) it is currently printing a higher low. For better confirmation wait for price to brake $42k . Good luck!


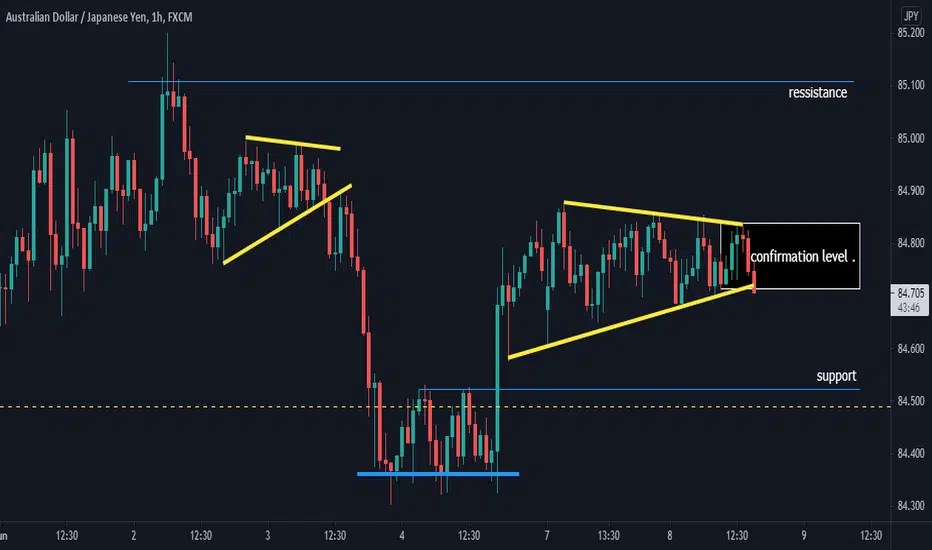
intraday chart pattern price made triple bottom at the blue horizontal support. now it is making sideway correction in form of triangle chart pattern ready to breakout
wait fore clear breakout .

All this bottom talk.... on to a triple bottom?????tired of explaining just look at the chart... the internet is undefeated, with new BTC addresses down this could take a tumble but not sure I am quite there on a 24/25k level yet..

Illuminia ILMN triple bottom reversal breaking out
This could be a triple bottom or an inverse head and shoulders depending on your interpretation. Seems today this broke out of both formations and had a failed attempt to get through a very nearby resistance at $431.19
I'm a buyer with a close at $432 or above but also wouldn't be surprised to see a slight pull back to the head and shoulders line of the $420 range for a second entry opportunity. It should act as a support level now the shape is broken.
For extra encouragement it looks like 21 day and 50 day SMA are due to cross. Also worth waiting for this move to play out before entering. For those of you with a preference for EMA I'm guessing it already crossed but check for yourself.

IS ETC READY FOR BLAST OFF? #BLESSEDPIPS WITH A STRONG HOLD AT SUPPORT AND A LOT OF POSITIVE CRYPTO NEWS THIS WEEKEND. THINGS ARE LOOKING POSITIVE, LETS SEE WHAT HAPPENS.
#BLESSEDPIPS

Continued Wyckoff Accumulation Change in Plans In my earlier post about Wyckoff I estimated that the total corrective wave would have played out earlier. However it looks like the first wave was extended a lot to the low on the 28th of March. As of now I extended Phase B a little more to make sure the essential waves are in play before we head on to Phase C. Last night we found support on the 0.5 fibonacci trend-extension (the trend of the high of march 27th to low march 28th to high march 28th). After this is rallied back to the .618 fibonacci of the very first wave of phase B. This also created a double top *, which in most cases is a bearish scenario when there is a close below (3) around 34,900. When this happens we could see a drop to the .786 of the earlier mentioned fibonacci trend extension, or in the worst case scenario we could go for a test of the support line.
At the moment of writing bitcoin is also testing the .382 of the first wave, when this holds a triple bottom is created which is a bullish scenario when it closes above the double top mentioned before. Just keep the two scenarios in mind. When there is no breakout into either direction a trading range can be established over the weekend and could result in a volatile Monday.
* the double top is also supported by a 1.272 fib trend extension of the last 6 weeks. In the chart below you can also see that the target of Spring is somewhat at the same level of the 1.618 extension.

TUP breaking out of the sideways price actionNYSE:TUP is expected to go march higher. Anticipated price action and targets are shown on the chart, stop daily close below 50 MA.
Hit the like button please if you find this useful :)
This is only my own view and not a financial advice, do your own analysis before buying or selling
Happy Trading!

GBPUSD Triple bottomGBPUSD is currently retesting a support area, we can expect the price to at least go back to the nearest local high.

ANKR daily looking primed ANKR
Daily chart here looking like we have a bull flag / triple bottom in the making. Targets will be back to .13/14 range of resistance
From there back to the all time high of .21 then the .618 fib. I feel when we get to that point it runs we will break above the top of the Fib an run towards $1 on the spike/wick before we come back down to the mid .60 range on the first burst. This should start to come to fruition over the coming days and weeks. Unless bitcoin gives us all a middle finger.

Buy Signal on BTCUSD (Bitcoin)Am anticipating that big move. Guys just find your entry point and hold. It's a very high probability trade I've been waiting for it for weeks.


GRTUSDT Bullish viewGRTUSDT formed triple bottom and breaks the trendline supporting with rsi which forms higher highs. so i go for long position here. if you like my idea consider it otherwise please ignore it .
#mrspray

SYRS- Potential beginning of the bullish trendFollow me and smash that like button! Bio-pharmaceutical company aims to treat cancer and genetic diseases. Not the investment. Please do your own due diligence.


DOGE Triple bottom pattern formingBefore DOGE reached $0.7 last week, there was a double bottom pattern.
Now a "triple bottom" pattern is forming. Let's see if it actually goes up and breaks through to reach $0.6 - $0.7 again


Push-Posh-RepeatKey points
1. 3ple bottom with rsi divergence on 4h
2. Upcoming earnings with the stock already -60% from ATH
3. Low free float with high short ratio >30%
4. Insiders lock up period coming in July, i do not believe they would like to sell at these levels
5. If not inflate quarter results now! when???

Triple Bottom ADRO (with Bullish Divergence)There is a breakout with pattern triple bottom and bullish divergence on stochastic (5,3,3) maybe this time ADRO would be bullish at least 1400 #disclaimeron ✌️

Reliance Rocket - Triple Bottom FormationReliance already tested Support levels 3 times and made a good upside swing. It can touch 2100 levels in next week.

Triple Bottom BounceAs Bitcoin continues to hold the support level of $53k, a triple bottom seems to be forming which is a bullish signal showing significant interest to buyers and a trend reversal could be approaching, further being supported that sideways price action and low volume usually indicates that a major move is imminent. If volume begins to increase and price moves towards the neckline we can expect a breakout towards $65k again. Bitcoin has been respecting the 50 day moving average since the beginning of October 2020, this being the first time we've had a daily closing candle below, In previous market cycles this has occurred which then resulted in a significant move back above and beyond which happened in the 2017 bull cycle . The MACD averages seem to currently be respecting each other which doesn't indicate any selling signals as of yet on the 4 hourly . The violent downwards move could be explained by the recent increase in news stating that the current bull market is coming to an end which triggered multiple people to sell which then lead to multiple liquidations longing after we managed to break an all time high. There is a possibility $65k may have been one small market cycle top while another may happen later this year after we trend downwards for several months. Instead of this I believe Bitcoin will finish with a blowoff top considering the amount of institutional inventors involved now preventing the price from falling significantly.
