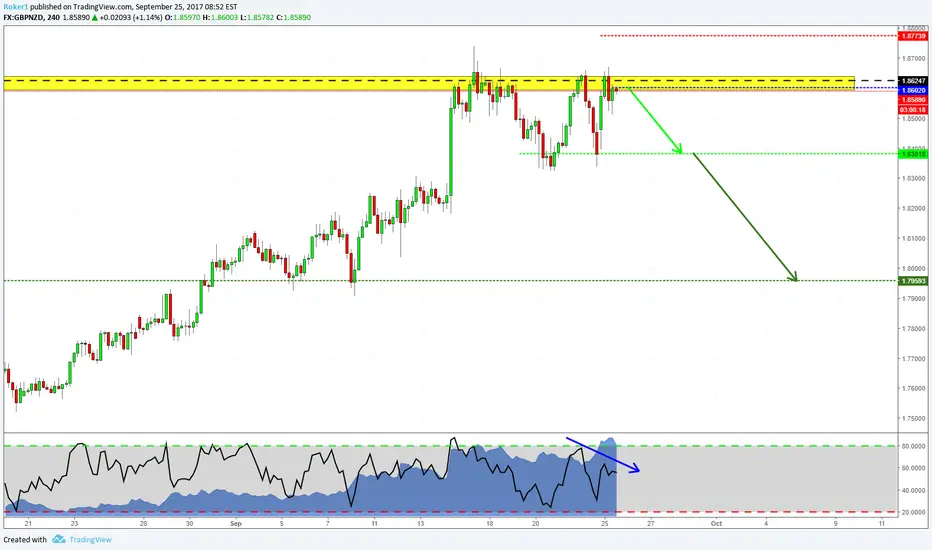
GBPAUD DailyAfter price made a false breakout, now we can see price may be coming up to make a triple top, where ill be watching for a rejection candlestick to enter short or a clean breakout & retest of the ascending trendline for entry.. Patience is key
Tripletop

Outside Bar pattern EURUSD was rejected by a weekly resistance zone last week (structure, trend line, harmonic pattern)
The resistance zone and the triple top pattern sent EURUSD down - Forming Outside Bar pattern that will be in focus this week.
EURUSD will have to break the support zone to continue lower
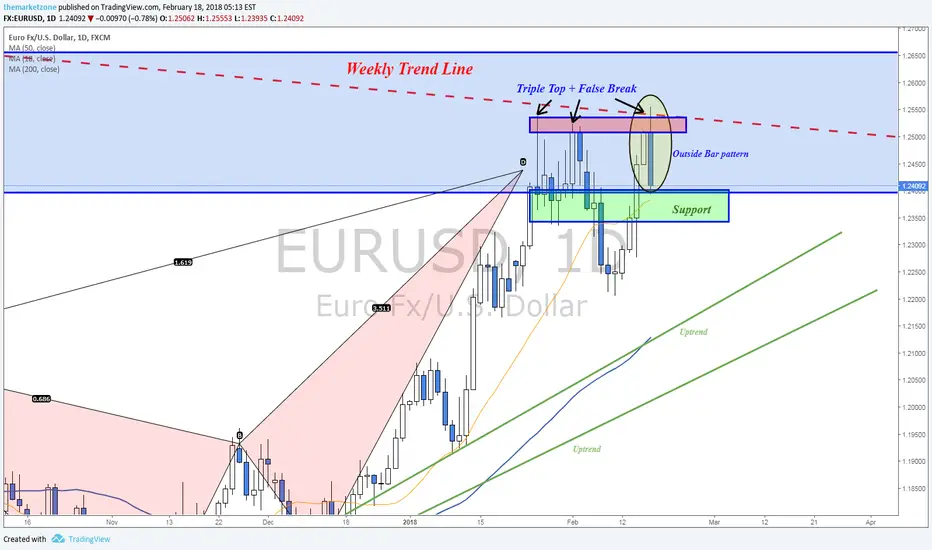
EURUSD Artificial Triple Top?EURUSD went into a rally late December which continued in January as expected and hit resistance on January 25 UTC. Its strong momentum and the speed at which it was punching through each price level let one think that resistance at 1.25 would break.
The first hit on January the 25th UTC was actually already a triple top on it's own, if viewed on the 5m time scale. On the scale of days this first hit looks like not more than a touch and barely qualifies to form a triple top with the tops on February the 1st and 15th. Nevertheless, both signal well trained technical analysts to believe its preparing for reversal.
On February 15, 7am UTC I so happen to have my eyes on EURUSD and AUDUSD and could closely monitor the rally both went into. It was like someone had given them a kick with a hammer for a sprint to the top. Both rallies stopped and I noticed the system had enabled its price control process which in this case acted as if the market floated freely but a experienced traders often notice when it's been switch on and off.
Another event that leaves me with a whole bunch of questions, such as:
1) Was it a natural interruption of the drop of the USD or was it set up by the controlled mode of the market?
2) If it was set up, then by who and why?
3) Have more corrections taken place this week and are these such as marked in the chart?
4) Were there perhaps similar corrections back in December and November? Back then significant USDJPY drops were interrupted and price was restored?
5) Are there economies that suffer from corrections like these?
6) COT data reports nearly 70% net long on EUR, which has been going on for a while. Is it possible that the USD simply had no chance to recover due to its bearish sentiment as prepped by the charts?

XAUUSD DAILYPrice at a very strong supply zone, where as you can see each time price tries to break though sellers quickly push price below, showing bears are applying a lot of pressure to this zone.

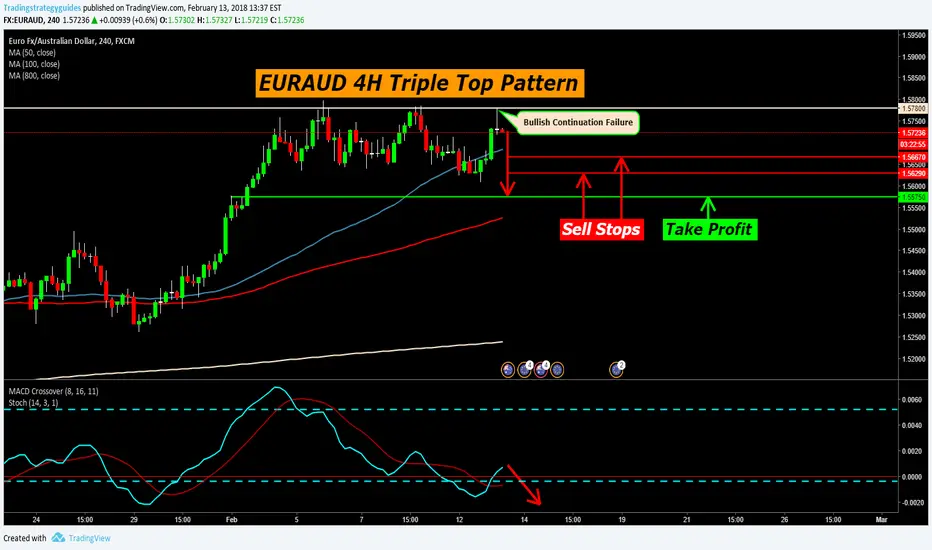
EURAUD 4H Triple Top PatternPrice tried to breakout of double top resistance and make higher highs. Breakout failed and is creating a bearish candle pattern.
Sell Stops are listed
Take Profit is listed
Macd is currently in a buy position being above the 0 level line.
Bullish Continuation Trend failed
Possibly will make Macd fall below 0 level line
Macd will be my stop loss if below 0 level line
If Macd goes above 0 level close out sell trades
If Macd is below 0 level confirmation of sell trades.

BTC Triple Top forming? I'm about to call a classical Triple Top. Volume declines, momentum declines. IF(!) 8600 will be rejected and we will brake support it will be confirmed. Target 6700. Stay tuned

Triple TopExpect it to keep dropping if it couldn't find support at the 200 EMA. It's now found a new support at 0.0004902. Good time to take a position in my opinion.

XLM/ETH - Tread Carefully!We are looking at a solid run from XLM after a disastrous month. But be wary since a reversal may come soon. A look at XLM's most recent pattern - the triple top reversal. Volume has been pumping since the 22nd of this month but as you can see that from the peak of the 25th, volume has been on a steady decline. Be forewarned that if we do not see volume pumping propel prices past the 00.00060814 resistance line, then we are likely to see XLM spiral downwards to 00.0055238. If prices fail to bounce off support of 00.00055238, then the triple top reversal is confirmed. We are likely to see it plummet to as low as .00048988 before it will come back up to retest the 00.00055238 new resistance line. I would stay away from entering until XLM decides which direction it will go.

BABA - Triple-topping: What to do with the upcoming earnings?BABA’s exceptional run seems to be triple-topping. While the long-term trend remains up, the short and mid-term pictures look like they have turned to the downside. The company should announce earnings on Feb 1 before market open and I would wait for this catalyst to go long, just in case any fundamental disappointment should take us lower to confirm the poor, current technical picture. In line with the strategy I proposed on NFLX (see below), the game consists in buying synthetic upside exposure ahead of earnings. If the stock breaks out, you will be exposed to the upside. If the stock remains range-bound, you will lose a small premium. If the stock disappoints and tanks, you could decide to lose your premium or to sell a put to make your lost premium up.
1. BUY BABA Feb 16'18 $182.5 CALL = $6.90 (3.78%)
OR
2. BUY BABA Feb 16'18 $192.5 CALL = $3.32 (1.82%)

EURUSD 4H *Pattern*We have a triple top created on the EUR with great convergence with the RSI respecting a simple resistance at around 60% . If the triple top plays out and still fits my idea after market opening this evening, there is no reason this pair cannot fall to the 1.21500 supply area and further to 1.20711 support. Although we do have to take into consideration the weakening of the Dollar at the moment.

PIVX Putting Up A FightPIVX is forming a classic pattern. We have 2 scenarios. A preferred scenario which is current, or alternative scenario which is possible.
First we notice a short term double top. Market did correct in past few days but this is normal with every market. Don't call the sky is falling. It's not, well at least not yet.
Scenario 1: Light Blue: Nice noticeable flag pattern. A pole to commence wave 1, a zigzag ab=cd pattern Wave 2, and a commencement at flag break out of wave 3, with a 5 wave expected expansion. This is what we want!
Scenario 2: This current trend could also meet a rectangle ab-cd which means current price and still fall away to challenger the bottom of AB wave. If this does we need to look for divergence on MACD, then some volume to support a candlestick reversal. Remember this can then challenge the top of this pattern. If it breaks out, the trend will begin to either form a triple top, or pass through to extend.
Key notes:
-Triple top is not out of the question.
-Scenario 1 means we could be in the beginning of a wave 3. (currently in waves of lesser degree within wave 3)
-Scenario 2 means this could still drop, at that point look for divergence and volume
Please leave feed back. I love to continue learning so feel free to send constructive criticism.

ETHUSD 2H TRIPLE TOP ASCENDING TRIANGLE Pair just had a bearish breakout of an ascending triangle lower trendline.
Watch 15m for a break-hook-go to confirm bearish move
Watch hook portion if price returns into triangle as a head fake
1st bearish take profit fractal/swing low
2nd bearish take profit swing low

Short USDCAD in 1D TimeFrame.i think we have a Triple top here, and if price break 1.265 we can pull trigger for short position.

TRIPLE TOP Ascending Triangle ETHUSD 1HIF THIS HAPPENS - THEN WHAT?
This is a bullish chart pattern but price could have a bearish breakout.
Entry on 15m charts with break-hook-go
Bullish breakout- buy stop and TP as shown
Bearish breakout of lower trendline TP ! and TP 2 as shown

AUDUSD Possible Forming Triple TopAnalyze AUDUSD on his uptrend looks like will forming triple top on strong resistance. Possible break the trendline and pullback to that resistance.

GBPUSD TRIPLE TOP OPORTUNITYEncuentro una buena oportunidad en corto de GBPUSD donde localizo un triple top en una fuerte resistencia . el 61.8% de Fibonacci coincide con el soporte del canal donde nos estabamos moviendo en TF4H.
I find a good short GBPUSD opportunity where I find a triple top in a strong resistance. the 61.8% of Fibonacci coincides with the support of the channel where we were moving in TF4H.


EURJPY POSSIBLE RETRACEMENT.Multiple bearish divergences on CCI support the analysis. Also a possible double or triple top as a reversal pattern might be the signal of the bearish prediction.
-------------------------------------------------
Constructive Critics are well received.
*I appreciate your feedback.
Thank you.

usdjpy triple top pattern nearly confirmed short.usdjpy has just formed two top pattern and by the looks of it, it should hopefully form a third one in which will hit the trend line and either retrace back.
OR
it could possibly hit the second green support line and maybe retrace back to previous green support level.
this goes back to my previous analysis I made recently, check it out guys.

Triple top downside breakout LTCBTC trading plan.
The general alt context is the one of a very strong correction. Some major cryptos broke (yet) historical support levels, LTCBTC -4.43% just broke the 0.010 line that supported the price since may.
It confirms the Triple top pattern. The trade has, seen the context and the major break, an high probability of success. We well use the maximal amount of money allowed by our money management.
Black lines on the Charts represent the different magnet levels given by ichimoku (Use higher TF flattened SSB -0.22% levels), the -20% level is the target given by the Bulkowski rules for tripple top patter trading.
We enter now as the break happened and add on pullbacks till 0.010 AND on rebreak lower. This alt counter rally is EXTREMELY strong. I see no or few pullback coming. Stop slightly above 0.010. The plan is to trade only this leg down for the moment.
Trade risk reward is around 3.
We'll be cautious around 0.0084 as a resistance stands at this level.

Intel is breaking outShares of Intel Corp. (INTC) are breaking out of a triple top on the weekly chart going back to the end of 2014. Potential upside targets are around $41.5 in the near-term and $46 in longer-term when using the 127.2% and 161.8% extensions, respectively. Support around $38 needs to hold to confirm the breakout.

Triple Retest of StructureHi guys,
very simple setup: we can see a triple retest of the same level, that is a daily structure level. Every time the price reached that level it did with lesser and lesser strength: therefore i can go short, with stops above highs and targets as shown on the chart here. Remember to take a look at my videoanalysis (link down below) if you want more.
If you want to share your view/idea, feel free to comment below.
Otherwise, see you in the next chart!