Triple top formation on EURUSD.Take a short trade on EURUSD. It is high chance to retest previous support after the formation of TRIPLE TOP. Set your TP target around price 1.15786 and SL around price 1.16355
Tripletop

EURUSDMy last week Biast was still bullish, since we saw a weaker USD, but i see a break to the downside, from the triple top, waiting for a re-test to the neckline then waiting for a push down... what's your take on this pair?? tag me on your analysis

GBPUSD - Potential Reversal to follow weekly downtrend?GBPUSD - Rejection or break...
Price is currently sitting near the bearish weekly high (Light grey box), I'm expecting price to reverse from here based on PA..
However price is looking strong and and could reject from the quaterpoint and start breaking to the updside...
Let's see what today brings, we have EQL highs, triple top (Which probably will be taken out, but if price rejects the quaterpoint I will scalp this long, if it breaks and reverses below I'll take it short. (Ideally I'm looking for a SL hunt/4th hit to the high before price reverses)
Whats your thoughts?

Gold: Triple top or Double bottom 🦐Gold on the daily chart shows both signals of inversion, double bottom and triple bottom.
The price is now trading near to a weekly structure and we can see 2 possible scenarios.
If the price will break above we will look for a long position according to Plancton's strategy.
On the other hand if the price will move lower we will search for a short position.
--––
Follow the Shrimp 🦐
Keep in mind.
🟣 Purple structure -> Monthly structure.
🔴 Red structure -> Weekly structure.
🔵 Blue structure -> Daily structure.
🟡 Yellow structure -> 4h structure.
⚫️ Black structure -> <4h structure.
Here is the Plancton0618 technical analysis , please comment below if you have any questions.
The ENTRY in the market will be taken only if the condition of the Plancton0618 strategy will trigger

GBPNZD | Perspective for the new week | Follow-up detailsWe experienced over 300pips run in our direction since my last publication on this pair (see link below for reference purposes).
Now, it is obvious that a trading range has been hemming broadly within the N$1.93500/1.97000 since the emphatic breakdown of the Demand level late in the month of August 2021. At this juncture in the market, I shall be looking forward to a reversal pattern within the Supply zone at 61.8/78.6% retracement of the impulse leg to incite a risk of further decline in price in the coming week(s).
Tendency: Downtrend (Bearish)
Structure: Breakdown | Supply & Demand | Channel | Reversal pattern (retracement levels)
Observation: i. Since the beginning of the year (2021), It has been a Bullish run for the Pound before hitting a peak @ N$2.00500 (between June and August 2021) - a zone characterized by a triple Top look-a-like.
ii. This feat was later followed by a significant Breakdown of a Level that held price "supported" between June and August 2021 to allow a bias shift in favour of the bears in the coming week(s).
iii. TRIPLE TOP: formation of three peaks moving into the same zone @ at approximately N$2.00000, with pullbacks in between is considered complete when the price broke down pattern support @ N$1.96000 on the 31st of August 2021, hereby indicating a possible further price slide in the nearest future.
iv. Even as a Bearish perspective is building upon this pair, it is required that we sprinkle the tempo of opening a bearish position with a little bit of patience as we are yet to get a signal to go short.
v. This been said; I shall be looking forward to a reversal pattern within the Supply zone around N$1.97000/1.989500 and this might share a confluence with a 61.8/78.6% retracement of the Impulse leg (Breakdown of Demand zone) to transition into a possible Harmonic pattern (AB = CD).
vi. The early hours/days of the new week might see a price climb before inciting a further decline.
vii. If a climb happens, I have identified a niche around N$1.97000/1.989500 for selling opportunities with confirmations right below the Key level @ N$1.960000 area... This is a volatile pair hence trade consciously!😊
Trading plan: SELL confirmation with a minimum potential profit of 300 pips.
Risk/Reward : 1:4
Potential Duration: 5 to 15days
NB: This speculation might be considered to make individual decisions on the lower timeframe.
Watch this space for updates as price action is been monitored.
Risk Disclaimer:
Margin trading in the foreign exchange market (including commodity trading, CFDs, stocks etc.) has a high risk and is not suitable for all investors. The content of this speculation (including all data) is organized and published by me for the sole purpose of education and assistance in making independent investment decisions. All information herein is for your reference only and I take no responsibility.
You are hereby advised to carefully consider your investment experience, financial situation, investment objective, risk tolerance level, and consult your independent financial adviser as to the suitability of your situation prior to making any investment.
I do not guarantee its accuracy and is not liable for any loss or damage which may result directly or indirectly from such content or the receipt of any instruction or notification therewith.
Past performance is not necessarily indicative of future results.

GOLD can break the daily support soon 🦐GOLD after our previous analysis broke below the weekly support and moved to the next structure.
The price after the triple top is now testing the new support area and according to Plancton's strategy if the market will break below we will set a nice short order.
--––
Follow the Shrimp 🦐
Keep in mind.
🟣 Purple structure -> Monthly structure.
🔴 Red structure -> Weekly structure.
🔵 Blue structure -> Daily structure.
🟡 Yellow structure -> 4h structure.
⚫️ Black structure -> <4h structure.
Here is the Plancton0618 technical analysis , please comment below if you have any questions.
The ENTRY in the market will be taken only if the condition of the Plancton0618 strategy will trigger

Education excerpt: Classic Chart FormationsIntroduction
The part of technical analysis studies chart patterns. Rationale behind this practice is that chart patterns have fractal nature which represents ability of a trend to act similarly over different time periods. Chart patterns are basically configuration of price that is bounded above and below. Boundaries are commonly derived either from a line or a curve. Lines, for example, can be represented by simple horizontal lines or trend lines. Curve, on the other hand, is rather reminiscent of an arc or a bow in its shape. Boundaries in chart patterns can often act as support or resistance. All chart patterns have their development stages. There is first stage which describes the trend preceding the formation and then there is second stage which usually triggers the signal for action. In the first stage of pattern formation analyst merely observes price action and waits for signal to be triggered. This stage can also be called setup. The second stage then begins with signal being triggered. Trigger can, for example, come in a form of a crossover (by indicator, price, etc.) or breakout. In this stage analyst takes action and either enters or exits the market. Entry can be placed from above or from below. Similarly, exit can be downward or upward. The variables of entries and exits are statistically important because some combinations of entries and exits tend to produce better results than other combinations of entries and exits. The chart patterns can be subdivided in two groups: continuation patterns and reversal patterns. Continuation patterns are associated with continuation of trend that was present prior to the formation of a continuation pattern. On the other hand, reversal patterns are associated with reversal of trend that was in place prior to the formation of a reversal pattern.
Double Top and Double Bottom
Double top and double bottom formation is very simple pattern that is well known to many professional and retail traders. It consists of three reversal points. For double top these reversal points are: two peaks and one trough. Opposite to that, for double bottom formation reversal points are: two troughs and one peak. Price enters double top formation from below and double bottom formation from above. Peaks in double top and troughs in double bottom should not be apart from each other’s price level more than 5%. Double top and double bottom normally forms over two to six weeks. If formation takes longer then it starts becoming less reliable. Double top is valid only when point separating two peaks was penetrated. Similarly, double bottom is valid only when point isolating two troughs was penetrated.
Illustration 1.01
Picture above depicts graph of General Motors stock on daily timeframe. It is observable that price touched resistance line twice before reversing to the downside.
Rectangle
Rectangle is simple pattern that is bound by two horizontal lines that are parallel to each other. These lines acting as boundaries are called: support and resistance. Each boundary must also be a trend line. That means it must touch approximately same price reversal level at least twice. This particular requirement is what separates it from a double bottom or a double top formation. Price tends to oscillate between two bounds in the rectangle pattern. Then trigger comes in a form of breakout above resistance or below support.
Illustration 1.02
Picture above depicts graph of Pepsico stock on daily timeframe. It is observable that price action is sideways in this example. Price oscillates between resistance and support lines with occasional false breakouts below support.
Triple Top and Triple Bottom
The triple top and bottom pattern is bounded by horizontal line similarly like double top and bottom formation. However, this pattern differs from double formation in that it has three touches to the support or resistance line instead of just two touches. Triple top and bottom tends to occur with lower frequency in comparison to the rectangle and double formation. In triple top each peak should be roughly at the same level and each peak should have similar shape. Confirmation for triple top comes once troughs are penetrated to the upside. Triple bottom is basically mirror image of triple top and confirmation comes once breakout above peaks takes place. Pullbacks are very common for this formation and they tend to reduce breakout potential.
Standard Triangle
Triangle pattern is bounded by two lines that are crossing each other when they are extended to the future. Triangle pattern has its base and apex. Point of collision between two lines is called apex while base is basically a distance between the first high reversal point and the first low reversal point within triangle pattern. This pattern should consist of least two touches to the support line and another two touches to the resistance line. Standard triangle can be either symmetrical or ascending, or descending. Symmetrical triangle is considered to be continuation pattern while ascending and descending triangle is mostly regarded as reversal pattern. In symmetrical triangle both boundaries are at slope. In ascending triangle only lower bound is at slope while upper bound is horizontal. Contrary to that, in descending triangle upper boundary is at slope and lower bound is horizontal. These patterns are validated once breakout above or below boundary takes place. Another form of confirmation comes when breakout from an apex of triangle occurs.
Illustration 1.03
Picture above shows daily graph of TSLA stock. Formation of symmetrical triangle is observable.
Diamond top
Diamond top formation is rare broadening pattern that is very difficult to observe. It combines two triangles and can be imagined as mirror image of triangle pattern followed by triangle pattern. Price range increases and then decreases throughout this formation.
Wedge
A wedge pattern is simply a triangle pattern with both trend lines being at slope and pointing to the same direction. There are two types of wedges: a rising wedge and a declining wedge. A rising wedge consists of trend lines that point upwards while declining wedge contains trend lines that point downwards.
Illustration 1.04
Illustration above shows daily graph of DAL stock. It is visible that confirmation came after breakout above upper bound. After that price continued to rise. This pattern is very bullish once confirmation occurs.
Rounding Top and Rounding Bottom
Rounding top and bottom patterns are longer term formations that are bounded rather by an arc than horizontal line. Rounding of the pattern usually spans over long time and it tends to contain short term trends within its formation. Another interchangeable name for these formations is: saucer or bowl, or cup. There is also variation of this pattern that develops over shorter period of time and it is called scallop. Volume in rounding top tends to gradually increase as price increases towards the peak of the formation. Then it tends to fall as price decreases from the peak. Similarly, in rounding bottom volume tends to decrease as price is approaching a low. After that volume tends to increase as price starts to rise from a low.
Head and shoulders
Head and shoulder pattern is one of the most famous chart patterns with statistical significance and very high profitability. It is complex pattern that combines trend lines, support or resistance lines, and rounding. Head and shoulders pattern is normally preceded by uptrend while inverted head and shoulder formation is preceded by downtrend. This pattern is considered to be reversal pattern where head and shoulders is topping formation and inverted head and shoulders is bottoming formation. Pattern's structure consists of head, shoulders and neckline. Head is either high in topping formation or low in the bottoming formation. Neckline in topping pattern is simply trend line which connects two troughs that separate head and shoulders. In bottoming formation neckline connects two peaks that separate head and shoulders.
Illustration 1.05
Picture above shows daily graph of Pepsico stock. Inverted head and shoulders pattern is obsrvable bottoming head and shoulder pattern is formed by three troughs. The second trough must belower than the first and the third trough. The first trough is called left shoulder and third trough is called right shoulder. Middle trough is called head. Shoulders do not have to be the same height. Because of that neckline can be at slope in head and shoulder formation. Confirmation in this pattern comes once neckline is penetrated.
Disclaimer: This content is just an excerpt from full document that will be available later with full range of illustrations and more detail. Purpose of this content is education.

Classic Chart Patterns That You Need To KnowHello everyone, as we all know the market action discounts everything :)
_________________________________Make sure to Like and Follow if you like the idea_________________________________
In today’s video, we are going to learn the Classic reversal and continuation chart patterns, How to identify them and when to enter a trade, and how to use stop loss and take profit with these patterns.
These patterns can be found in candlestick, bar and line charts.
Anyone who is interested in analyzing any market and trading in general should know these so if u don’t know them have no worries after you watch this video you will.
NOTE: you should always wait for confirmation when trading with these patterns. Confirmation in all of them is breaking the pattern and the market closing above or below it.
Chart Patterns are divided into 2 categories :
Reversal Patterns : They indicate a high probability that the existing trend has come to an end and that there is good chance of the trend reversing direction.
Continuation Patterns : They indicate a high probability that the existing trend is still active and that there is a good chance of the trend continuing in the same direction.
There are 2 types of these patterns :
Bearish : it means that the market is going down.
Bullish : It means that the market is going up
Let's Start with the Bearish Reversal Patterns :
1) Double Top (75.01%) :
The double top is one of the most common reversal price patterns. The double top is defined by two nearly equal highs with some space between the touches, The pattern is complete when price breaks below the swing low point created after the first high.
The pattern is considered a success when price covers the same distance following the breakout as the distance from the double high to the recent swing low point
2) Triple Top (79.33%) :
The triple top is defined by three nearly equal highs with some space between the touches, The pattern is complete when price breaks below the swing low points created between the highs.
The pattern is considered a success when price covers the same distance after the breakout as the distance from the triple high to the furthest swing low point
3) Head and Shoulder (83.04%) :
The head and shoulders patterns are statistically the most accurate of the price action patterns. The regular head and shoulders pattern is defined by two swing highs (the shoulders) with a higher high (the head) between them.
The two outer swing highs/lows don't have to be at the same price, but the closer they are to the same area the stronger the pattern generally becomes.
The pattern is complete when price breaks through the "neckline" created by the two swing low points.
4) Rising Wedge (73.03%) :
A wedge pattern represents a tightening price movement between the support and resistance lines.
the price is hypothesized to break through the support. This means the wedge is a reversal pattern as the breakout is opposite to the general trend.
Rising Wedge serves as a reversal if appeared during an uptrend .
Now let's Talk about the Bullish Reversal Chart patterns :
1) Double Bottom (78.55%) :
The double bottom is one of the most common reversal price patterns. The double bottom is created from two nearly equal lows, The pattern is complete when price breaks above the swing high point created by the first low.
The pattern is considered a success when price covers the same distance following the breakout as the distance from the double low to the recent swing high.
2) Triple Bottom (79.33%) :
he triple bottom is another variation of reversal price patterns. the triple bottom is created from three nearly equal lows, The pattern is complete when price breaks above the swing high points created between the lows.
The pattern is considered a success when price covers the same distance after the breakout as the distance from the triple low to furthest swing high.
3) Inverted Head and Shoulder (83.44%) :
The head and shoulders patterns are statistically the most accurate of the price action patterns, The inverted head and shoulders pattern has two swing lows with a lower low between them. The two outer swing lows don't have to be at the same price, but the closer they are to the same area the stronger the pattern generally becomes.
The pattern is complete when price breaks through the "neckline" created by the two swing high points .
4) Falling Wedge (72.88%) :
A wedge pattern represents a tightening price movement between the support and resistance lines.
the price is hypothesized to break through the support. This means the wedge is a reversal pattern as the breakout is opposite to the general trend.
Failing Wedge serves as a reversal if appeared during a downtrend
Let's move on now and start talking about Bearish Continuation patterns :
1) Rising Wedge (73.03%) :
The Rising Wedge in the downtrend indicates a continuation of the previous trend.
It is formed when the prices are making Higher Highs and Higher Lows compared to the previous price movements.
2) Bearish Flag (67.72%) :
The flag is a continuation pattern that can occur after a strong trending move. It consists of a strong bearish trending move followed by a rapid series of higher lows and higher highs, These patterns are small hesitations in strong trends.
The flag pattern appears as a small rectangle that is usually tilted against the prevailing trend in price. The best flag patterns have two features: 1) a very strong run in price (near vertical) prior to the setting up of the flag and 2) a tight flag that occurs right on the upper (or lower) edge of that run.
This pattern is considered successful when it breaks the lower trendline and then proceeds to cover the same distance as the prior trending move starting from the outer edge of the pattern.
3) Bearish Pennant (55.19%) :
The pennant often occurs in high momentum markets after a strong trending move, but the tight price formation that occurs can lead to breakouts against the preceding trend almost as often as we get continuation.
The slight difference in the price pattern formation between flags and pennants is an important distinction that can make a big difference in your trading results so it's well worth being aware of while watching the market develop during your trading day.
4) Descending Triangle (72.93%) :
The triangle pattern usually occurs in trends and acts as a continuation pattern. It's defined by a bearish trending move followed by two or more equal lows with a series of lower highs.
The pattern is complete when price breaks below the horizontal support area and the pattern is considered successful if price extends beyond the breakout point for at least the same distance as the pattern width
And finally we have the Bullish Continuation patterns :
1) Falling Wedge (72.88%) :
The Falling Wedge in the downtrend indicates a continuation of the previous trend.
It is formed when the prices are making lower Highs and lower Lows compared to the previous price movements.
2) Bullish Flag (67.13%) :
The flag is a continuation pattern that can occur after a strong trending move. It consists of a strong bullish trending move followed by a rapid series of lower highs and lower lows, These patterns are small hesitations in strong trends.
The flag pattern appears as a small rectangle that is usually tilted against the prevailing trend in price. The best flag patterns have two features: 1) a very strong run in price (near vertical) prior to the setting up of the flag and 2) a tight flag that occurs right on the upper (or lower) edge of that run.
This pattern is considered successful when it breaks the upper trendline and then proceeds to cover the same distance as the prior trending move starting from the outer edge of the pattern.
3) Bullish Pennant (54.87%) :
The pennant often occurs in high momentum markets after a strong trending move, but the tight price formation that occurs can lead to breakouts against the preceding trend almost as often as we get continuation.
The slight difference in the price pattern formation between flags and pennants is an important distinction that can make a big difference in your trading results so it's well worth being aware of while watching the market develop during your trading day.
4) Ascending Triangle (72.77%) :
The triangle pattern usually occurs in trends and acts as a continuation pattern. It's defined by a bullish trending move followed by two or more equal highs and a series of higher lows
The pattern is complete when price breaks above the horizontal support area and the pattern is considered successful if price extends beyond the breakout point for at least the same distance as the pattern width
5 Rules To Always Follow
I hope that I was able to help you understand Classic Continuation and Reversal Patterns better and if you have any more questions don't hesitate to ask.
This is not Financial Advice its a pure Educational video.
Hit that like if you found this helpful and check out my other video about the Moving Average, Stochastic oscillator, The Dow Jones Theory, How To Trade Breakouts, The RSI , The MACD , The Bollinger Bands , The Different Types Of Trading Strategies, Candlestick Charts Part 1 & 2 and 3 links will be bellow

GOLD on a 0.618 inversion 🦐GOLD on the daily chart got rejected by the confluence point at the daily resistance.
The price created a triple top on the 0.618 Fibonacci retracement level and now is moving to the support structure.
According to Plancton's strategy if the price will break below we will set a nice short order following our Academy rules.
--––
Follow the Shrimp 🦐
Keep in mind.
🟣 Purple structure -> Monthly structure.
🔴 Red structure -> Weekly structure.
🔵 Blue structure -> Daily structure.
🟡 Yellow structure -> 4h structure.
⚫️ Black structure -> <4h structure.
Here is the Plancton0618 technical analysis , please comment below if you have any questions.
The ENTRY in the market will be taken only if the condition of the Plancton0618 strategy will trigger

GOLD a turn at the 0.618 🦐GOLD on the daily chart got rejected by the confluence point at the daily resistance.
The price created a triple top on the 0.618 Fibonacci retracement level and now is moving to the support structure.
According to Plancton's strategy if the price will break below we will set a nice short order following our Academy rules.
--––
Follow the Shrimp 🦐
Keep in mind.
🟣 Purple structure -> Monthly structure.
🔴 Red structure -> Weekly structure.
🔵 Blue structure -> Daily structure.
🟡 Yellow structure -> 4h structure.
⚫️ Black structure -> <4h structure.
Here is the Plancton0618 technical analysis , please comment below if you have any questions.
The ENTRY in the market will be taken only if the condition of the Plancton0618 strategy will trigger

GOLD triple top at the 0.618 🦐GOLD on the daily chart got rejected by the confluence point at the daily resistance.
The price created a triple top on the 0.618 Fibonacci retracement level and now is moving to the support structure.
According to Plancton's strategy if the price will break below we will set a nice short order following our Academy rules.
--––
Follow the Shrimp 🦐
Keep in mind.
🟣 Purple structure -> Monthly structure.
🔴 Red structure -> Weekly structure.
🔵 Blue structure -> Daily structure.
🟡 Yellow structure -> 4h structure.
⚫️ Black structure -> <4h structure.
Here is the Plancton0618 technical analysis , please comment below if you have any questions.
The ENTRY in the market will be taken only if the condition of the Plancton0618 strategy will trigger

NFLX: Triple Top Alert From the daily chart, looking at the ever strong Resistance of $557 Supply level that has been rejected more than 5 times since IPO, indicates that NFLX might be rejected once again. At 1HR chart, we can also see a triple top rejection at $556/$557 during the day. RSI is highly oversold. Expecting a downwards rejection on the strong resistance. However, if Nasdaq is performing well, this could be an opportunity of breaking out. Monitor closely on the next candle volume and price action. Nasdaq strong push is essential.

Triple Top Expected + WickoffIm expecting another hit to the high tomorrow on London open before the price drops, Price may wick up-to the monthly high before dropping (Keep an eye on this one its a great potential short)

BTC - Triple Top Res after Higher Low Break-outBTC set the Higher Low above support and broke-out to the sub-channel .782.

New Trader: Charting patternsWhat do you see? I see a Rising wedge, and descending triangle on 4h. I also see a triple top and head and shoulder.

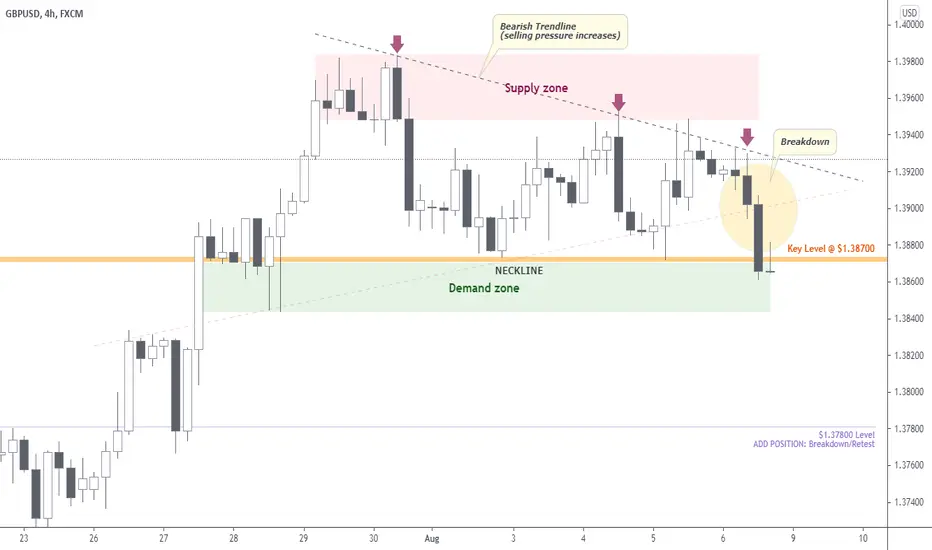
GBPUSD | Perspective for the new week | Follow-up detailsWith over 60pips move in our direction since my last publication, the character of price action during the course of last week trading session appears to have shed more light on the direction that the majority are heading as price broke and closed below our previous key level @ $1.39850. As multiple rejections of our previous neckline @ $1.39400 (see link below for reference purposes) affirms strength for sellers at this juncture in the market, The Pound continues to drop on the back of a stronger Dollar following a robust NFP release as price breaks down a significant level @ $1.38700 which technically serves as a Neckline of a Triple Top pattern. In this regard, I expect a risk of further decline for the Pound in the coming week(s).
Tendency: Downtrend (Bearish)
Structure: Breakdown | Supply & Demand | Reversal pattern (Triple Top)
Observation: i. The following narrative is a follow-up on my previous broadcast since we are yet to see any significant setup that reveals otherwise.
ii. The pattern formation of three peaks moving into the same area ($1.39400) with pullbacks in between shall be considered complete once the price closes below pattern support @ $1.37800 (Neckline).
iii. The appearance of a Triple Top pattern at a critical zone as our previous Neckline @ $1.39400 predict the reversal in the movement of price action thereby indicating a further slide in price.
iv. As the Key level remains our yard sick for bearish continuation, a further breakdown and retest of $1.38600 shall give rise to a new Supplication area for future selling opportunities and options to add to the existing position.
v. Considering the strong Demand zone @ $1.38600, the early hours/days of the new week might see a price climb to test the Bearish trendline to incite further decline...Trade consciously!😊
vi. I am looking forward to the completion of a possible Harmonic pattern (AB = CD) on the weekly chart ( see chart below for reference purposes).
Trading plan: SELL confirmation with a minimum potential profit of 200 pips.
Risk/Reward : 1:5
Potential Duration: 3 to 7days
NB: This speculation might be considered to make individual decisions on the lower timeframe.
Watch this space for updates as price action is been monitored.
Risk Disclaimer:
Margin trading in the foreign exchange market (including commodity trading, CFDs, stocks etc.) has a high risk and is not suitable for all investors. The content of this speculation (including all data) is organized and published by me for the sole purpose of education and assistance in making independent investment decisions. All information herein is for your reference only and I take no responsibility.
You are hereby advised to carefully consider your investment experience, financial situation, investment objective, risk tolerance level, and consult your independent financial adviser as to the suitability of your situation prior to making any investment.
I do not guarantee its accuracy and is not liable for any loss or damage which may result directly or indirectly from such content or the receipt of any instruction or notification therewith.
Past performance is not necessarily indicative of future results.
EURZAR on a channel break 🦐EURZAR on the 4h chart created a triple top below a weekly resistance.
The price is currently testing the ascending channel trendline over a daily support and according to Plancton0's strategy if the market will break below we will set a nice short order.
–––––
Follow the Shrimp 🦐
Keep in mind.
🟣 Purple structure -> Monthly structure.
🔴 Red structure -> Weekly structure.
🔵 Blue structure -> Daily structure.
🟡 Yellow structure -> 4h structure.
⚫️ Black structure -> <4h structure.
Here is the Plancton0618 technical analysis , please comment below if you have any question.
The ENTRY in the market will be taken only if the condition of the Plancton0618 strategy will trigger.

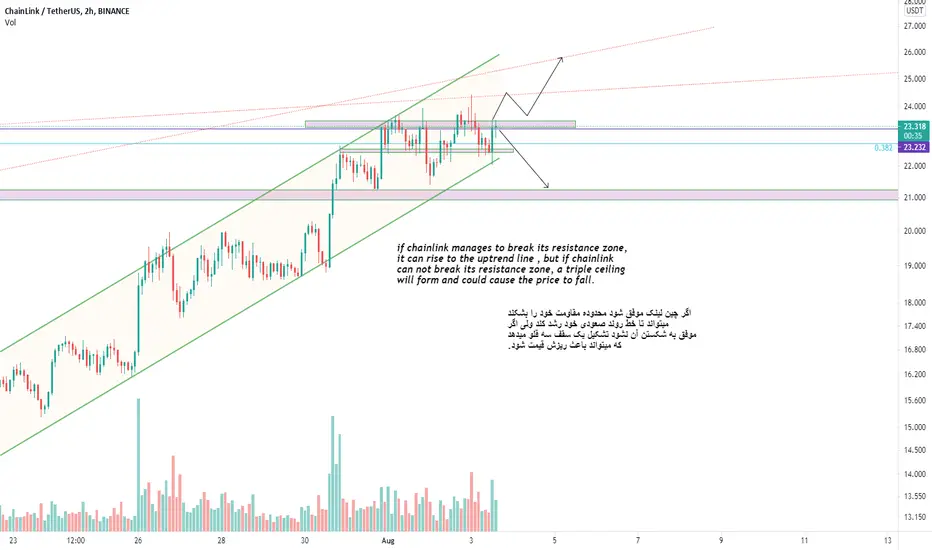
LINK/USDT
if chainlink manages to break its resistance zone,
it can rise to the uptrend line , but if chainlink
can not break its resistance zone, a triple ceiling
will form and could cause the price to fall.
ES EMINI Futures Triple Top ReversalA triple top reversal has formed around a key orderflow level of 4370.
ES_F has been pinned to a key support level of 4370 for 10days and MACD is trending lower.
A Breakout below 4370 will complete the pattern.
S&P 500 has a steep hill to climb over the next 2 months.
Chip Shortage
China Tech Stocks
Poor $AMNZ earnings
Moratorium Ending
10Y Yield Pullback
Fed walking back transitory
More Covid
Schools to Reopen
Debt Ceiling
Jackson Hole
September Pullbacks 2yrs in a row
Inflation Continues
QE Tapering

BCHUSDT triple top#BCHUSDT
$BCH form a triple top pattern.
to complete this pattern price have to close a 4h candle below the support zone.
If it happen #BCH will drop to $440 and $420
But if this zone support the price strongly, $BCH can go up to $430 and $440 again .


GBPAUD | Perspective for the new week | Follow-up detailsWith over 600pips in our direction since my last publication on this pair (see link below for reference purposes); The price hit a peak around AU$1.85000 in June 2021 and has since then continued to find lower lows. The appearance of a Double Top structure on the chart is a very strong clue that hints at a reversal momentum building as we experience a significant Breakdown of Key level I @ AU$1.84100 during the course of last week trading session.
In the UK, the newly appointed Health Secretary Sajid Javid insisted that the reopening remains intact, showing confidence about returning to normal. However, as cases continue rising – and hospitalizations are inching higher – market participants tend to cast doubt over loosening of restrictions on July 19 which might have a negative impact if not indecision on the Pound in the coming week(s).
Tendency: Downtrend (Bearish)
Structure: Breakdown | Supply & Demand | Channel | Reversal pattern (Double Top & Triple Top)
Observation: i. It has been a Bullish run for the Pound since the beginning of the year - 2021 hereby hitting a peak @ AU$1.85000 which is followed by a lower high to transition into a Descending Channel.
ii. The inability of price to touch and surpass the previous high (AU$1.85000) increases doubt on a further rally as a Double Top pattern emerges on the chart.
iii. Double Top: We do have an extremely bearish technical reversal pattern in play after the price reached a peak two consecutive times (AU$1.85000 & AU$1.84800 respectively) with a moderate decline between the two highs.
iv. Even as we await a confirmation which will happen if the price falls below the support level @ AU$1.82700 (Neckline of Double Top) that equals the low between the two prior highs; there is an evident structure that occurred between 30th June & 2nd July 2021 which is characterized by multiple rejections of AU$1.84600 (Triple Top) that signals Bearish tendency in the coming week(s).
v. TRIPLE TOP: formation of three peaks moving into the same zone @ AU$1.84600, with pullbacks in between can be considered complete immediately the price broke down pattern support @ AU$1.84000 on the 2nd of July 2021, indicating a further price slide in the coming week(s).
vi. The early hours/days of the new week might see a price climb to test the Neckline of Triple Top @ AU$1.84000 to incite further decline.
vii. If a climb happens, I have identified a niche around AU$1.83900/1.84400 for selling opportunities.
viii. A plunge below Key level II @ $1.83500 (Breakdown/Retest) might welcome an addition to the existing position and a further plunge below AU$1.82700 welcomes another addition... Trade consciously! :)
Trading plan: SELL confirmation with a minimum potential profit of 150 pips.
Risk/Reward : 1:6
Potential Duration: 3 to 7days
NB: This speculation might be considered to make individual decisions on the lower timeframe.
Watch this space for updates as price action is been monitored.
Risk Disclaimer:
Margin trading in the foreign exchange market (including commodity trading, CFDs, stocks etc.) has a high risk and is not suitable for all investors. The content of this speculation (including all data) is organized and published by me for the sole purpose of education and assistance in making independent investment decisions. All information herein is for your reference only and I take no responsibility.
You are hereby advised to carefully consider your investment experience, financial situation, investment objective, risk tolerance level, and consult your independent financial adviser as to the suitability of your situation prior to making any investment.
I do not guarantee its accuracy and is not liable for any loss or damage which may result directly or indirectly from such content or the receipt of any instruction or notification therewith.
Past performance is not necessarily indicative of future results.

CNC, the breakout we've all been waiting for!!As you can see there has been a rough resistance at the 74-75 levels and it has been like this since August 2018. For me, the volume speaks volume and if you are to compare the volume levels to the previous volume levels we have got something juicy. Each time at this 75 dollar level we have never experienced high volume and finally, it has come! Quadruple top on the long term mixed with an ascending wedge just screams breakout play.
TLDR:
1. Longterm ascending triangle.
2. short term bullish wedge breakout
3. 4x top
4. most importantly increased volume on the run-up to resistance.
Would love thoughts and ideas about this idea or if there are any questions.
