TRON (TRX) - September 15Hello?
Welcome, traders.
By "following", you can always get new information quickly.
Please also click "Like".
Have a good day.
-------------------------------------
(TRXUSDT 1W Chart)
The key is whether it can find support and move higher near 0.06236.
(1D chart)
The key is whether the HA-Low can support and move higher within the 0.05989 point near the long horizontal line and the +100 index at the long horizontal line at 0.06532.
In other words, it is necessary to check whether it can be supported in the 0.05989-0.06532 section.
It is moving down from 0.06532, entering a long-term bearish channel.
Therefore, it is important to get out of the bearish channel quickly.
------------------------------------------------------------ -------------------------------------------
** All descriptions are for reference only and do not guarantee a profit or loss in investment.
** The MRHAB-T indicator, which is inactive on the chart, contains indicators that indicate support and resistance points.
** Background color of Long/Short-S indicator: RSI oversold and overbought sections
** Background color of CCI-C indicator: When the short-term CCI line is below -100 and above +100, oversold and overbought sections are displayed.
** The OBV indicator was re-created by applying a formula to the DepthHouse Trading indicator, an indicator disclosed by oh92. (Thanks for this.)
(Short-term Stop Loss can be said to be a point where profit and loss can be preserved or additional entry can be made through split trading. It is a short-term investment perspective.)
---------------------------------
TRON

ETH Going Under $100?Ethereum Breaking down on the monthly, should see a deep or complete retracement of wave-C.


TRXUSDT 3d Two TRX price motion scenario by the end of 2022TRXUSDT is probably one of the most indifferent or anarchic trade couples. It took 2 months since the publication of our previous idea, and nothing has changed on the schedule.
The price of TRXUSD did not respond to either the growth or the fall of BTCUSDT price and the crypto market of all, but simply moves steadily to the right.
So today we will only refresh the conditions from the previous idea.
1. Currently, the TRX price is traded above $0.06, respectively, the assumption of accumulation of a large position in force.
The first possible growth stage is possible up to $0.09.
In the event of a crypto market into a growth trend, the Tron price can continue the growth of the blue scenario to $0.17.
2. In the event of a sharp drainage of cryptocurrencies, you can put limit orders for purchase in the liquidity area of $0.047-0.052.
If from this liquid zone the price does not sharply up, but will try to fix below it, then the TRX will have to come out, because the chance to collapse more down will be very large.
_______________________________
Since 2016 , we have been analyzing and trading the cryptocurrency market.
We transform our knowledge, trading moods and experience into ideas. Each "like under the idea" boosts the level of our happiness by 0.05%. If we help you to be calmer and richer — help us to be happier :)

TRX/BTC Local Work. Wedge. Rollback. Recruitment zone 2019-2020Notice how the wedge formed above the main trend line. The resistance of the wedge has been broken. The pullback.
The price is 2 months in a sideways pattern in 25% steps. Intraday volatility in this pair is minimal.
The gray area is this support zone of the channel of the main set of 2019 - 2020 position. This is clearly visible on the line chart on the weekly timeframe.
TRX / BTC Main trend. Linear graph. Trend reversal zones


TRON (TRX) - August 31Hello?
Welcome, traders.
By "following", you can always get new information quickly.
Please also click "Like".
Have a good day.
-------------------------------------
(TRXUSDT 1W Chart)
The key is to keep the price above 0.06236.
If not, there is a possibility that it will move down to around 0.04437.
(1D chart)
Bollinger Bands (60) contracted.
Therefore, we expect large volatility to occur in the near future.
This volatility is likely to start off the 0.05989-0.07311 interval.
- The Stoch RSI indicator is showing a downward trend rather than rising to the overbought zone.
It can be seen that the power for ascent is weak.
So, if it does not find support above 0.06703, it is likely to lead to further declines.
------------------------------------------------------------ -------------------------------------------
** All descriptions are for reference only and do not guarantee a profit or loss in investment.
** The MRHAB-T indicator, which is inactive on the chart, contains indicators that indicate support and resistance points.
** Background color of Long/Short-S indicator: RSI oversold and overbought sections
** Background color of CCI-C indicator: When the short-term CCI line is below -100 and above +100, oversold and overbought sections are displayed.
** The OBV indicator was re-created by applying a formula to the DepthHouse Trading indicator, an indicator disclosed by oh92. (Thanks for this.)
(Short-term Stop Loss can be said to be a point where profit and loss can be preserved or additional entry can be made through split trading. It is a short-term investment perspective.)
---------------------------------

TRON Tron Technical analysis basically on elliott waves Principles and Priceaction Strategy
Reon can be Down to 0.04$
Wait and watch

TODAY - TRX DAY?TODAY - TRX DAY?
TRON on day trading seems interesting.
#Main markets are still bear - Manage your risk and this is not finance advice.

#Tron Expands, Support at $0.061 and TRX in a Bear BreakoutPast Performance of Tron
TRX prices are moving horizontally, bearish at spot rates but firm against the strong wave of selling pressure. Sellers remain in charge but for trend continuation below $0.061, there must be a high volume, wide-ranging bear breakout for confirmation. Before then, depending on the breakout direction in the current formation, sellers are in the lead, and risk-off traders may search to unpack on every attempt higher towards the August 26 highs.
#Tron Technical Analysis
TRX is within a bear breakout pattern, and sellers are in the driving seat despite the recent sideways movement. The rejection of lower lows and rejuvenation of buyers in the days ahead, pushing prices above $0.065, could ignite demand, qualifying the August 26 bar as climactic. However, before then, sellers may unload on every pullback towards this reaction line, targeting $0.053 in the medium term expecting a drop below last week's lows in a bear trend continuation pattern. Their confidence is in the fact that the wave down is with high participation. Besides, prices are banding along the lower BB suggesting strong bear momentum.
What to Expect from #TRX?
TRX is under pressure and is down roughly 13 percent from August 2022 highs. In the days ahead, there must be a strong surge above $0.065 for buyers to take charge. If not, any drop below last week's critical support levels may force TRX lower in subsequent sessions.
Resistance level to watch out for: $0.065
Support level to watch out for: $0.061
Disclaimer: Opinions expressed are not investment advice. Do your research.

TRXusdt 12H TA: Support & ResistanceAccording to the chart, in the 12-hour time frame, I determined the important support and resistance limits, which are suitable for entry in case of breaking the resistance zone.
Its not Buy or Sell SIGNAL
DYOR
BY : Mohamad Teriz - @AtonicShark

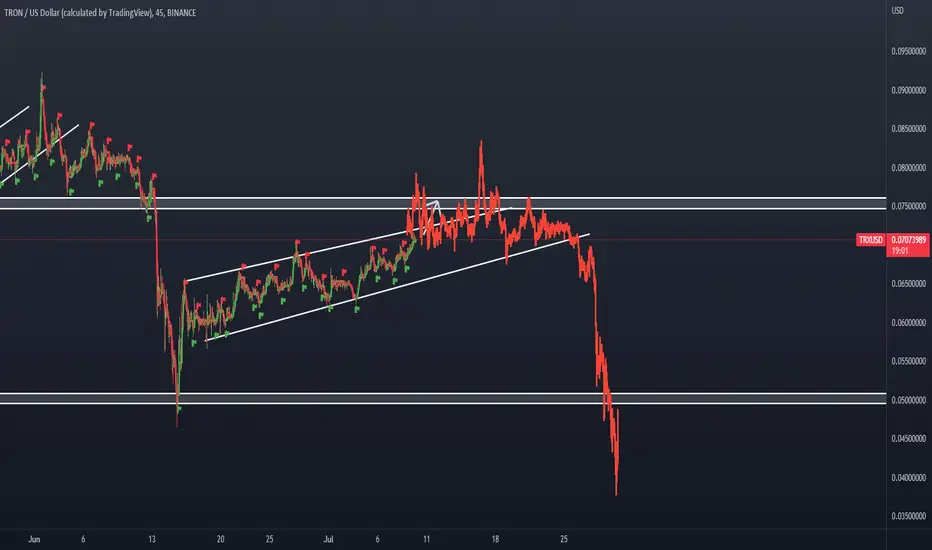
TRXUSDT has got rejected from a major Support zoneTRXUSDT has got rejected from a major Support zone. It has also formed a wedge pattern. There is a potential that the price goes higher.
💎 TRXUSDT
🔵 Entry zone 0.06776- 0.06836
🟢 TP1 0.06928
🟢 TP2 0.07092
🟢 TP3 0.07396
🔴 SL 0.06669
Good Luck 🎲

TRON (TRX) - August 18hello?
Welcome, traders.
If you "follow", you can always get new information quickly.
Please also click "Like".
Have a good day.
-------------------------------------
(TRXUSDT 1W Chart)
If the price is maintained above the 0.05358-0.06236 range, the uptrend is expected to continue.
(1D chart)
Primary resistance: 0.07311
Secondary resistance: 0.08034
1st support: 0.06703
2nd support: 0.05358-0.06236
In order to continue the uptrend, it should find support and move higher near 0.06703.
------------------------------------------------------------ -------------------------------------------
** All descriptions are for reference only and do not guarantee a profit or loss in investment.
** The MRHAB-T indicator, which is inactive on the chart, contains indicators that indicate support and resistance points.
** Background color of Long/Short-S indicator: RSI oversold and overbought sections
** Background color of CCI-C indicator: When the short-term CCI line is below -100 and above +100, oversold and overbought sections are displayed.
** The OBV indicator was re-created by applying a formula to the DepthHouse Trading indicator, an indicator disclosed by oh92. (Thanks for this.)
(Short-term Stop Loss can be said to be a point where profit and loss can be preserved or additional entry can be made through split trading. It is a short-term investment perspective.)
---------------------------------

Tron update 16 August 2022 For more information check out my show on YT, thank you all for clicking that boost button.
Red block is worst case, green represents the best case although price ranges are conservative

Tron #TRX Idea 10 August 2022TRX is testing the down trending resistance, we may see $0.08 trx during 2022

TRON (TRX) - August 8Hello?
Welcome, traders.
By "following", you can always get new information quickly.
Please also click "Like".
Have a good day.
-------------------------------------
(TRXUSDT 1M Chart)
In the long term, keeping the price above 0.05358 is key to sustain the uptrend.
(1W chart)
Resistance: 0.08034-0.08933
Support: 0.05358-0.06236
In order to show an upward trend from a mid- to long-term perspective, the price needs to be maintained above the HA-High indicator.
To do this, you need to shake it up and down to make the HA-High indicator fall or rise above the HA-High indicator.
(1D chart)
Primary resistance: 0.07311
Secondary resistance: 0.08034-0.08933
1st support: 0.06703
2nd support: 0.05358-0.06236
Whether it can move higher than 0.07311 is the key.
Since they are holding an uptrend on the 1M chart, i.e. long term, the key is whether they can turn into an uptrend in the short and medium term.
------------------------------------------------------------ -------------------------------------------
** All descriptions are for reference only and do not guarantee a profit or loss in investment.
** The MRHAB-T indicator, which is inactive on the chart, contains indicators that indicate support and resistance points.
** Background color of Long/Short-S indicator: RSI oversold and overbought sections
** Background color of CCI-C indicator: When the short-term CCI line is below -100 and above +100, oversold and overbought sections are displayed.
** The OBV indicator was re-created by applying a formula to the DepthHouse Trading indicator, an indicator disclosed by oh92. (Thanks for this.)
(Short-term Stop Loss can be said to be a point where profit and loss can be preserved or additional entry through split trading. It is a short-term investment perspective.)
---------------------------------

TRON TRX short Entry Range, Take Profit and Stop LossTRX/USDT short
Entry Range: $0.067 - 0.073
Price Target 1: $0.064
Price Target 2: $0.057
Price Target 3: $0.052
Stop Loss: $0.077


Tron #TRX Idea 4 August 2022Sqaures represent conservative price target and when they are likely to be hit while circles represent most bullish price targets and time frame

TRXUSDT |Coin Review| Hello everyone, I wrote a new idea for you. I think it's easy to like and subscribe to the channel, thanks😉
📌 Let's analyze the tron coin today
📌At the moment, the asset is at the stage of consolidation, after a strong strait, the price was quickly bought back and is now held in the range of $0.6990
📌It is also worth noting that a large fund called SEED Venture Capital has recently invested in the project, and this fund also invests in projects such as NEO, ZIL, CND, XRP
📌I think if large funds continue to invest in such projects, then it makes sense to buy these coins in your investment portfolio.
What do you think about this, will there be a breakthrough to the zone of local resistance in the near future?

TRX/USDT Analysis for next movePrice is expected to fall to buy zone which is around 0.05$ which is a good buy zone.
Please Like, share and comment.
TRXUSDTHello my dear friends
The triangle pattern is very cleanly formed in the higher time frames.
If the current trend is below the price range of $0.0592, the possibility of forming a downward trend similar to the drawn scenario is not out of mind.
But if the current trend is above the price range of $0.07893, there is a possibility of forming an upward trend similar to the drawn scenario.
According to the momentum of the current trend, the possibility of forming the first scenario (downtrend) is more likely.
We would be happy to hear your comments.

TRON setup in 1 Look! TRXUSDT Update 📈📉Hello traders, what's going on today ?!
Since 21 FEB 2022, that I posted the last analysis
for trxusdt , TRON has continued to fluctuate in a symyrycal triangle till now . (more than 30%💰 (1x)short).
Also today as you see in the weekly timeframe for trxusdt , it can continue to fluctuate more , then finally will breakout this great triangle pattern ,which typically a strong bullish pattern , but at the current situation due to uncertainty about the future , I' not sure that it can massively rise or may fall again after any breakout
but I know where more likely the price action have a reaction , thus for any possible scenario I already have a proper setup with a favorable R:R ,that can be triggered automatically !
✌️ Good luck with your trading and investing and remember: Trade smart…OR JUST DON’T TRADE!
--------------------------------------------------------------------------------------------------------------------
👉This analysis is my personal opinion ,not a financial advice ,so do your own research.
💜 if you're fan of my analyses please follow me , give a big thumbs 👍 OR drop a comment 🗯
