TrueFi · Bitcoin vs the Altcoins · Low Risk vs High RewardsTrueFi is trading at bottom prices. Notice the big difference between this pair and the ones that are trading high, near resistance or at a new all-time high. This is the difference I want to point out to new buyers.
If you are entering the market just now, you should be considering pairs like this one rather than the ones that are already pretty advanced. This is because the ones trading low/near support have more room available for growth, higher profits potential and very little risk. When prices are trading near the bottom, there isn't much room to go lower. When prices are trading high, even with marketwide bullish action, a correction can develop anytime.
We look for pairs like this one to buy and hold.
The second consideration is related to growth potential. While Bitcoin is awesome; Bitcoin is crypto; Bitcoin is great and is here to stay, it is already worth trillions of dollars. If everything goes amazing for Bitcoin, we might enjoy an additional 100% growth before the cycle ends. On an altcoin, in comparison, we can enjoy 1,000%, 2,000%, 3,000%, 5,000% or more. So you need to choose wisely.
A whale can easily choose Bitcoin because of liquidity issues, accessibility, security, stability, accounting, long-term performance, etc. A tiny fish is better off with the altcoins market, they have more room for growth.
Technical analysis
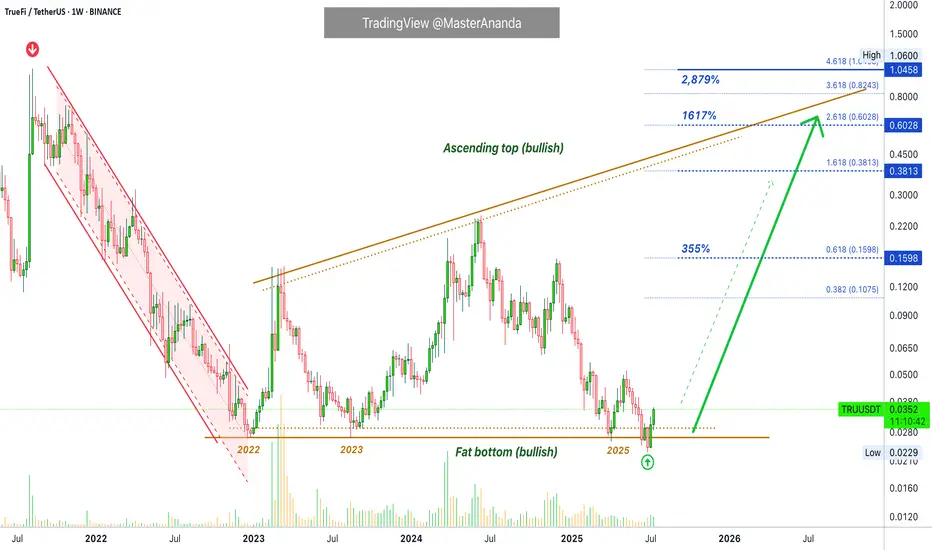
The red channel reveals a downtrend, the previous bear-market. The flat bottom in the following years reveals a consolidation period, long-term. Not a downtrend but creating a base. From the bottom we grow.
TRUUSDT is no longer bearish, moving down, instead it accumulated for years and now that this accumulation phase is over we are ready for massive growth.
We witnessed first a downtrend, then sideways (consolidation) and now comes an uptrend. These are the only three ways in which the market can move. Down—neutral—up.
The logical next step after a downtrend is always a sort of transition period, after this transition the uptrend starts.
We will have an uptrend now, this is what we call a "bull market." Higher highs and higher lows."
If you enjoy the content, you can always follow for more. It is easy and free and you get to receive updates every time I publish a new article.
Thanks a lot for your continued support.
Namaste.
Truefi
TrueFi (TRU)#TRU
The price is moving within a descending channel on the 1-hour frame and is expected to break and continue upward.
We have a trend to stabilize above the 100 moving average once again.
We have a downtrend on the RSI indicator that supports the upward break.
We have a support area at the lower limit of the channel at 0.0270, acting as strong support from which the price can rebound.
We have a major support area in green that pushed the price upward at 0.0260.
Entry price: 0.0275
First target: 0.0281
Second target: 0.0290
Third target: 0.0301
To manage risk, don't forget stop loss and capital management.
When you reach the first target, save some profits and then change the stop order to an entry order.
For inquiries, please comment.
Thank you.

TRUUSDT 1W AnalysisTRU ~ 1W Analysis
#TRU This trade is very high risk, this is the lowest support you might consider to start buying back with a short term target of at least 20%+.

Tru USDT Swing TradeAs much as we doesn't closes below 0.038 first and confirmed tp is 0.060$ . Wait for the entry and start accumulation of true between 0.040-0.035 set tp 0.060$

TRUUSDT 1WTRU ~ 1W Analysis
#TRU Key support that must be maintained for now. Loss of this support, will suppress lower prices.

TRUUSDT 1WTRU ~ 1W Analysis
#TRU Buy gradually from here if you still have a Conviction on this coin with a short -term target of at least 20%+.

TrueFi (TRU)Comprehensive Analysis of TRU/USDT
Overview
TrueFi (TRU) is an innovative project in the decentralized lending space (DeFi Lending) that enables collateral-free lending. The TRU coin is among the low-market-cap cryptocurrencies, and due to its low liquidity and high volatility 🚨, it falls into the category of high-risk trades. For investing or trading this coin, risk management and attention to trading volume are essential.
Current Market Situation
Downtrend Channel: 📉
TRU’s price is currently in a downtrend channel and is heading towards the bottom of the channel.
Weekly Support Zone:
The range (0.0605 - 0.0662) acts as a key support level. Although there is a possibility of a drop below this range, a quick rebound (Fake Breakout) from this zone could signal a safe entry. 💡
Trading Volume: 📊
If the volume increases when the price bounces from the channel’s bottom, the likelihood of price rising to the top of the channel strengthens. Traders should pay close attention to volume near the support range.
RSI: 📈
RSI Support Zone:
The range (41.24 - 44.19) could prevent further decline. A breakdown of this zone could lead to a deeper drop.
Breaking the 50 RSI Zone:
A move above this level could indicate a strong upward move, providing a good entry opportunity. 🚀
Upcoming Scenarios
Bullish Scenario: 🌟
Bounce from the Bottom of the Downtrend Channel:
If the price stabilizes in the support range (0.0605 - 0.0662) and trading volume increases, an upward move to the top of the channel becomes likely.
Breakout of the Downtrend Channel’s Top:
If the top of the downtrend channel is broken, the price could reach the target range (0.2258 - 0.2702). Given TRU's low market cap, heavy liquidity inflow could push the price beyond this target. 📌
Bearish Scenario: ⚠️
Loss of Weekly Support:
If the range (0.0605 - 0.0662) is lost, the next support is at 0.0400.
Traders should set appropriate stop-loss orders to mitigate risk. 🛑
Weakness in RSI:
A breakdown of the support zone (41.24 - 44.19) in the RSI could signal a continuation of the downtrend. 🔻
Range-Bound Scenario: ⏸️
If the price remains within the weekly support zone and trading volume decreases, a short-term range-bound movement may develop. 🔄
Stop-Loss:
For long trades, set the stop-loss below the 0.0600 range. ❌
Trade Volume:
Given the high risk, it is recommended to allocate only a small percentage of capital to this trade. 💰
Summary
TRU, considering its technical setup and position in the downtrend channel, can present promising trading opportunities. However, due to its low market cap and high volatility, risk management is crucial. ⚡
Recommendation: Always review fundamental factors and project-related news before making any decisions. 📰
⚖️ Warning: This analysis is purely technical and should not be considered financial or investment advice. Always do your own research and practice risk management. Good luck! 🚀

TRUUSDT 1WTRU ~ 1W Analysis
#TRU If you still have Conviction on this coin,. buy gradually on this support block with a minimum target of 20%+

#TRU/USDT Ready to go higher#TRU
The price is moving in a descending channel on the 30-minute frame and sticking to it well
We have a bounce from the lower limit of the descending channel, this support is at 0.0780
We have a downtrend on the RSI indicator that is about to be broken, which supports the rise
We have a trend to stabilize above the moving average 100
Entry price 0.0795
First target 0.0810
Second target 0.0836
Third target 0.0863

TRU planThis is my TRU plan. I expect the price to bounce in orange box. Lets see if the market gives us orange box.


TRUUSDT 1WTRU ~ 1W
#TRU This is a coin from the RWA sector. If you have Conviction on this coin,. Wait until the resistance line of this pattern is successfully broken. after that buy in stages. with a minimum target of 20%+

A Paradigm Shift in Onchain Credit Systems TrueFiTrueFi represents a pioneering leap in the realm of decentralized finance (DeFi), specifically tailored to enhance the ecosystem of onchain credit. Launched in November 2020, TrueFi has established itself not merely as a platform but as a modular infrastructure designed to facilitate and innovate the mechanics of credit in the blockchain environment.
At its core, TrueFi serves as a nexus, intricately weaving together various stakeholders in the credit market through the use of sophisticated smart contract technology. This system is governed by the TRU token, which plays a pivotal role in the governance and operational mechanics of the platform. Here’s how it functions:
Lenders: Individuals or entities looking to earn interest on their capital by lending it out in a secure, transparent blockchain environment.
Borrowers: A diverse group, including but not limited to crypto-focused institutions, traditional fintech companies, trading entities, and credit funds seeking capital. These borrowers benefit from the flexibility and accessibility of funds without the conventional barriers presented by traditional banking systems.
Portfolio Managers: These are key players who manage loan portfolios, optimizing for risk and return, thereby ensuring the health and profitability of the lending pools.
Loan Origination: Since its inception, TrueFi has successfully originated loans amounting to over $1.7 billion, spread across more than 30 borrowers. This figure not only highlights the platform's capacity to handle substantial financial throughput but also underscores its growing acceptance and trust within the DeFi community. TrueFi’s design as a modular infrastructure allows for scalability and adaptability, crucial in the fast-evolving blockchain landscape. This modularity ensures that TrueFi can integrate with various other DeFi protocols, enhancing its utility and extending its reach across different aspects of onchain financial services.
Team
Raphael Kosman is a co-founder who plays a significant role in TrueFi's strategic direction and technical development, given the typical responsibilities of co-founders in tech startups
Tory Reiss - also a co-founder and has been involved in shaping the company's vision, business model and partnerships, given the collaborative nature of founding teams.
Jai An - Jai An's role as another co-founder covers various aspects of the business, from technology to business development, contributing to TrueFi's core functionality and expansion.
Stephen Cade - as a co-founder, Stephen will play an important role in TrueFi's start-up and current growth phases, focusing on product and technology.
Alex de Lorraine - as CEO, Alex leads the company, driving its strategic vision, operational efficiency and market positioning in the DeFi space.
Bill Wolf - as CIO (Chief Investment Officer), Bill oversees investment strategies and manages the lending and borrowing arrangements that are central to TrueFi's operations.
Diana Bouchard - serves as General Counsel and handles legal matters to ensure TrueFi's compliance with relevant regulations and laws, which is critical for the financial and blockchain sectors.
Esben Svane Stockmarr - Advisor, he can advise on strategic decisions, bringing in experience from other sectors or specific market knowledge.
Ichiro Minamikawa is also listed as an advisor. Ichiro may contribute to TrueFi's strategy in terms of market expansion, technology partnerships or other specialized advice.
Dovey Wan - As an advisor, who is active in the blockchain and cryptocurrency community (as noted in X's posts about her involvement in various discussions and personal anecdotes in the crypto space), is likely to bring insight into market trends, community engagement, or even technological innovation in the blockchain ecosystem.
The composition of the team demonstrates a combination of technology, finance, legal and strategic advisory experience, which is critical for a platform like TrueFi that operates at the intersection of finance and blockchain technology. This team structure is designed to navigate the complexities of decentralized finance, driving growth, compliance, and innovation in collateral-free lending.
Fundraising
Total Raised $ 32.50M
Andreessen Horowitz (a16z) - Known for its significant investments in tech and crypto sectors, a16z has participated in TrueFi's funding, indicating strong venture capital confidence in TrueFi's model.
Jump Trading and Jump Capital - Both entities are involved, showcasing interest from trading firms that might benefit from or contribute to the DeFi lending ecosystem.
BlockTower Capital - A cryptocurrency investment firm that has backed multiple rounds for TrueFi, suggesting a strong belief in the project's potential within the DeFi space.
Distributed Global - Another venture capital firm focusing on blockchain technologies, indicating TrueFi's appeal to specialized crypto venture funds.
Slow Ventures - This firm has also invested, known for backing tech startups at various stages.
Foundation Capital and DHVC (Danhua Capital) - These investments reflect a broader interest from venture capitalists in extending TrueFi's capabilities or integrating its technology into broader financial services.
Alameda Research - Before its known issues, Alameda was involved in private sales, illustrating early interest from major crypto trading entities.
GGV Capital - A firm with a global perspective, investing in local and global tech companies, which might be looking at TrueFi's expansion or integration capabilities.
Private and Strategic Rounds: TrueFi has gone through various rounds of funding, including private sales and strategic rounds. These rounds are not just about raising capital but also about aligning with strategic partners who can contribute to the ecosystem's growth, technology, or market access.
Token Sales: While not traditional ICOs, the sale of TRU tokens serves as a form of fundraising where tokens are used for governance and to incentivize participation in the TrueFi lending protocol. This method leverages the community's direct involvement in the protocol's success.
Focus on Real-World Assets (RWA): The introduction of Trinity, as mentioned in recent developments, focuses on lending against tokenized real-world assets. This initiative could potentially open up new avenues for fundraising by attracting investors interested in combining traditional finance (TradFi) with DeFi.
Tokenomics
Incentive Distribution: 39.00%
Tokens: 565.50 M TRU
Dedicated to rewarding community engagement and ecosystem growth, this slice of the pie incentivizes participation and long-term commitment.
Private Sale: 28.50%
Purpose: Early investment rounds that fuel initial development and market entry strategies, ensuring the project has the necessary resources to thrive.
Team & Management: 18.50%
Investment in Talent: Allocated to the visionaries, developers, and managers who turn concepts into reality, this ensures the team's interests are aligned with the project's success.
Grants / Company: 9.50%
Innovation & Expansion: These funds are set aside for grants aimed at fostering innovation, research, community projects, and the overall expansion of the company's reach.
Future Team: 4.50%
Future-proofing Talent: Reserved for future hires, this allocation allows for the continuous attraction of top-tier talent as the project evolves.
This allocation strategy not only supports the immediate operational needs but also invests in the future growth and community engagement, ensuring a balanced approach to token distribution.
Blockchain
Ironically, the largest holders of TRU are two of the most famous crypto exchanges - Binance and Coinbase.
Two whales have recently emerged that have accumulated 1.9% of the entire issue each. This indicates insider information within the project and quite large purchases at market price!
A number of well-known companies (Circle, Worldcoin and others) also have a large amount of TRU on their wallets. This indicates its continued widespread use in the community and among the cryptocommunity. GSR have already listed their tokens on the exchange to pump up the price, this explains the above mentioned about the large number of tokens on the exchange.
Conclusion
The project is very promising from the point of view of community use, as well as from the point of view of asset price growth. GSR market maker knows how to pump up such projects, moreover, the issue of tokens on exchanges is almost equal to the issue in the hands of GSR. The percentage of tokens in the same hands is off the charts! The team continues to actively develop the project, as well as working on integrations into all possible areas of economics and crypto. The whales have finished accumulating, the breakthrough is very soon. Buckle up!
Best wishes, Horban Brothers!

TRU/USDT - A long term trade with right entry BINANCE:TRUUSDT (1W CHART) Technical Analysis Update
TRU is currently trading at $0.147 and the price is currently reversing towards it's support zone and we expecting this support zone to hold strong. We have a good opportunity for a long trade in spot market or with the low leverage. i'm entering the trade at the current price and planning DCA if price drops more.
Entry level: $ 0.1477
Stop Loss Level: $ 0.08459
TakeProfit 1: $ 0.19248
TakeProfit 2: $ 0.24517
TakeProfit 3: $ 0.39943
TakeProfit 4: $ 0.67278
TakeProfit 5: $ 1.04682
Max Leverage: 2x / Spot
Position Size: 1% of capital
Remember to set your stop loss.
Follow our TradingView account for more technical analysis updates. | Like, share, and comment your thoughts.
Cheers
GreenCrypto

TRUUSDT(TrueFi) Daily tf Range Updated till 10-06-24TRUUSDT(TrueFi) Daily timeframe range. another alt doing pretty well while market is down. trying to break out of 0.24465 if volume can keep up its possible. if we get a valid close above 0.24465 than till 0.31015 is open. local support is at 0.18236.

$TRU 5X TRADE | Truefi +537% Cup and Handle PatternTruefi has had extremely bullish price action recently and is currently forming a multi-month cup and Handle pattern.
The pattern has been confirmed with the price retesting the neckline after forming a downward handle. A complete breakout would send us back to 2022 ATHs, which would be ~$1.14 and would be a 5X gain from current prices (~527%).
Set appropriate stop losses and DYOR, good luck!

TRUE BREAK THE IMPORTANT TREND LEVEL --> UP $0,30 POSSIBILITYThanks for reading this update.
True coin did break an important level, Our data shows that there is high interest for TRUE, which could break in the next time frames up $0,30, this based on the extra study we did on this coin.
We will follow the true trend to see if it's able to break.
Further study shows that this is a building coin.
This is not trading advice and will stay our view and expecting for the coming time.

TRUE NEW INCREASE VOLUMETRUE shows a new increase in volume, which could be confirmed in the coming time frames.
We will follow the coin to see if it's able to confirm.
The reason for the volume is the trend data that this coin shows.
This coin is at basic choice on daily trends.
True can show in the coming time frames interesting targets.
Building coins can take some time before action.

TRUUSDTBroke the downtrendline and got in on the retest. Weekly trend is up after a long downtrend. Price might still be moving lower, so only risked 0.5% so far on a total 1%. Undervalued RWA in my view.

#TRU/USDT#TRU
The price broke the descending triangle upward
Drawing support from the green support area
We have support from the RSI indicator
We have a higher stability of Moving Average 100 that supports the rise
Entry price is 0.05600
The first target is 0.06300
The second target is 0.06853
The third goal is 0.07532

TRUUSDT(TrueFi) Bullish Bias UpdateSo based on the chart, the wave count show us that we are still in a wave 1 cycle, currently just completed wave 4 correction cycle, now expecting wave 5 cycle from the current price up to complete wave 5 of wave 1 then a correction from those Highs to create new lows wave 2 will be expected.
this might be a 10X gem..

TRU/USDT Ready for an Explosive Journey? 👀🚀TRU Analysis💎Paradisers, let's take a closer look at #TRUUSDT, where the current trends indicate a viable opportunity for a bullish resurgence from its essential support zone.
💎A review of #TrueFi's latest market trajectory reveals a profound 79% reduction from its recent high. Yet, the determination at the support level of $0.04675 suggests a doorway to an upward movement.
💎Despite the hurdles in achieving new highs or surpassing previous records, which has led to a temporary bearish sentiment, the $0.04675 level is pivotal for #TRU. This juncture is on the cusp of initiating a notable bullish wave with a fresh evaluation.
💎As forward-thinking traders, we're perpetually prepared with an alternative plan. If #TRU dips further from this support, we're poised for a bullish comeback starting from the secondary support at $0.034. It's imperative to acknowledge, however, that crossing below this point could indicate a deeper bearish trend.
💎Maintain adaptability in your strategies and keen observation of market trends, Paradisers. Your ParadiseTeam is vigilantly watching, ready to guide you through these evolving market scenarios.

Is TrueFi about to moon(10X)Is this Gem about to moon,
Correction complete, unless we see an extension of it but otherwise from the current price im bullish, been bullish on most alts, tokens.
