USOIL: Eyes on 64.10 as Geopolitics Take Center Stage!!In today’s session, we’re watching USOIL for a potential short setup around the 64.10 zone. Price action remains in a broader downtrend, with the current move looking like a corrective retracement into a key support turned resistance area.
From a fundamental perspective, all eyes are on the scheduled August 15 meeting between Donald Trump and Vladimir Putin. A ceasefire agreement could fuel bearish momentum, potentially accelerating the sell-off. On the other hand, if talks collapse, renewed geopolitical tension could keep oil prices bid in the short term.
Technically, 64.10 is the battleground a decisive rejection here could offer an attractive risk reward for sellers aligned with the dominant trend.
Trump

Bitcoin, Ethereum Breakout: 401(k) funds & the next "Altseason"Bitcoin is up 10% in August, driven by strong ETF inflows and a game-changing executive order allowing 401(k) retirement funds to invest in cryptocurrencies, potentially bringing trillions of dollars into the sector.
Technically, Bitcoin and Ethereum are breaking out toward multi-year highs, with BTC leading and ETH close behind—setting the stage for a possible "altseason" if these levels hold and capital rotates into altcoins.
This content is not directed to residents of the EU or UK. Any opinions, news, research, analyses, prices or other information contained on this website is provided as general market commentary and does not constitute investment advice. ThinkMarkets will not accept liability for any loss or damage including, without limitation, to any loss of profit which may arise directly or indirectly from use of or reliance on such information.

Time for Short on GoldMassive Win since last 2 weeks on buy . Now time take a fall . Look for sell from 3380-88 .

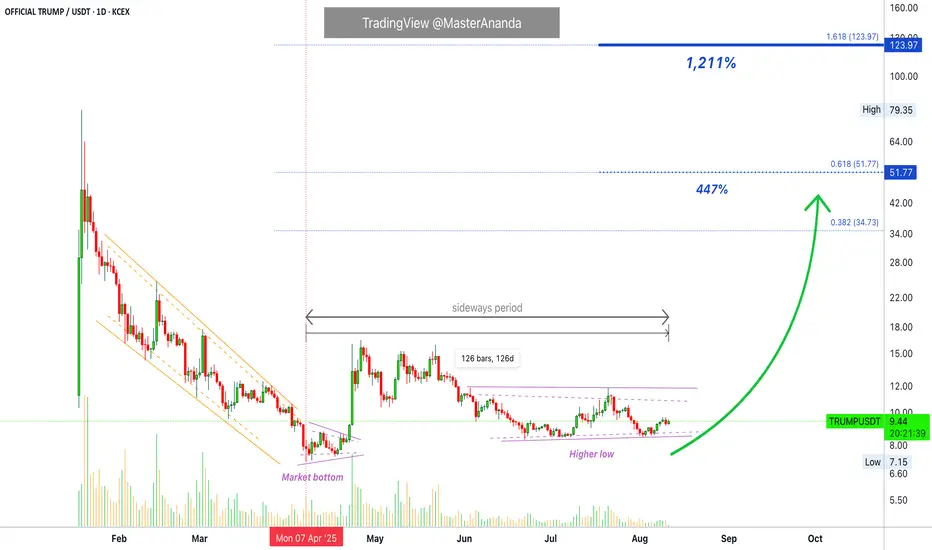
OFFICIAL TRUMP Updated · New Numbers, New Targets & 1,211%Hello my dear follower, it is my pleasure to write for you. I have an update on this memecoin, TRUMPUSDT, and you are going to like it.
Are you one of the many holding long-term?
Have you been able to do it?
What does it feel like?
Is it hard or was it an easy process?
The entire market is in the same situation; either consolidating or growing slowly.
Some pairs can be more advanced than ours but there is no difference if we are only willing to sell high. Some can be behind and catch up or even go beyond one that has been rising for months.
It is a mixed bag. It is better to plan and follow the plan. Opportunities are many and good but you have to make your choice. Your own choices, your own decisions, your results, your responsibility. We are all adults.
TRUMPUSDT has been sideways for four months and nothing changes. The longer this sideways period lasts the stronger the bullish wave that follows. We go straight to a bullish wave because we clearly have a higher low and we know Ether, XRP and Cardano are trading high up. The rest of the market will catch up.
The numbers on the chart have been updated. These are good and valid now and these numbers do not change. You can use it now and forever more they work long-term.
The levels on the chart are main resistance points. $35, $52 and $124.
It will be a nice rise.
It will be a strong rise.
Today the price can be $9.46, in just two months it can be $65. It can be more, it can be less.
There can be a two months long correction after a very strong wave of growth. After these two months long correction we get another advance, the famous bull run.
We are looking at bottom prices now, August 10 2025. It is already late.
It is early to buy, there is still time. But the market will not wait.
The wait is over.
Namaste.
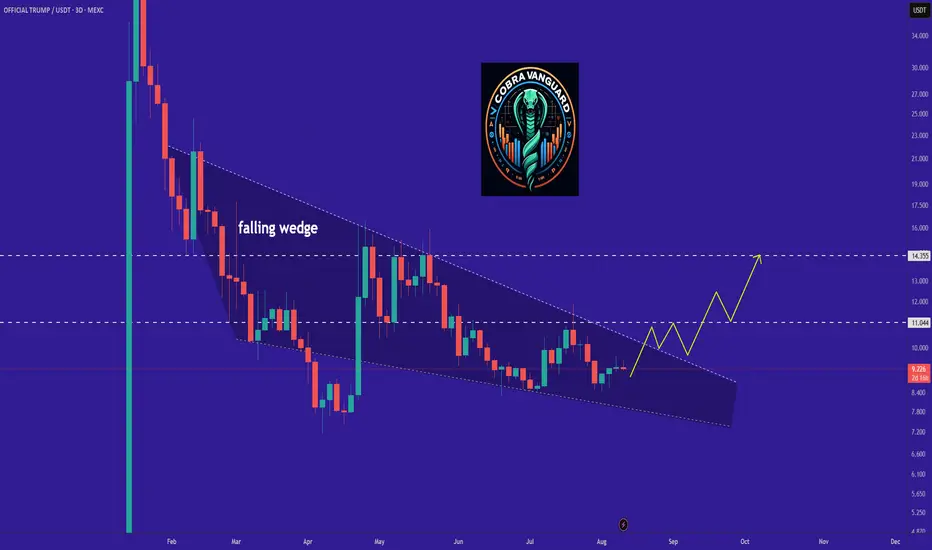
TRUMP is bullish now and many Traders don't see it !!So if you pay attention to the TRUMP chart you can see that the price has formed a Ascending wedge which means it is expected to price move as equal as the measured price movement.( AB=CD )
NOTE: wait for break of the WEDGE .
Best regards CobraVanguard.💚
DXY: Trump's Goal is to Devalue the Dollar!!Hey Traders, in tomorrow's trading session we are monitoring DXY for a selling opportunity around 98.300 zone, DXY is trading in a downtrend and currently is in a correction phase in which it is approaching the trend at 98.300 support and resistance area. On the other hand Trump is looking towards devaluing the dollar in order to refinance the US depth and stimulate the economy.
Trade safe, Joe.

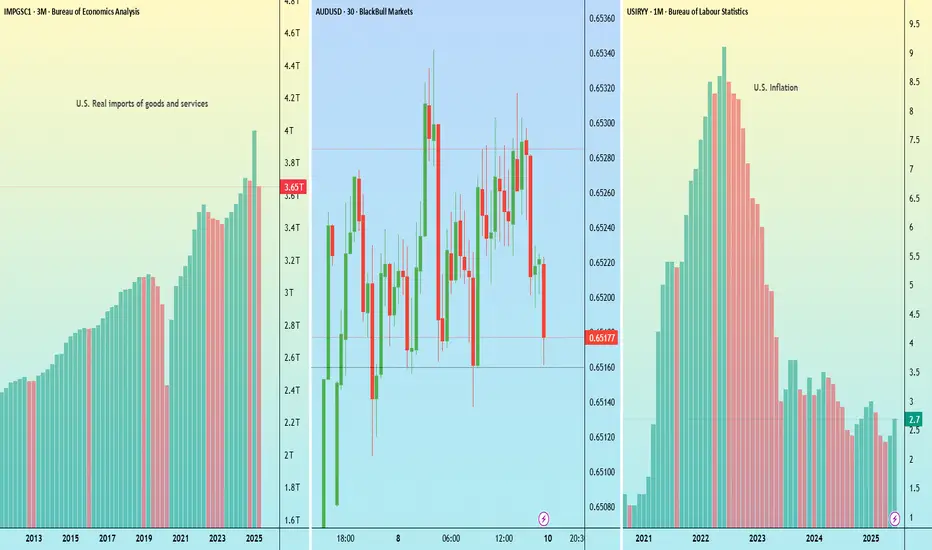
Tuesday’s triple risk: Tariffs, RBA rate cut, and U.S. inflationTraders face a busy Tuesday with developments on U.S. China trade talks, a RBA policy decision, and the latest U.S. inflation data.
U.S. China tariff deadline – Tuesday
The current truce between the U.S. and China is set to expire on 12 August, with U.S. Commerce Secretary Lutnick indicating it will likely be extended by 90 days. China may also face an additional 25% tariff on Russian oil imports, like measures already applied to India.
RBA announcement – Tuesday
The Reserve Bank of Australia is widely expected to cut rates, with a Reuters poll showing all 40 surveyed economists anticipating a 25bp reduction to 3.60%. The broader market is pricing a 98% probability of that outcome and a 2% chance of a larger 50bp cut.
U.S. CPI – Tuesday
Headline U.S. CPI for July is expected to rise 0.2% month-on-month taking the annual rate to 2.8% from 2.7%. Wells Fargo notes that the figures may show further signs of higher tariffs feeding into consumer prices.
DogecoinDoge usdt Daily analysis
Time frame 4hours
Risk rewards ratio >2
Dogecoin always has a good volume in the market
Investors know that Musk is interested in Dogecoin, and this is a positive point for this currency. The currency was created as a joke but found its place and now Doge has drawn a clear path for itself and for enthusiasts.
The price is now fluctuating in an ascending triangle. It's very dangerous if market crashed down but I think sentiment of market is positive after Trump.
Of course we must be careful
So my target is not dreamy
I am watching the market and waiting for suitable time to enter again for higher target on 0.73 $

$TRUMP (TRUMP) 6HPrice rejected from $9.60 and is now pulling back toward the $9.05 support zone.
Holding above this level could trigger a bullish reversal targeting $10.00 first, then $11.00.
Structure remains intact as long as $9.05 holds.
$TRUMP continues to benefit from strong social media traction and growing political narrative hype.

Xrp (Ripple)Ripple
Xrp usdt Daily analysis
Time frame daily
Risk rewards ratio >3.2 👈👌
Target 3.2$
Ripple technical analysis ✅️
My last short position reached the target.
Head and shoulders pattern completed.
Now it is a good time to start
My critical area is red box that you see on the chart. It is very important area .
If Ripple can reach and break this resistance, we will have a good pump
But now 3 _3.2$ is a good target

Trumponomics 2.0 – Chaos on the Left, Crypto on the Right🧨🗽 Trumponomics 2.0 – Chaos on the Left, Crypto on the Right 🧠💸
The system is shaking, and Trump is rolling the dice—again.
Geopolitical tensions are exploding:
🇮🇳 India hits back on tariffs
🇨🇳 China flexes tech dominance
🇷🇺 Russia & 🇺🇦 Ukraine face renewed pressure
💣 Wars rage in Ukraine and Gaza
📉 Bonds sell off
💵 The U.S. dollar? Fund managers are the most bearish in 20 years
And in the middle of this storm:
Trump floats an executive order allowing crypto into 401(k) retirement plans.
That’s Trumponomics 2.0 — the new age of controlled chaos, currency doubt, and crypto as the unexpected golden child. It’s messy. But for Bitcoin? It’s momentum.
📊 While the headlines scream uncertainty, the BTC chart quietly reclaimed the key structural level at $115,800. This isn't just price action — it's macro meets technicals, and BTC is the beneficiary.
💥 As I’ve said: I’m hedged.
✔️ Long BTC
❌ Short S&P 500
My recent idea “Bitcoin vs S&P 500 – Ratio Signals Strength” explains exactly why this positioning continues to pay. ( )
🎯 Levels to watch:
Major Support: $115,800
Next Resistance: $122,795 → $132,595
Risk Below: $109,768
Let the media debate Trump. Let the markets debate Powell. I’ll stick with what the charts are saying.
Because the story isn’t just crypto in 401(k)s.
The story is this:
Crypto is being chosen while the system is questioned.
One Love,
The FX PROFESSOR 💙
Disclosure: I am happy to be part of the Trade Nation's Influencer program and receive a monthly fee for using their TradingView charts in my analysis. Awesome broker, where the trader really comes first! 🌟🤝📈

Ravencoin ( RVN)RVN usdt Daily analysis
Time frame 4hours
Risk rewards ratio >1.5
Target = 0.01133
Short position for short time

Crude Oil Weekly Outlook: Tariffs, Ceasefire, OPEC & CPI RisksKey Events This Week
• WTI drops to 62.60 ahead of major geopolitical and economic catalysts: Ukraine ceasefire, U.S.–China tariffs, OPEC report, and U.S. CPI
• Global tariff developments continue to shape sentiment and crude demand valuations, especially in relation to OPEC’s evolving supply strategy
WTI’s latest drop is currently holding at the 0.618 Fibonacci retracement of the May–June uptrend, and precisely at the neckline of the inverted head and shoulders pattern around the 62.60 level. The Fibonacci retracement was applied from the $55 low to the $77.80 close, filtering out breakout noise from the Iran–Israel escalation outside the borders of the 3-year down trending channel.
• If 62.60 breaks, downside risks may accelerate toward the mid-zone of the channel, with key levels in sight at 61.40, 59.40, and 55.20, respectively.
• If 62.60 holds, and WTI reclaims ground above 65, we could see a recovery toward the upper edge with next resistance levels at 68.00, 70.00, 71.40, and 72.70.
Written by Razan Hilal, CMT

Curve (crv)Crv usdt Daily analysis
Time frame 2hours
Risk rewards ratio >2.3 👌👈
Technical analysis
CRV is caught in a triangle. In similar cases, the price breaks out from the bottom or top of the triangle.And we'll have to wait and see where it comes from.
But why is my analysis a bullish one?
This bullish analysis is solely for the purpose of examining market sentiment.
Given the positive news we hear in the cryptocurrency market and the positive sentiment of buyers in this market, we come to this bullish analysis.
Risk rewards ratio is another good point for this analysis
Ratio 2.3 makes me a brave heart analyzer.
Only by introducing a false selling pressure can this analysis be failed. So , I put my LS in correct place. Of course I know the power of stop hunters.

GrinGrin usdt Daily analysis
Time frame daily
Risk rewards ratio >3.2 👈👌
Red line is historical support line
Grey line is a short time resistance line that broke before . So trade on this asset has a good benefit for even amateur traders

makermkr usdt daily analyses
time frame daily
risk rewards ratio>8
maker is a good asset which I have in my watchlist
chart is clear
we have a Descending triangle and price is ready to pump and reaches my target on 1734$
we have a very important event on Wednesday and all of traders and investors are waiting for that news.
I guess that we will have a good news but also I am ready for everything
my LS is very tight and I am online 4hours before of event to watch closely and carefully

Binance coinBnb usdt Daily analysis
Time frame daily
Risk rewards ratio >2.3 👈
Target 830$
Technical analysis 👇
Look at the chart carefully
Bnb is moving between two gray lines and down side of this is strong support line
Three parts of Correction is finished and price start the fist part of moving.

BnbBnb usdt Daily analysis
Time frame daily
Risk rewards ratio >2.3
Target 843$
Bnb move up and down between two Grey line that you can see on the chart
3 times it dropped but couldn't break the support line and now it is a good time to reach the target ( upper side of grey tunnel )

DexeDexe usdt Daily analysis
Risk rewards ratio >5 👈👌
Time frame daily
First target =16$
2th target = 19.5 $
Stop is very tight. Below of support line.
If price break the support line and my stop , I don't lose because it's very tight. On the other hand, if price reach to my target , I get good benefit

Curve (CRV)Crv usdt Daily analysis
Time frame 4hours
Risk rewards ratio >2.5 👈👌
Target = 0.8$
Moving up and down in the uptrend tunnel

Maker (MKR)MKR usdt Daily analysis
Time frame 4hours
Risk rewards ratio =2 👈👌
Target 2400$
Now is a good opportunity to break the 1930$ resistance and reach to the next resistance area in 2400$
But if mkr can't break this resistance, will fall down to 1600$

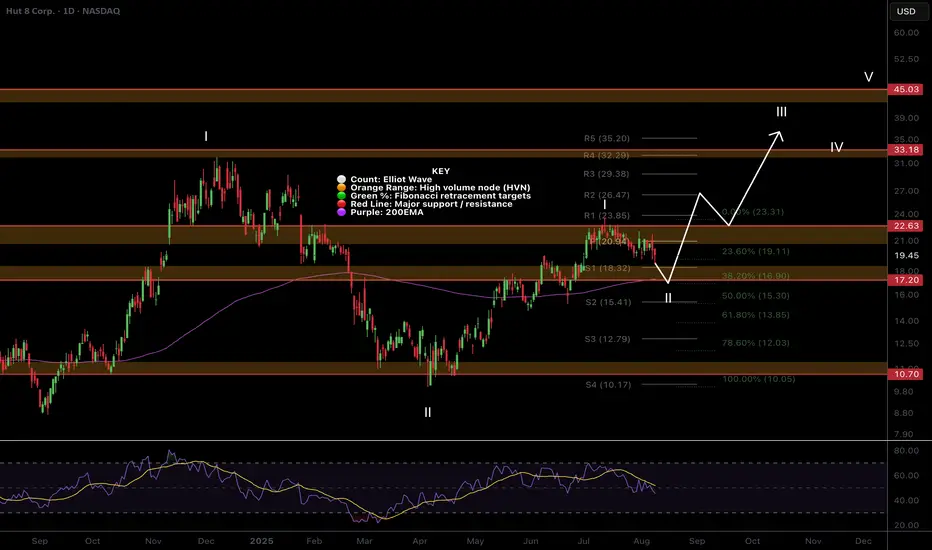
$HUT Pulling back to daily 200EMANASDAQ:HUT appears to have complete a larger degree wave 1 of 3 with wave 2 underway.
Looking at the support below we may have a shallow wave 2 targeting the daily 200EMA, major support High Volume Node at the .382 Fibonacci retracement, $17. A shallow wave 2 often happens in strong trending markets as participants are excited and can't wait to buy!
Daily RSI has plenty of room to fall. $19.5 is also the weekly pivot point where price is also expected to find strong support so we may see a reversal from here at the start of next week but these assets are volatile so i would lean towards lower first.
Bitcoin stocks have all had a decent retracement causing me to upgrade my Elliot Wave count to a completed macro wave 1 with wave 2 now underway, suggesting the best returns are still to come over the next months for this category asset class in wave 3!
Analysis is invalidated if we go to new local highs above $23.46 or lose $9.98.
New long signals are certainly building in the DEMA PBR and Price Action strategies so keep an eye out on the Trade Signals Substack as we have made very food profits lately in these markets!
Safe trading
Watching July 31 High and August 1 Low - Key LevelsUS Inflation Next Week (CPI and PPI)
Will August re-test highs with momentum? Or test and fade?
MAGS back to highs.
AAPL has one of the best weeks since 2020's post covid crash recovery (WILD).
I still like long assets, but playing the game with discipline and patience.
Enjoy the weekend. Looking forward to the grind next week.
Thanks for watching!!!
-Chris
