Will Trump’s crypto lose 26% more after breaking key levels?Hello and greetings to all the crypto enthusiasts, ✌
All previous targets were nailed ✅! Now, let’s dive into a full analysis of the upcoming price potential for Trump 🔍📈.
Trump’s cryptocurrency has undergone a sharp decline, losing all Fibonacci support levels and previously established temporary support zones. I had foreseen this downturn from higher price levels, and current market conditions suggest the potential for at least another 26% drop. A break below the critical psychological support at $10 could accelerate further losses, with my primary downside target set at $9. This scenario aligns with my broader technical analysis, indicating continued bearish momentum in the asset.📚🙌
🧨 Our team's main opinion is: 🧨
Trump’s cryptocurrency is crashing hard, breaking all key supports, and if it falls below $10, I expect at least another 26% drop, with $9 as my main target. 📚🎇
Give me some energy !!
✨We invest hours crafting valuable ideas, and your support means everything—feel free to ask questions in the comments! 😊💬
Cheers, Mad Whale. 🐋
Trump

Why gold remains strong: Latest on Ukraine and Yemen Gold remains in high demand as a safe-haven asset, currently trading at $2,998.7 per ounce.
Why the need for a haven? Here’s an update:
A ceasefire in Ukraine hinges on some unpalatable conditions. Donald Trump has announced plans to speak with Vladimir Putin on Tuesday, saying that land and power plants are part of the negotiations. Reports suggest his administration is considering recognising Crimea as Russian territory and may push for UN recognition.
In the Middle East, the U.S. carried out military strikes over the weekend on Houthi-controlled areas in Yemen. The strikes came after the group threatened to resume attacks on Red Sea shipping.
Trump has declared that Iran will be held directly responsible for “for every shot fired” by the Tehran-backed Houthi rebels. In response, the Houthis vowed to “respond to escalation with escalation.”.

Nasdaq pushIv been watching this chart for a long time now and it seems on the 6month chart we are retesting the last candle close and coming down to lower-time frames i can see consolidation and a mix on reversals here im looking at it as one big break and retest

17/03/25 Weekly outlookLast weeks high: $85,306.40
Last weeks low: $76,622.98
Midpoint: $80,964.69
It's FOMC week again! Last week it was CPI week and inflation numbers came in under forecast signaling the Tradfi market sell-off and implementation of tariffs have at least had a positive impact on the consumer price index, a 2.8% print 0.1% lower than forecast. As this relates to FOMC the forecast is a non mover with interest rates staying at 4.5%.
However this does not necessarily mean that FOMC will be a non event in terms of the markets, volatility is always expected and with a suspected Trump insider opening a $380m 40x short position on BTC with a liquidation price of $86,600. I expect this price to be hit at some point this week purely because CT is targeting this account that has had a perfect 8/8 trade record to stop hunt it, I think FOMC could proved the volatility to do it.
The general structure of BTC as a whole despite this stop hunt narrative is bearish, after losing $91k support and a retest confirming the level as new resistance structurally it makes sense to revisit FWB:73K to retest it as support. This would be horrible for the broader altcoin market that has suffered greatly so far this year but it would eliminate the need to fill the FVG in the future.
This week I am keeping a close eye on that stop hunt and FOMC as I feel that will dictate if we retest $91K or $73K.

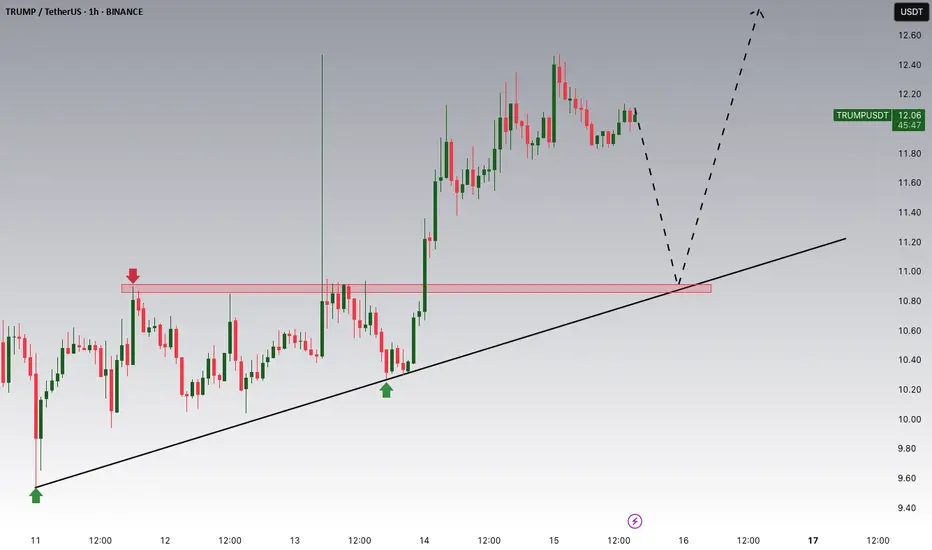
TrumpHello Traders,
Today we are posting a trade we see that we know you are all eyeing. BINANCE:TRUMPUSDT
This is a trade we saw in our weekly trade hunt. If you are not familiar in TA and have a hard time understanding the chart feel free to reach out to us and we will happily help you understand.
Stay profitable,
Savvy

WIF/USDTHello friends
According to the market cycle, the price decline is ongoing and is expected to continue.
Now the only important support is the green area, which the price reaches there and we will see what reaction we get from the buyers.
Will they support the price or will the decline continue...
If you want to be with us in this alt season, send us a message.
*Trade safely with us*

TRUMPUSDT LongConsolidation between 11 - 14,5 levels on Trump H4 chart, Now price is at support zone. We can buy at catch this small uptrend. Risk reward 1/2

$TRUMP ─ @realDonaldTrump Long Trade SETUP$TRUMP ─ @realDonaldTrump Long Trade SETUP 👀
Looking for another long trade entry.
⚠️If the Twin OB fails, then a new low is on the table.
ENTRY = TwinOB + FibFan + nPOC + Fib Golden Pocket + WO + DO
SL = below VAL + TwinOB
------------
------------
As always, my play is:
✅ 50% out at TP1
✅ Move SL to entry
✅ Pre-set the rest of the position across remaining TPs
It's important to take profits along the way and not turn a winning trade into a losing trade.

TRUMP Is Trying To SpikeHey Traders, in today's trading session we are monitoring TRUMPUSDT for a buying opportunity around 11 zone, Trump is trading in an uptrend and currently is in a correction phase in which it is approaching the trend at 11 support and resistance area.
Trade safe, Joe.
MAV/USDTHello friends
After a heavy fall, now with the trend line broken and the ceiling and floor hit higher, it is expected to move to the resistance area.
You can enter the capital with capital management.
*Trade safely with us*

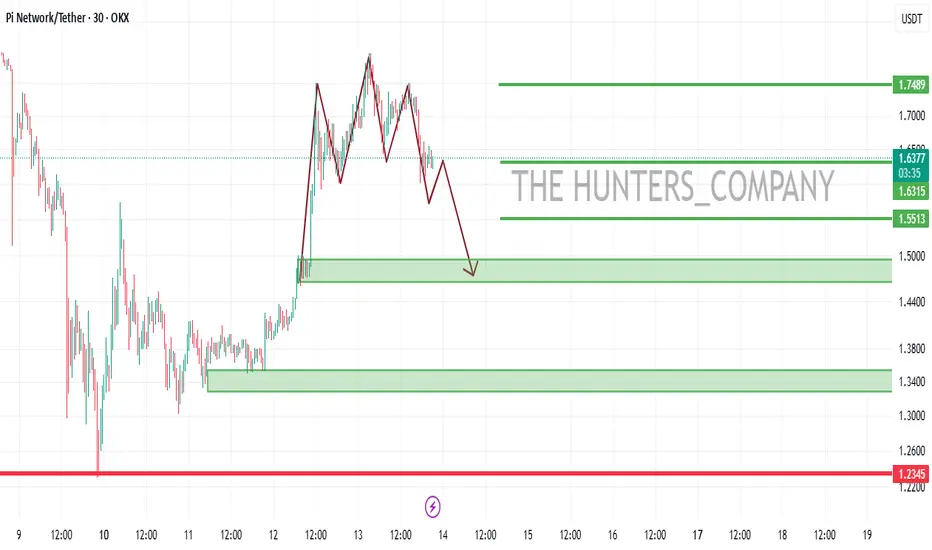
PI...Hello friends
Given the good growth we had, we now have the opportunity to buy in the pullback...
You can buy in steps within the limits we have specified for you with capital management...
*Trade safely with us*
Lets Make Life Changing Money TogetherMartyBoots here , I have been trading for 17 years and sharing my thoughts on CRYPTOCAP:OTHERS .
.
CRYPTOCAP:OTHERS is looking beautiful , absolutely beautiful and a very interesting chart for more upside, it is now getting into support. Just like NASDAQ:AMZN did back in 2008.
Do not miss out on CRYPTOCAP:OTHERS as this is a great opportunity to make life changing money on ALT Coins.
Regulation is going to moon this market
Be Ready
Watch video for more details

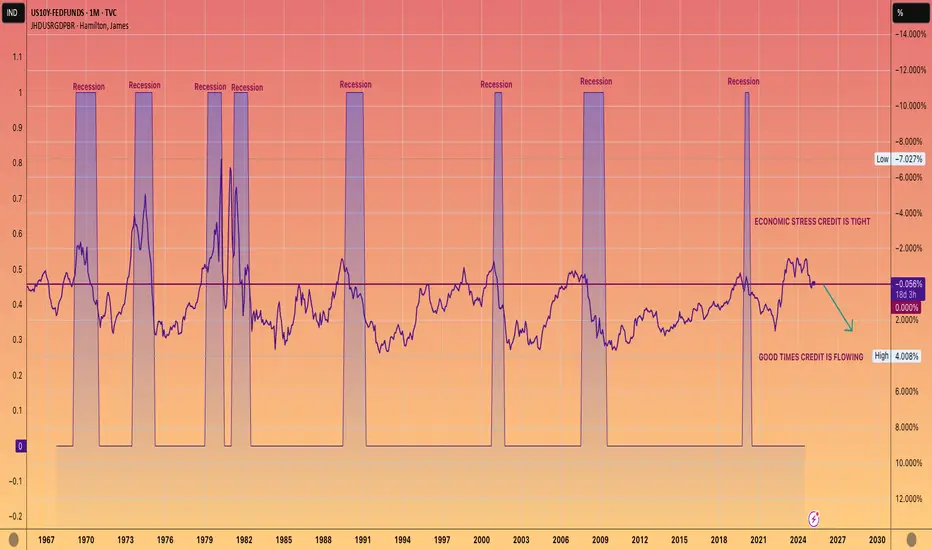
WE ARE COMING OUT OF A RECESSION. NOT GOING INTO ONE.This chart shows 10-year yield, which is closely tied to mortgage rates, minus the Federal funds rate.
When this figure is negative, it typically indicates that we are experiencing a recession or economic downturn.
Conversely, a positive number usually aligns with economic growth, often referred to as the good times.
While it's up to you to determine the reasons behind a official recession not being declared during the Biden administration, the undeniable data reflects a prolonged period of economic strain.
However, the current trend seems to be shifting towards a positive reading, which should lead to more accessible lending and economic growth.
AKA The good times are coming.
the Head and Shoulders of the Month!Hello TradingView Family / Fellow Traders. This is Richard, also known as theSignalyst.
📈 This week, XRP rejected the $2 support level and has been trading higher.
Today, XRP formed an inverse head and shoulders pattern and broke its green neckline upward.
🏹 As long as the bulls hold, a movement towards the upper bound of the falling red channel would be expected.
📚 Always follow your trading plan regarding entry, risk management, and trade management.
Good luck!
All Strategies Are Good; If Managed Properly!
~Rich

XRP | Rug is playing outPrice seems like its distributing more than looking to accumulate. Trumps inauguration was a market top call.

EURUSD: Trump’s trade war crosses the Atlantic You may be sick of hearing about tariffs, but they are currently the catalyst for a huge amount of volatility in the market and a huge amount of trading opportunities.
And now Trump’s trade war has crossed the Atlantic
Today, the European Union announced retaliatory tariffs on approximately €26 billion worth of U.S. goods in response to President Donald Trump's recent increase in tariffs on steel and aluminum imports. Targeted products include Harley-Davidsons, bourbon, and jeans—key American exports that have been caught in previous trade disputes.
The EU has said it remains open to negotiation but has not ruled out further action.
In response, Trump vowed to retaliate, stating, “Of course I’m going to respond.” The daily chart for the EUR/USD shows the pair could fall into a larger corrective decline, given overbought RSI conditions.

International politics is now a high school dramaSo, Trump was all like, “Let’s slap an extra 25% tariff on Canadian steel and aluminum,” which meant total duties shot up to 50%.
Why? Because Ontario put a 25% tax on electricity exports to the U.S. And Doug Ford? He was not having it—saying he’d “respond appropriately” and “not back down.” But —he totally backed down and scrapped the tax on electricity exports to Michigan, New York, and Minnesota.
And now, Trump just ditched the extra 25% tariff, and boom— USDCAD broke below the recent low of 1.43986

EURUSD PoVIn recent months, inflation data in both Europe and the United States has shown contrasting trends, creating an uncertain outlook for the EUR/USD pair. In Europe, inflation has remained relatively stable, but with signs of a slight increase, while in the United States, there has been a more pronounced rise in consumer prices. This scenario has prompted the European Central Bank and the Federal Reserve to carefully assess their respective monetary policies, with potential interest rate hikes in the future. At the same time, recent trade policies under U.S. President Donald Trump have added further volatility to the currency market. In February 2025, Trump imposed significant tariffs on imports from Mexico, Canada, and China, raising global concerns. The European Union criticized the Trump administration for not engaging in negotiations to avoid such tariffs, increasing trade tensions. Trump's actions, including the introduction of a universal 10% tariff on all imports and a 100% tariff on cars produced abroad, have raised questions about their effectiveness in strengthening the U.S. economy and reducing the trade deficit. If these policies do not produce the expected results, we could see the dollar weaken, with the EUR/USD pair potentially surpassing the 1.09300 level, a liquidity intersection point. On the other hand, if Trump's measures prove effective in improving the trade balance and supporting the economy, the dollar could strengthen, pushing the EUR/USD pair towards parity. In summary, the future direction of the EUR/USD pair appears uncertain, influenced by central bank policies and U.S. trade strategies, with potential significant movements depending on the effectiveness of these measures.

Solana's important supporthello friends
Due to the heavy demand of Solana and the construction of new floors based on the market cycle, we expect a new floor within the specified range.
If we reach the support range of 105-110 dollars, we can buy with confirmation, of course, with capital management...
*Trade safely with us*

BITCOIN BULLISH TO $116?!After a consolidation phase where late buyers got trapped at the top, we've seen price drop to the downside liquidating multi-billions in buy orders in the past few weeks. I believe this Wave 4 shakeout will be followed by another bull run.
What do you think?

TESLA important support. Are positive days coming?TSLA coming to an important support level. It can bounce back for a while, It dropped %55 from top.
Positive days coming?
Many cryptocurrency dominance charts, as well as Nasdaq and stock charts too, showing the same pattern. Is the reversal starting?
Check my other analysis too.
We’ll see.
This is not investment advice. Please do your own research.
Wishing you best.
-YusufDeli

TradeCityPro | APTUSDT Market Drop on Trump News?👋 Welcome to the TradeCityPro channel!
Let's analyze and review one of the popular tier-2 coins together and take a look at this recent Trump news regarding the economic record
🌐 Overview Bitcoin
Before starting the analysis, I want to remind you again that we moved the Bitcoin analysis section from the analysis section to a separate analysis at your request, so that we can discuss the status of Bitcoin in more detail every day and analyze its charts and dominances together.
This is the general analysis of Bitcoin dominance, which we promised you in the analysis to analyze separately and analyze it for you in longer time frames.
📊 Weekly Timeframe
APT remains inside its large, volatile range, frequently bouncing between its highs and lows. However, this time, it has formed a lower high, which is not a positive sign.
Additionally, after breaking $7.78, sellers completely engulfed the weekly candle, and for the past five weeks, all candles have been red with high selling volume, confirming the downtrend.
There is no buy trigger at the moment, and I cannot recommend a buying opportunity until the market forms a new structure.
For selling, if APT drops below $4.97, it makes sense to exit and accept the loss instead of holding onto a losing position.
📈 Daily Timeframe
On the daily timeframe, APT failed to break the $14.61 resistance. Even worse, it couldn't even reach the previous high before getting rejected earlier, signaling weakness.
After breaking below $8.46, the market entered an MWC (Market Weakness Confirmation) downtrend.
Following the breakdown, a pullback retest occurred, and the daily candle engulfed the previous two days' candles, leading to further decline. Currently, APT is at $5.70, with RSI in the oversold zone, suggesting a possible short-term slowdown in selling pressure.
I personally feel that APT’s drop is sufficient for now, and we might enter a range here before a final move toward the $4.95 support. However, this does not mean it’s a buy signal. We need to wait for a new market structure before considering spot entries.
In the current situation, the market is really not very analytical and Bitcoin is likely to hit the $72,000-$74,000 level and then go for a break or bullishness, and you should pay attention to these market times! Don’t be FOMO!
📝 Final Thoughts
Stay calm, trade wisely, and let's capture the market's best opportunities!
This analysis reflects our opinions and is not financial advice.
Share your thoughts in the comments, and don’t forget to share this analysis with your friends! ❤️

Is Trump’s Golden Age a Recession in the Making? Let’s Find Out“This tariff low key slaps,” says no trader ever as markets get jerked and jolted day in and day out because no one can really figure out what’s happening. On some days, US President Donald Trump wakes up and chooses to slap a tariff or two on America’s closest and biggest allies. On other days, he goes for the pardon.
Turns out, investors don’t really like it. Stock markets left and right wiggled to the point they couldn’t take it anymore — the tech-heavy Nasdaq Composite NASDAQ:IXIC dived into correction territory last week. That is, the index plunged more than 10% from its most recent peak, which was a record high.
Even though Friday was a good day for stocks, the S&P 500 SP:SPX closed out its worst week since September, wiping off 3.1%. Zoom out and you get an S&P 500 that’s barely holding above the flatline since the election. In other words, more than $3 trillion has been washed out from the Wall Street darling since it hit a record high in late February.
Where Do We Stand on Tariffs Now?
So where has the dizzying labyrinth of tariffs landed? And is that final? (No, it’s not.) Trump last week declared that there’s simply “no room left” for Canada and Mexico to bargain over a deal or even a delay. That’s a 25% levy taking effect right there. A day later it was no more — a month-long reprieve for carmakers was introduced.
Then a day later, Trump suspended the 25% levy on almost all goods from its closest neighbors. To this, Trump said that the “big” wave of tariffs is coming in early April to a bunch of countries, including the European Union. Right now, only China’s 20% tariff remains in place.
The roller-coaster ride around who gets slapped with what has sent the dollar TVC:DXY in a freefall — so much so that the markets have started to chat about a “Trumpcession,” (not something you’d like to have your name on). That is, some traders and investors expect Trump’s policies to tip the American economy into a recession.
Swirling fears of a downturn came right as the Federal Reserve apparently managed to stick the soft landing — Jay Powell and his clique of central bankers lowered inflation through interest rate cuts while the economy continued to grow without nosediving into a downturn.
A side worry of the tariffs (with very real front-and-center consequences) is a pullback from the Federal Reserve on its rate-cutting campaign. Analysts are quick to say that the US central bank won’t be looking to trim borrowing costs any time soon. Not with all that White House noise threatening to derail consumer confidence and dent corporate profits and revenue.
Apparently, the huge wave of uncertainty around Trump’s tariff agenda, centered on isolation and protectionism, is making global investors nervous.
In this context, how are you navigating the sea change? What’s your portfolio showing and how do you feel about growth prospects ahead? Share you thoughts in the comment section and let’s chat!
