From $110K to $66K? The Political Game Behind BitcoinBitcoin's surge from $73,000 to $110,000 was purely driven by political factors and Trump's statements. However, after Trump took office, the market was waiting for a stimulus to continue its bullish rally. With Trump's silence and the start of a trade war, sellers took control, leading to a 30% correction from the all-time high.
🚨 Key question: What happens next? 🚨
📉 If Bitcoin doesn’t receive further political support from Trump, we could see a drop below $73,000, possibly even $66,000!
Is this a buying opportunity or a warning sign? Let me know your thoughts! 👇💬🚀
Trump

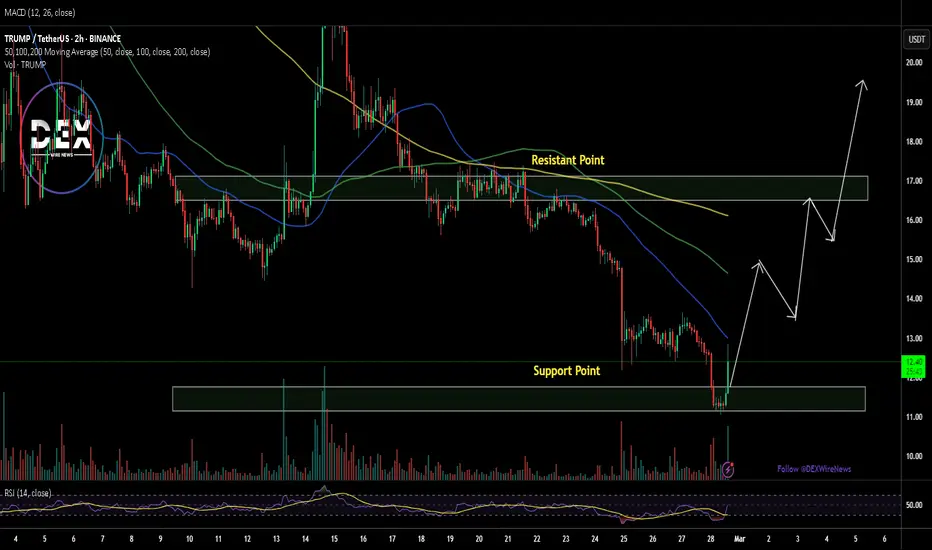
TRUMP COIN NEXT POSSIBLE MOVES AND TRADE IDEAS !!$TRUMP Coin Update & Possible Moves!!
• Two Support areas are marked on chart 12.80$-12.30$ where you are able to build trade on it🫡
Warning : That's just my idea if i take trade i will Update.. DYOR Before Taking any action🚨
D

BTC Inverse H&S ConfirmedIn recent post we slipped on the structure around 92k and are in a rebound zone around 86k with a low of 78k. I believe a bullish rebound will happen starting in the month of March all the way into October. This head and shoulders formation should be the start of a familiar pattern in the 2021 bullish run. This run may lead beyond 150k and above.
This is NFA. Good luck!
-R2C

Trumpty Dumpty back on the WallTrumpty dumpty we had a great fall.
Trumpty pumpty. It’s time to get tall.
Humoty dumpty get in on my call-
Come to MMiQ and perfect your trading of all assets and conditions.

Trump and Zelenskyy Clash | I Predicted BTC crash week ago
As I mentioned a week ago, Bitcoin (BTC) was poised for a correction, and we’ve now seen this play out over the past few days. On the 1D timeframe, Bitcoin tested its Fair Value Gap (FVG) and reversed from that zone. Today’s closing candle showed some bullish pressure, indicating a potential reversal toward the 90,000 – 92,000 range. The FVG was tested cleanly, and the reversal was strong.
What’s Next? Donald Trump and Zelenskyy Clash
While the market showed a healthy reversal from the FVG, recent news of a clash between Donald Trump and Zelenskyy at the White House has introduced uncertainty. Trump’s statement that “President Zelenskyy is not ready for peace” has created a negative sentiment in the market. If tensions escalate further, this could lead to a bearish impact on the market, as geopolitical instability often weighs on risk assets like Bitcoin.
Expected BTC Zones
Given the current situation, here are two possible scenarios:
Scenario 1: Bearish Impact from Geopolitical News
If the clash between Trump and Zelenskyy escalates and fear spreads in the market, Bitcoin could drop to the 73,500–76,000 zone in the coming days.
Scenario 2: Recovery Continues
If the news has a limited impact and the market stabilizes, Bitcoin could continue its reversal from the FVG and gradually move back toward the $92,000 zone.
Key Takeaways:
Trade with Caution:
Given the current geopolitical developments, it’s crucial to trade carefully and use stop losses to protect against sudden market moves.
Monitor News:
Keep an eye on further developments between Trump and Zelenskyy, as they could significantly influence market sentiment.
Note
My goal is to simplify the chart and help you understand the price action clearly. I avoid overloading the chart with unnecessary indicators or creating confusion. My analysis focuses on keeping the chart clean and straightforward.
Thank you!

$TRUMP Coin on the Verge of a Major Breakout: Can It Reach $30?The cryptocurrency market is buzzing with excitement as $TRUMP coin approaches a critical resistance level. Currently trading near $17, the token has already broken a significant Break of Structure (BOS), hinting at a potential bullish surge. If $TRUMP successfully breaches this resistance point, technical indicators suggest a remarkable 200% rally, pushing the price toward $30.
Technical Analysis
A closer look at $TRUMP’s daily chart reveals key bullish signals:
The $17 mark has proven to be a significant resistance level. A confirmed breakout could trigger a strong uptrend, with $30 as the next major target. The Relative Strength Index (RSI) is currently at 48, indicating neutral momentum. However, with buying pressure increasing, RSI could soon move into the bullish zone, reinforcing the uptrend.
The token's recent candlestick formations suggest a bullish engulfing pattern, which often precedes a strong rally. The $11 price point has emerged as a crucial support level. If this level holds, bulls could maintain momentum. However, a break below $11 may lead to a strong sell-off.
Trump Organization’s Metaverse & NFT Plans
The Trump Organization has officially filed a trademark application for 'TRUMP' to launch a metaverse and NFT trading platform. This development aligns with the growing trend of Web3 adoption by prominent figures and institutions.
A metaverse and NFT ecosystem tied to the Trump brand could significantly increase interest in $TRUMP coin, driving speculative demand and institutional involvement. If the project gains traction, it could serve as a major long-term growth factor for the token’s valuation.
What’s Next for $TRUMP Coin?
With both technical and fundamental indicators aligning, $TRUMP coin is at a pivotal moment. The key level to watch remains the $17 resistance. A decisive breakout could ignite a major rally toward $30, while failure to hold above support at $11 might trigger a correction.

Yellow Boy Shorting EurosEUR
With Trump's statements, the wick I was waiting for in the euro came and now I will wait for it to fall below the trend, then I think a nice short awaits us. The 0207 03 region looks good as the first support. I expect DXY to rise to the 108.5 area.

Why is the market crashing?Why Did Bitcoin Crash to $78K? Here’s What’s Driving the Panic
Bitcoin soared to an all-time high of $109K in January 2025, but last night, it crashed to $78K, a brutal 26% drop, leaving it hovering around $80K. The market’s in full panic mode, and after digging into the latest news, here’s why: Trump tariffs, the Bybit hack, and a mix of other pressures are to blame.
1. Trump Tariffs: Trade War Chaos
The Trump administration’s new tariffs, 25% on Mexico and Canada, 10% on China, are shaking up global trade. Here’s the impact on Bitcoin:
Uncertainty Surge: Higher costs and trade disruptions spook investors.
Risk-Off Mood: People ditch volatile assets like Bitcoin for safer bets like bonds.
Sell-Off Trigger: The fear of an economic slowdown is hitting crypto hard.
These tariffs are a major reason for the market’s jitters.
2. Bybit Hack: $1.5B Gone
A massive hack hit Bybit’s Trust Wallet, with $1.5 billion in Ethereum stolen, the biggest crypto heist ever. Here’s why it’s tanking Bitcoin:
Trust Shattered: Security breaches like this make everyone nervous about crypto safety.
Panic Selling: Fear of more hacks or losses sparks a rush to sell.
This event is amplifying the crash big time.
3. Other Crash Fuel
Beyond tariffs and the hack, these factors are piling on:
Macro Fears: Uncertainty over Federal Reserve rate hikes is pushing investors away from risk.
Profit-Taking: After hitting $109K, big players cashed out, adding pressure.
Post-Halving Dip: Bitcoin often corrects after halvings (like 2024’s), and we might be feeling that now.
What’s Next for Bitcoin?
This crash sucks, no doubt, tariffs and a billion-dollar hack are a nasty combo. But Bitcoin’s bounced back from worse. The panic might ease once the news settles, though recovery could take a minute. Keep an eye on trade updates and crypto security news, they’ll drive what’s next.

Market Update & Crypto OutlookMarket Update & Crypto Outlook
Tariffs & Economic Impact
Trump is leveraging tariffs as a negotiation tactic to pressure adversaries into deals. While Europe is reluctant to concede outright, they have little choice. These tariffs are shaking the markets, and we all know how sensitive elites are about their portfolios. By hitting them where it hurts—their wallets—Trump is forcing them to the table.
In my opinion, this strategy will work. Over time, Europe, Ukraine, and even China will likely agree to compromises. As these agreements unfold, market uncertainty (FUD) will ease, restoring investor confidence.
Inflation & Market Sentiment
Markets are pricing in expected quantitative tightening , meaning no interest rate cuts for at least two years. However, I don’t believe tariffs will fuel inflation as much as feared. Reduced government spending and a stronger USD could offset price increases, maintaining purchasing power without printing money.
Until markets realize this, we’ll see uncertainty, but inflation numbers may not be as catastrophic as expected , helping stabilize sentiment.
Crypto & Market Cycle
The bull market isn’t over, but Bitcoin finally experienced real consolidation —without heavy ETF purchases propping it up. The ETF FOMO is over , and that’s actually a good thing. Now, Bitcoin can continue its rally naturally , setting up for its final, most parabolic leg.
Altcoins & The Spark for Altseason
As I mentioned before, a strong dollar combined with the upcoming $5,000 stimulus checks will ignite true altseason . This influx of cash will likely fuel a major altcoin rally later this year , after the new administration distributes the payments.
Conclusion
Yes, it’s been painful—altcoins are bleeding, portfolios are down, and sentiment is low. But capitulation marks the bottom .
Expect a bumpy March , but April and especially May* could be parabolic , making today’s struggles a distant memory. 🚀
(Everything is on the chart, check the arrows)

RENDER (RNDR/USDT) - Potential Bottom & Breakout Incoming? RNDR is showing signs of a potential bottom formation on the daily chart.

Bitcoin (BTC/USDT) DAILY MAKE IT OR BREAK IT?With volatility increasing, the next move could set the tone for the coming weeks. Will BTC break out and push higher, or face rejection and retrace? Watch closely! 👀
What’s your bias? Bullish or bearish? Let me know in the comments!

Keep it simple - set and forget !!1. Accumulate when prices are between 78,000 and 85,000.
2. Sell a portion when prices hit 120,000 to 130,000 - probably this cycle top.
3. Start accumulating again when prices drop to 57,000 to 67,000 for the next cycle.
4. Set price alerts and let it go – don’t worry about checking constantly!
This way, you can stick to the plan without stressing over every price change.
There’s no such thing as getting rich overnight for the average person. Achieving great things takes time and effort. Success is a journey, not a shortcut!!!
NFA

The stock market is not "Crashing"!I keep hearing people saying the stock market is crashing, a mild pullback is hardly a crash, we are not crashing, at least not yet, and maybe not for an extended period.
We use the S&P 500 because it is the best gauge of our markets with the most diverse representation of any of our indices.
A short history of the trend of our stock marker since 1992, correlated to presidencies.
1992-1999 Clinton: Stock market transitioned from fairly flat to a steady ascending path, we reduced our yearly deficit 6 years and had a budget surplus 2 years.
2000-2007 George Bush Jr: Descending or neutral trend most of the 8 years, we broke our 15 year ascending trend and started an overall descending trend. Deregulation led to the recession via predatory lending giving Walmart cashiers $300k loans, banks labeling bad debt as Grade A and banks leveraging 80% of all of Americans money on risky investments. 2008 was devastating for the US Stock market. Increased the yearly deficit 6 of 8 years.
2008-2015 Obama: Converted descending trend back to ascending trend and trended up in a tight ascending channel for the rest of his presidency, while implementing an array of regulations to prevent banks from doing this to America again. Decreased the yearly deficit 6 of 8 years.
2016-2020 Trump.v1: Maintained tight ascending channel and broke out of 15 year resistance, introduced a lot of lot of volatility and uncertainty, ultimately ended term with the market on the same trajectory it was when he took office. Diluted all US Dollars by 50%, 25% of the dilution was in 2020, coupled with $3T of quantitative easing in a single year (2020) and more than $2T direct stimulus, this dilution and excessive stimulus during a supply chain crunch directly conveyed into rising inflation the following 2 years. Increased our yearly deficit every year in office.
2021-2024 Biden: Broke out of ascending path to a much steeper and unsustainable ascending path, likely due to all the stimulus pumped into the market in 2020 & 2021. Hard pull back in 2021/2022 as Interest rates were increased to deter spending to reduce interest rates which skyrocketed to 10% in 2021 and was brought back down to just above 2% by 2024. We saw a volatile and sharp ascending channel form. At the end of his term, the market was at top of channel and well above all time highs with some of the most growth in the stock market ever witnessed anywhere on earth, ever, as seen in the charts, nearly doubling the S&P 500 in 4 years, the American economy was booming! Decreased the yearly deficit 2 of 4 years.
2025-2038 Trump.v2: Inherited the market at all time highs on the steepest incline we have witnessed to date, and at a point the market is expected to retract based on the charts. Currently it looks like the S&P could lose 15% or so of its value and still be in our ascending channel of 6 years now. As you can see recent pullbacks don’t even register on a weekly candle. Yes these tariffs and subsequent tariff wars will almost certainly wreak havoc on markets as we already see increase in unemployment, significant drops in consumer confidence, increase in debt ceiling, increase in debt through corporate tax breaks, uptick in inflation and uncertainty in policy but --- we still have a long way to fall before we can call this a bear market or a crash. If we do breakdown from the ascending channel, we can expect the S&P to eye around 3200, or nearly half of its current value. If this administration takes over the federal reserve, they can stimulate the economy to fight the decline and prolong the consequences but those measures will involve further dilution, further debt, further smoke in mirrors, further uncertainty and will likely ignite a ticking time bomb with even greater consequences then outlined here.
So in short, stop saying the market is crashing, it is not. But, be vigilant, there is a high probability of short term pullback and a long term crash based on the charts, historical precedence and current administrations activities.

WTI - Will Oil Return to the Uptrend?!WTI oil is below the EMA200 and EMA50 on the 4-hour timeframe and is moving within its medium-term descending channel. If the downward trend continues towards the demand range, the next opportunity to buy oil with a risk-reward ratio will be provided for us. An upward correction of oil towards the supply range will provide us with an opportunity to sell it.
Despite markets showing resilience to geopolitical uncertainties following recent tensions between U.S. President Donald Trump and Ukrainian President Volodymyr Zelensky, any signs of economic weakness in the United States could prompt investors to raise their expectations for interest rate cuts. However, even if inflation data does not reinforce such expectations, it is unlikely to have a significant impact on the U.S. dollar.
In the United States, inflation remains a major challenge for the Federal Reserve. The overall Consumer Price Index (CPI) rose to 3% in January, dashing hopes for two rate cuts in 2025. However, the market’s reaction was not overly negative, as investors anticipated that the Personal Consumption Expenditures (PCE) index, which the Federal Reserve prioritizes, would be less severe than the CPI.
According to the Cleveland Federal Reserve’s Nowcast model, the core PCE index fell from 2.8% to 2.7% in January, while the overall PCE rate declined to 2.5%. If the actual data released on Friday aligns with these projections and no unexpected increases appear in the monthly figures, expectations for two 0.25% rate cuts may strengthen, exerting downward pressure on the U.S. dollar.
Meanwhile, U.S.President Joe Biden attempted to foster freer elections in Venezuela by extending an offer of cooperation, but this initiative failed. Now, Trump has announced that he will terminate this policy. He also noted that Venezuela is refusing to take back illegal migrants who had arrived in the U.S.
This agreement, which had eased sanctions on oil, gas, and gold, was partially revoked in April 2024 after opposition candidate María Corina Machado was barred from running in the presidential election. Trump wrote on Truth Social: “We hereby revoke the concessions that corrupt Joe Biden granted to Nicolás Maduro of Venezuela regarding the oil deal dated November 26, 2022, as well as the electoral conditions in Venezuela, which the Maduro regime has failed to meet. Additionally, the regime has not returned the violent criminals it sent to our great America as quickly as promised. Therefore, I am ordering that Biden’s ineffective and unmet concessions be revoked as of the March 1 extension date.”
Today, Trump escalated his stance on Venezuela by canceling Chevron’s oil license. This move was prompted by Caracas’s refusal to accept deportees and implement democratic reforms. President Trump announced that he would revoke the Biden-era license that had allowed Chevron to produce oil in Venezuela.
This decision appears to be a significant setback for Chevron, the American oil giant. On his social media platform, Truth Social, Trump stated that he would rescind the license granted on November 26, 2022, which had permitted Chevron to operate in Venezuela.

OFFICIAL TRUMP : Urgent Update (Complete Meltdown —Now 700% Pot)Good evening my friends, I have a much needed update for you for the TRUMPUSDT pair and chart.
First, you can buy and continue buying and buy more, because, regardless of the short-term action what follows this situation we are witnessing now is growth. You can be certain about it.
The previous chart setup we looked at had a complete breakdown. This breakdown is a "weak" lower low. This is weak because the previous low happened at $14 and the current one at $12. Which means that this is a market induced shakeout.
Now that support has been broken and TRUMPUSDT is trading lower we need to consider a new entry.
The spot trading strategy is to buy each time prices drop. Each time TRUMPUSDT moves lower we buy and reload. If we are left without ammunition (capital), we simply wait/hold. Nothing changes for waiting a few days.
If you trade with leverage then you need a new entry as the previous position more likely than not has been liquidated, depending on the amount of leverage you use.
The next strong support is $11.83 based on Fib. retracement. This level hasn't been hit. Any trading above this level can be considered a good entry (above support).
Volume is low on the drop. We have a lower low but volume is lower. This means that the bearish move is losing force. Soon, we are going up.
The market gives. The market takes.
Patience is key.
We will soon enter a marketwide bullish phase. (March 2025)
Thank you for reading.
Feel free to message if you have any questions.
Namaste.

NVDA Earnings - Must Watch EarningsNVDA Earnings Wednesday after market
This is crazy that 1 stock may be the pain or gain for the markets in 2025
Glass Half Full
-NVDA is a revenue monster
-Earnings trend continues to point higher
-Demand for chips remains high (minus DeepSeek scare and uncertainty)
-19% weight on SMH
-7% weight on SPY
-8% weight on QQQ
-NVDA bullish can single handedly lift the markets and renew optimism and risk appetite
Glass Half Empty
-NVDA is overvalued
-NVDA hasn't hit all-time highs since Nov 2024 (with fakeout in Jan 2025)
-NVDA's reign is over and competition is heating up in the chips space and AI arms race
-NVDA bearish can be the wave of risk off that confirms current market concerns and fears
It's a big deal - plan and trade accordingly. Thanks for watching!!!

Now it’s an EU trade war Trump wantsDonald Trump has threatened to impose 25% tariffs on the European Union, bizarrely stating that the 27-member bloc was “formed to screw the United States.”
Without providing further details, he hinted at targeting carmakers, saying, “We have made a decision and we’ll be announcing it very soon.” The EU has vowed to retaliate immediately if the tariffs take effect.
EUR/USD tested resistance around 1.0536 before sellers stepped in around the time of Trump's announcement. The pair remains under pressure, trading below the 50-day EMA, while the 200-day EMA is flattening, offering a potential target besides the 38 and 50% Fibonacci levels on the chart.

The fate of Litecoinhello friends
Here we have two scenarios:
1_ Channel failure and reaching specified goals.
2_ Falling from the roof of the channel and buying in steps.
Considering the high probability of approval of Litecoin ETF, the first scenario is more tolerant.
*Trade safely with us*

GOLD - Still Bullish Indeed!Hello TradingView Family / Fellow Traders. This is Richard, also known as theSignalyst.
📈XAUUSD has been overall bullish, trading within the rising wedge marked in orange.
Moreover, the blue zone is a strong structure and support.
🏹 Thus, the highlighted blue circle is a strong area to look for buy setups as it is the intersection of structure and lower blue trendline acting as a non-horizontal support.
📚 As per my trading style:
As #GOLD is around the the blue circle zone, I will be looking for bullish reversal setups (like a double bottom pattern, trendline break , and so on...)
If the blue zone is broken downward, a deeper bearish movement towards the $2,775 demand zone would be expected.
📚 Always follow your trading plan regarding entry, risk management, and trade management.
Good luck!
All Strategies Are Good; If Managed Properly!
~Rich
Disclosure: I am part of Trade Nation's Influencer program and receive a monthly fee for using their TradingView charts in my analysis.

Enormous Bull Flag Rocket Setup $35How huge this is may even hit all time highs.. Trump is in the news

TRUMPUSDT! - $20 it is!Look, I think I was the one who was so bearish on trump and I am happy my bearish stances happened! For new buyers its something they wont Miss, My prev chart, Ive drawn a big candle which shows local OB's acting on presence of Strong DOM. What Can we do here? I would say I am heavy longs here and would wait for a small retrace back and sell my bags at $20, This is something one cannot miss. Lots on nPoC and vPoC with FVG's made, stances are marked for future as DOM is thin now.
Make your path clear and understand and see my previous charts for you to understand what to do!!

DJT - Parabolic Move IncomingNASDAQ:DJT is soon in my mind to begin the most insane of rallies. This chart for me is as clean as they come!
Recent Price Action
From the peak of October 2024 to recent days in February 2025 - the stock has seen a ~46% correction, in what is likely the completion of an Elliott Wave 2 correction (in X,Y,Z form).
This after a bullish initial Wave 1 formation saw it go beyond even the most bullish of bullish initial price targets, in just 2 weeks flat.
Price had prior to that been compressed inside a downwards-pointing wedge pattern (orange lines), since late March 2024. This is one of my most favourite bullish chart patterns. It often leads to explosive price action.
After breaking out of the wedge, it is now not-only putting the finishing touches to an Inverse Head & Shoulder pattern (grey text)... but when it does so it will also complete a massive Cup & Handle formation (white arrows).
Future Price Targets
The initial target (T1) from this move would be $570 (20x) in a very short period. Perhaps even by end of June 2025. This would coincide with the 1.414 fibonacci level. Drawn from its initial introduction to public markets to its peak just weeks later.
Thereafter, an extended 5th wave target of $1,020 (43x) could be reached sometime around late November 2025 and January 2026. This coincides with the 1.618 fibonacci level (darker blue T2 line).
Price as of today has overshot the 0.382 fibonacci line and back-tested the previously-formed left shoulder. It is likely to find support here on the yellow line.
Next Up...
Volume has been pitiful of late. Watch it ramp-up again in the next few days, just like we saw in September 2024 when it completed its full retrace.
It is my expectation that we will see rest of the markets surprising bears, with a huge reversal before March, perhaps even combined with a significant dollar devaluation.
During this time when volume picks-up, a sharp reversal to the upside out of its latest wedge (dark red lines) is possible before the week ends on 28th February. If this occurs, this will likely confirm the end to Wave 2 of 5.
If there is any further downside to come, the absolute worst case scenario will likely be ~$18 - coinciding with the 0.238 fib. However this is not expected, just something to be wary of.
NASDAQ:DJT from here is ready to begin the most volatile of Elliott Waves, Wave 3. If volume persists, price will be drawn like a magnet to the horizontal sloping trend line in bold white.
Possible Elliott Waves
Wave 1 - $12 to $55
Wave 2 - $55 to $24
Wave 3 - $30 to $570
Wave 4 - $570 to $175
Wave 5 - $175 to $1,020
Ridiculous targets, right? So what could be the catalyst?
With the appointment of Kash Patel, we may now start seeing legal action taken against entities & individuals involved with naked short positioning. NASDAQ:DJT even in it's short history has been a prime target for this since 2022.
NASDAQ:DJT may be partially or heavily-involved with the Sovereign Wealth Fund being discussed for the United States.
NASDAQ:DJT may also complete the long-rumored acquisition of Bakkt Holdings ( NYSE:BKKT ). Perhaps even obtaining a minority stake in TikTok.
Short squeeze, M&A, fraudulent recovery, purchases of ETHUSD or just plain old organic price discovery - you pick your poison. But if you thought you'd seen NASDAQ:DJT reach its peak prior to the elections, be prepared to rethink your views.
NASDAQ:DJT has a LOT of room to the upside still from here. Make sure at the very least, you keep this one on your watch-list.
----
Note : This post was originally published on 2nd November 2024 in the lead-up to the election. It was popular but was hidden due to an error on my part including a private indicator. It has now been updated to account for recent price action & timing.
